Debug built-from-source Deephaven with PyCharm
When building Deephaven from source code for development tasks, you can debug both your own code and Deephaven's Python source (the deephaven package). This is particularly useful for:
- Contributing to Deephaven development.
- Understanding how Deephaven works internally.
- Debugging issues that require stepping through Deephaven's Python source.
- Testing changes to Deephaven itself.
This guide walks through setting up the remote debugging server in PyCharm for source-built Deephaven. The debug server is a paid PyCharm feature. Prerequisites lists which editions include it.
PyCharm's debugger reaches only Python code. Deephaven's query engine is Java, so PyCharm can't step into it. The engine includes table operations, the update graph, and the compiled formula code. PyCharm can still step into Python functions that a formula calls. To debug the engine, see Debug Deephaven's Java engine.
Prerequisites
This guide assumes you built Deephaven by following the guide on building Deephaven from source. Those steps produce a local clone of the deephaven-core repository in a directory called deephaven-core, and a Python virtual environment for the Deephaven installation. The build guide names that virtual environment ~/my-dh-venv. This guide calls it source-dh-venv. Substitute the name and path you used.
Use PyCharm 2024 or later. Debugging Deephaven with PyCharm 2023 has known problems.
Before 2025.1, the Python Debug Server configuration this guide uses was part of PyCharm Professional. In 2025.1 and later, it's a PyCharm Pro subscription feature. Debug Python code in Deephaven explains which PyCharm releases include which free and paid features.
1. Install pydevd
First, install the pydevd Python package into the source-dh-venv virtual environment. pydevd is the debugger library that connects the Deephaven server's Python process to PyCharm's debug server. The Deephaven server's Python process loads pydevd from source-dh-venv, so install it with source-dh-venv active:
2. Create a PyCharm project
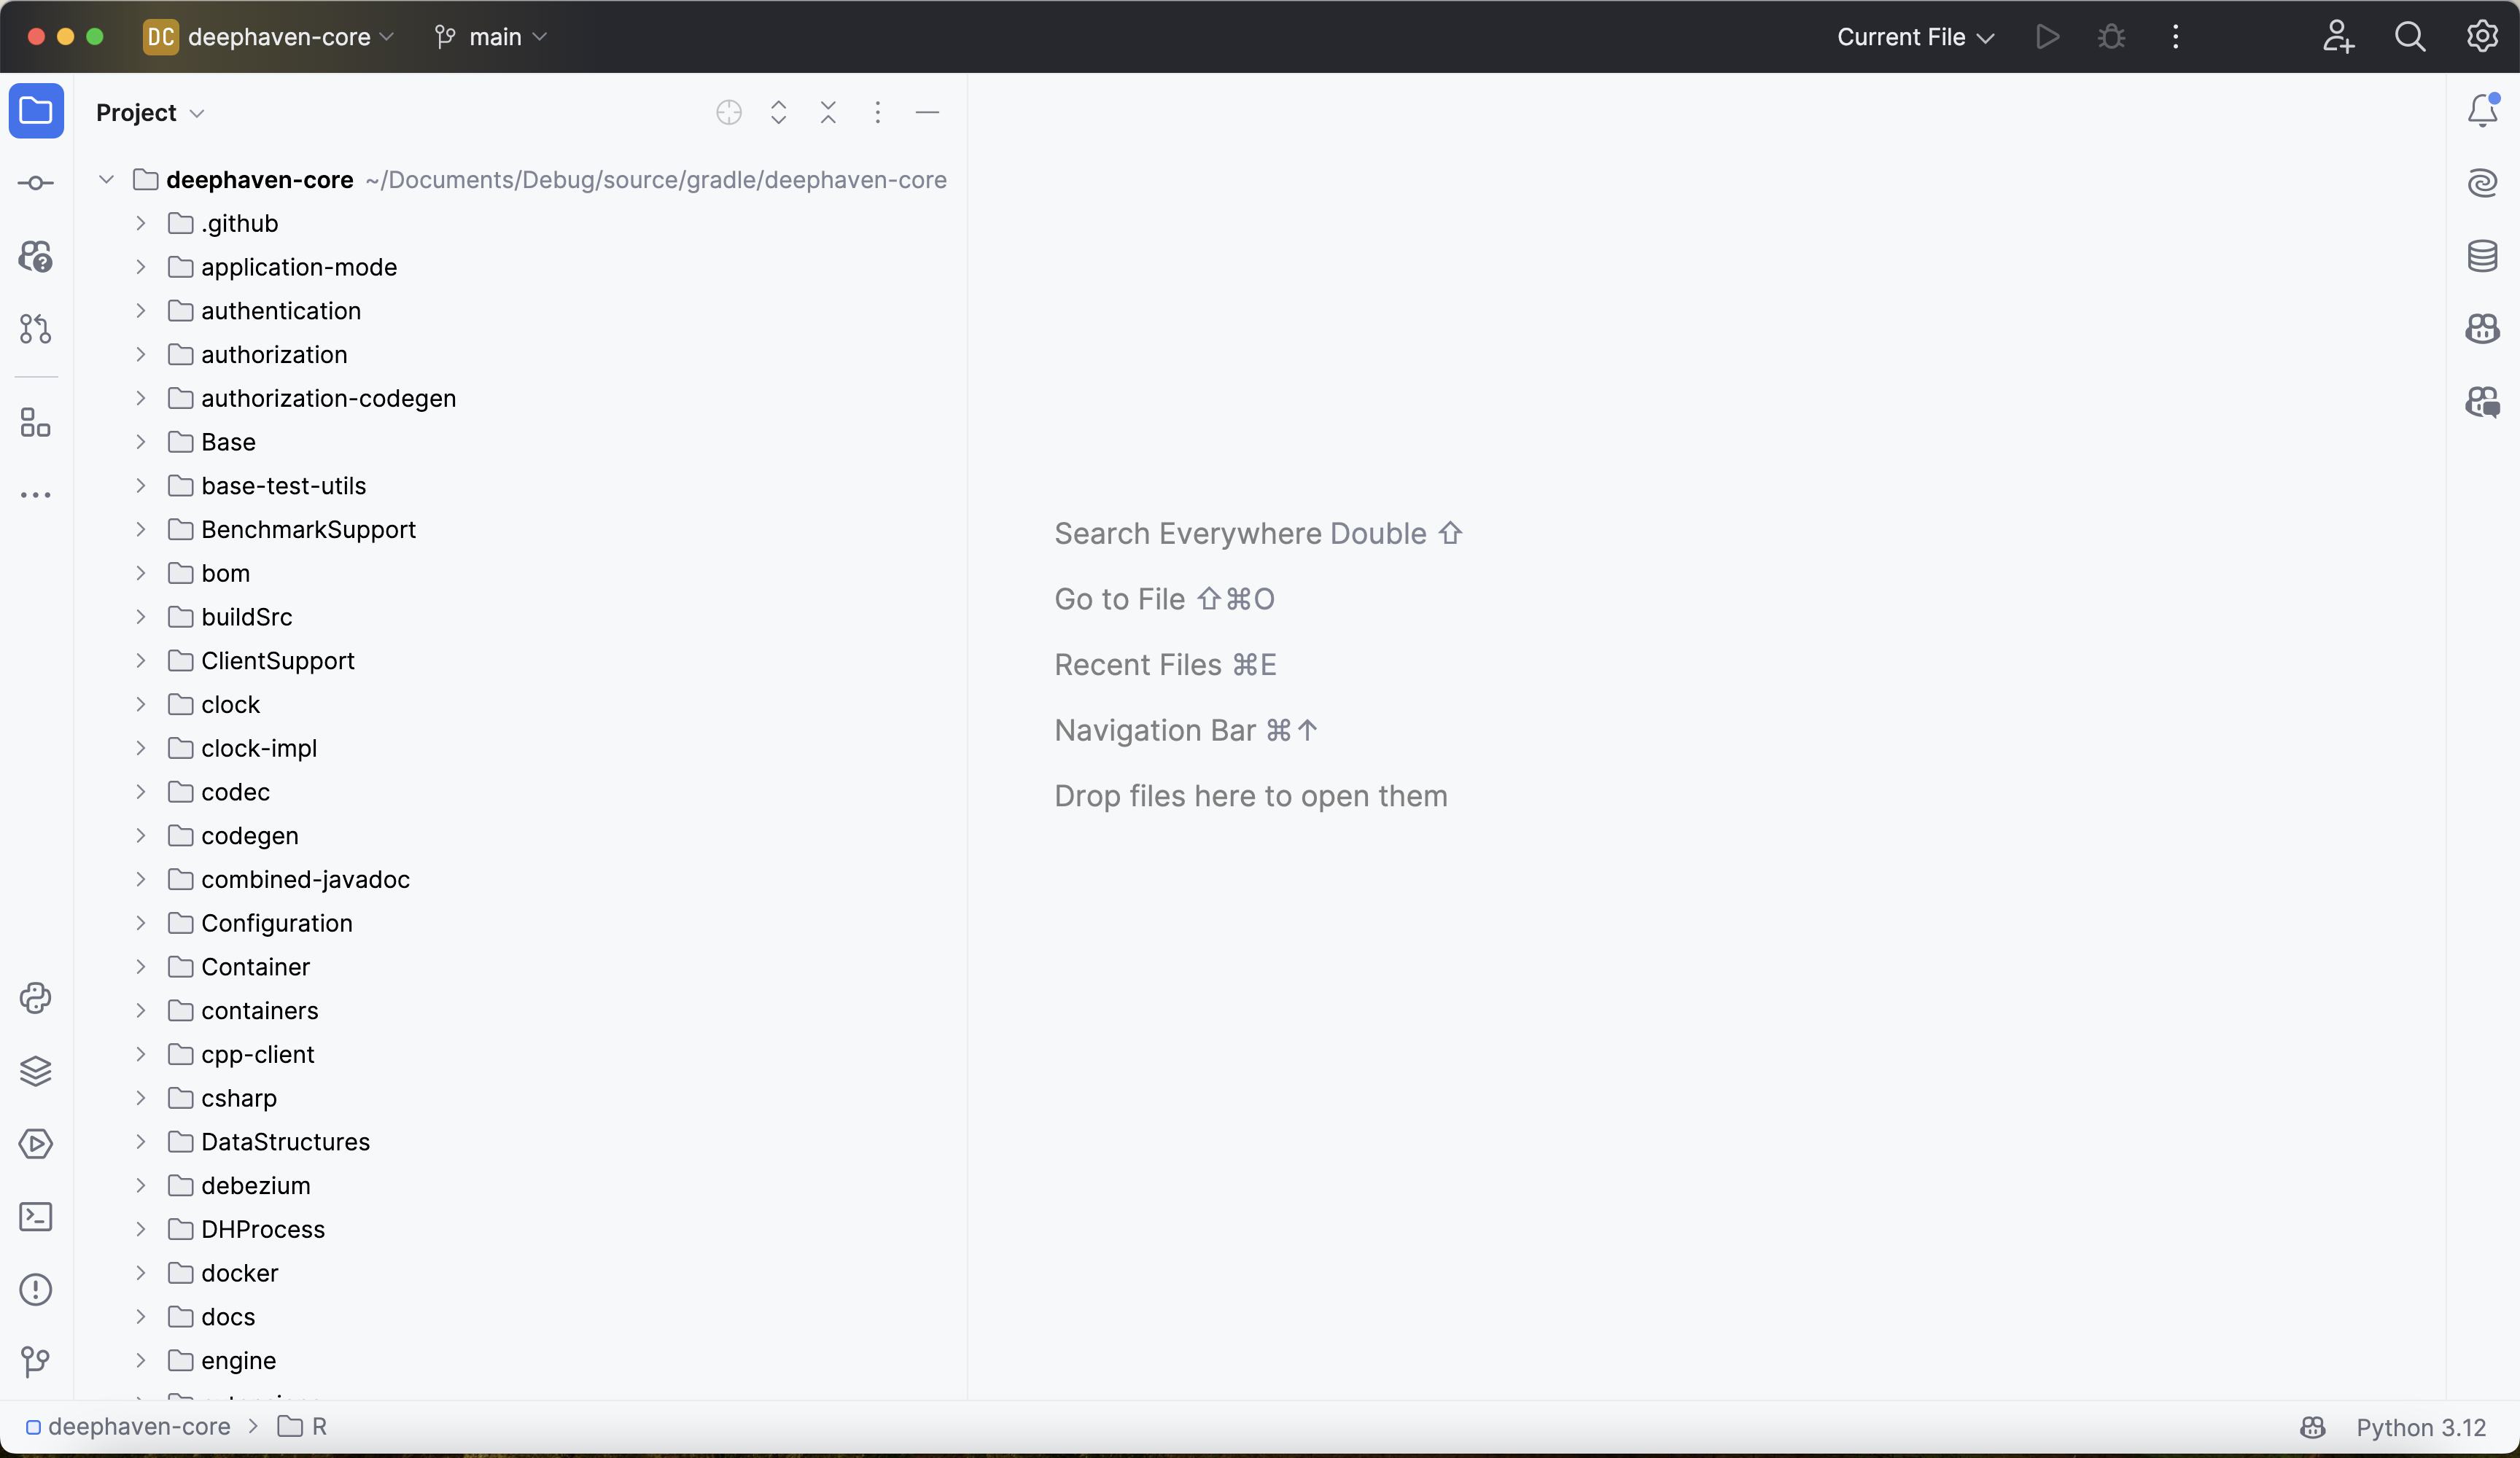
To debug Deephaven from PyCharm, create a PyCharm project from the same deephaven-core clone that you used to build and run the server.
From PyCharm's launch window, click Open and navigate to the deephaven-core directory. The new project should look like this:
Set the project interpreter to the virtual environment you created when building Deephaven from source (source-dh-venv). Open PyCharm's settings. On macOS, go to PyCharm > Settings. On Windows and Linux, go to File > Settings. Then select Project: deephaven-core > Python Interpreter and check that the selected path is the path of source-dh-venv:
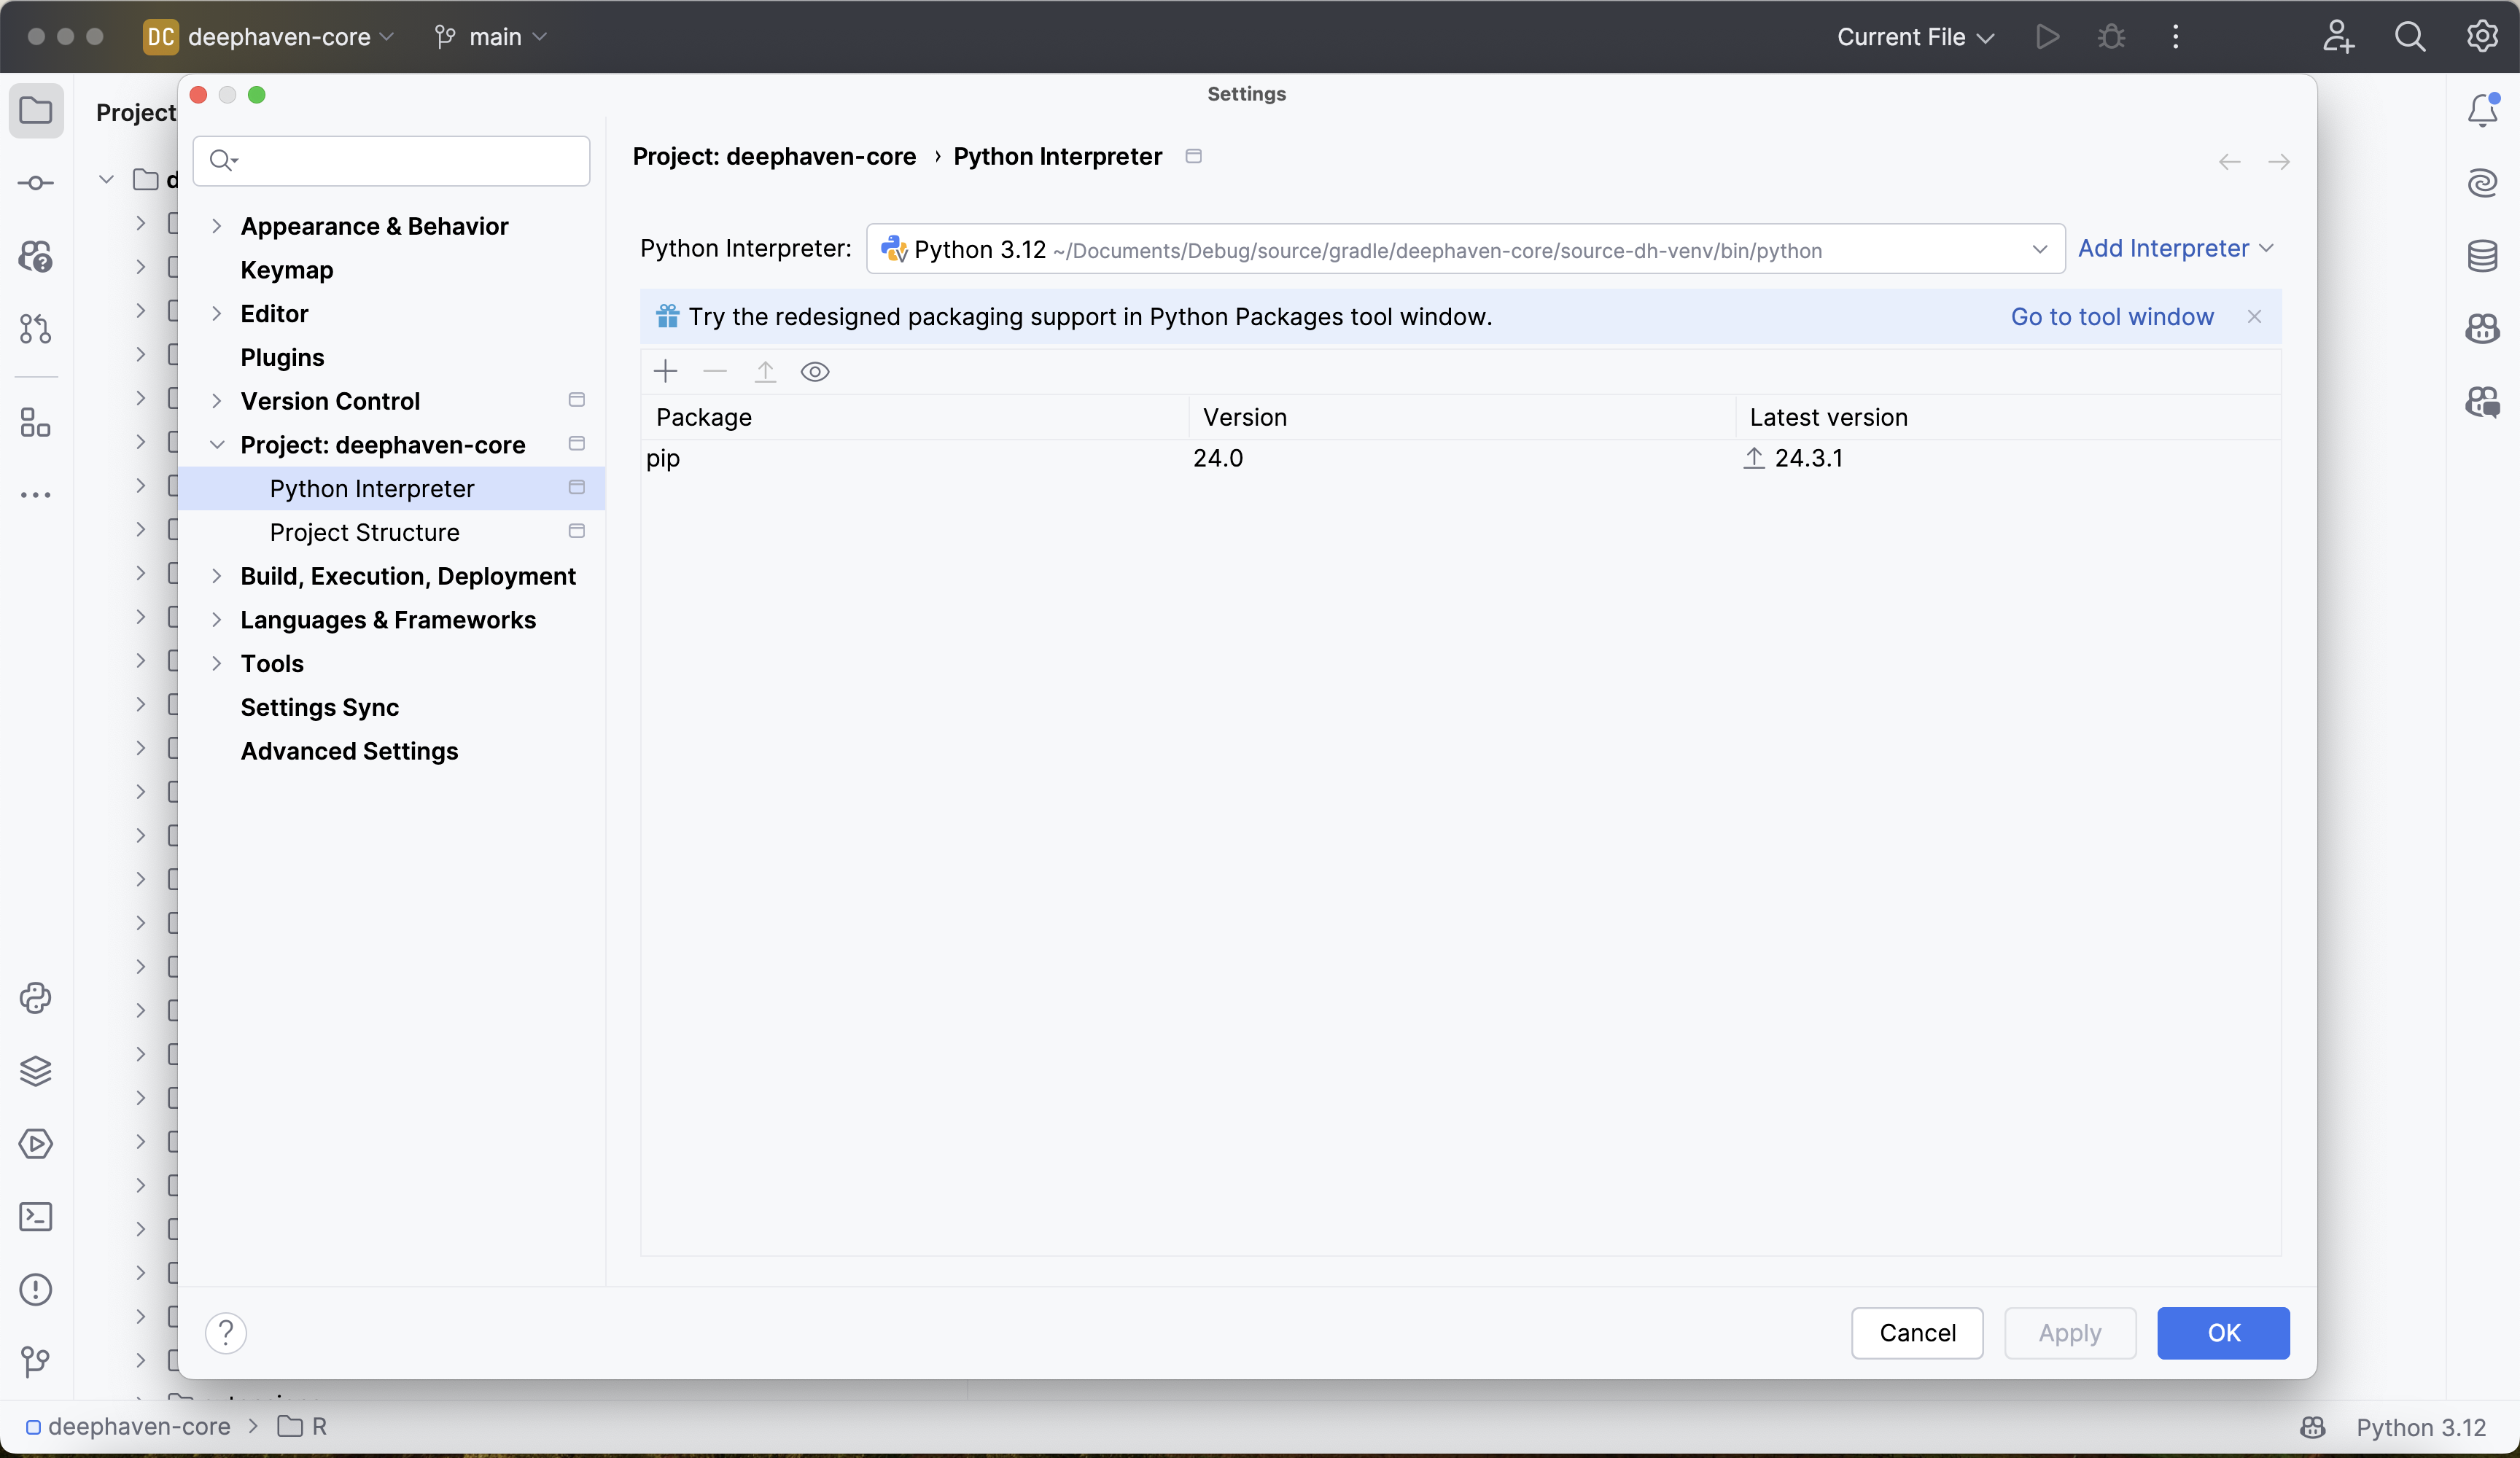
If the selected path isn't source-dh-venv, click Add Interpreter > Add Local Interpreter, choose Existing, and select the python executable in source-dh-venv/bin. The build guide creates the virtual environment in your home directory, outside the clone, so PyCharm might not select it on its own.
3. Configure the debugger
Next, create a remote debugging server from PyCharm.
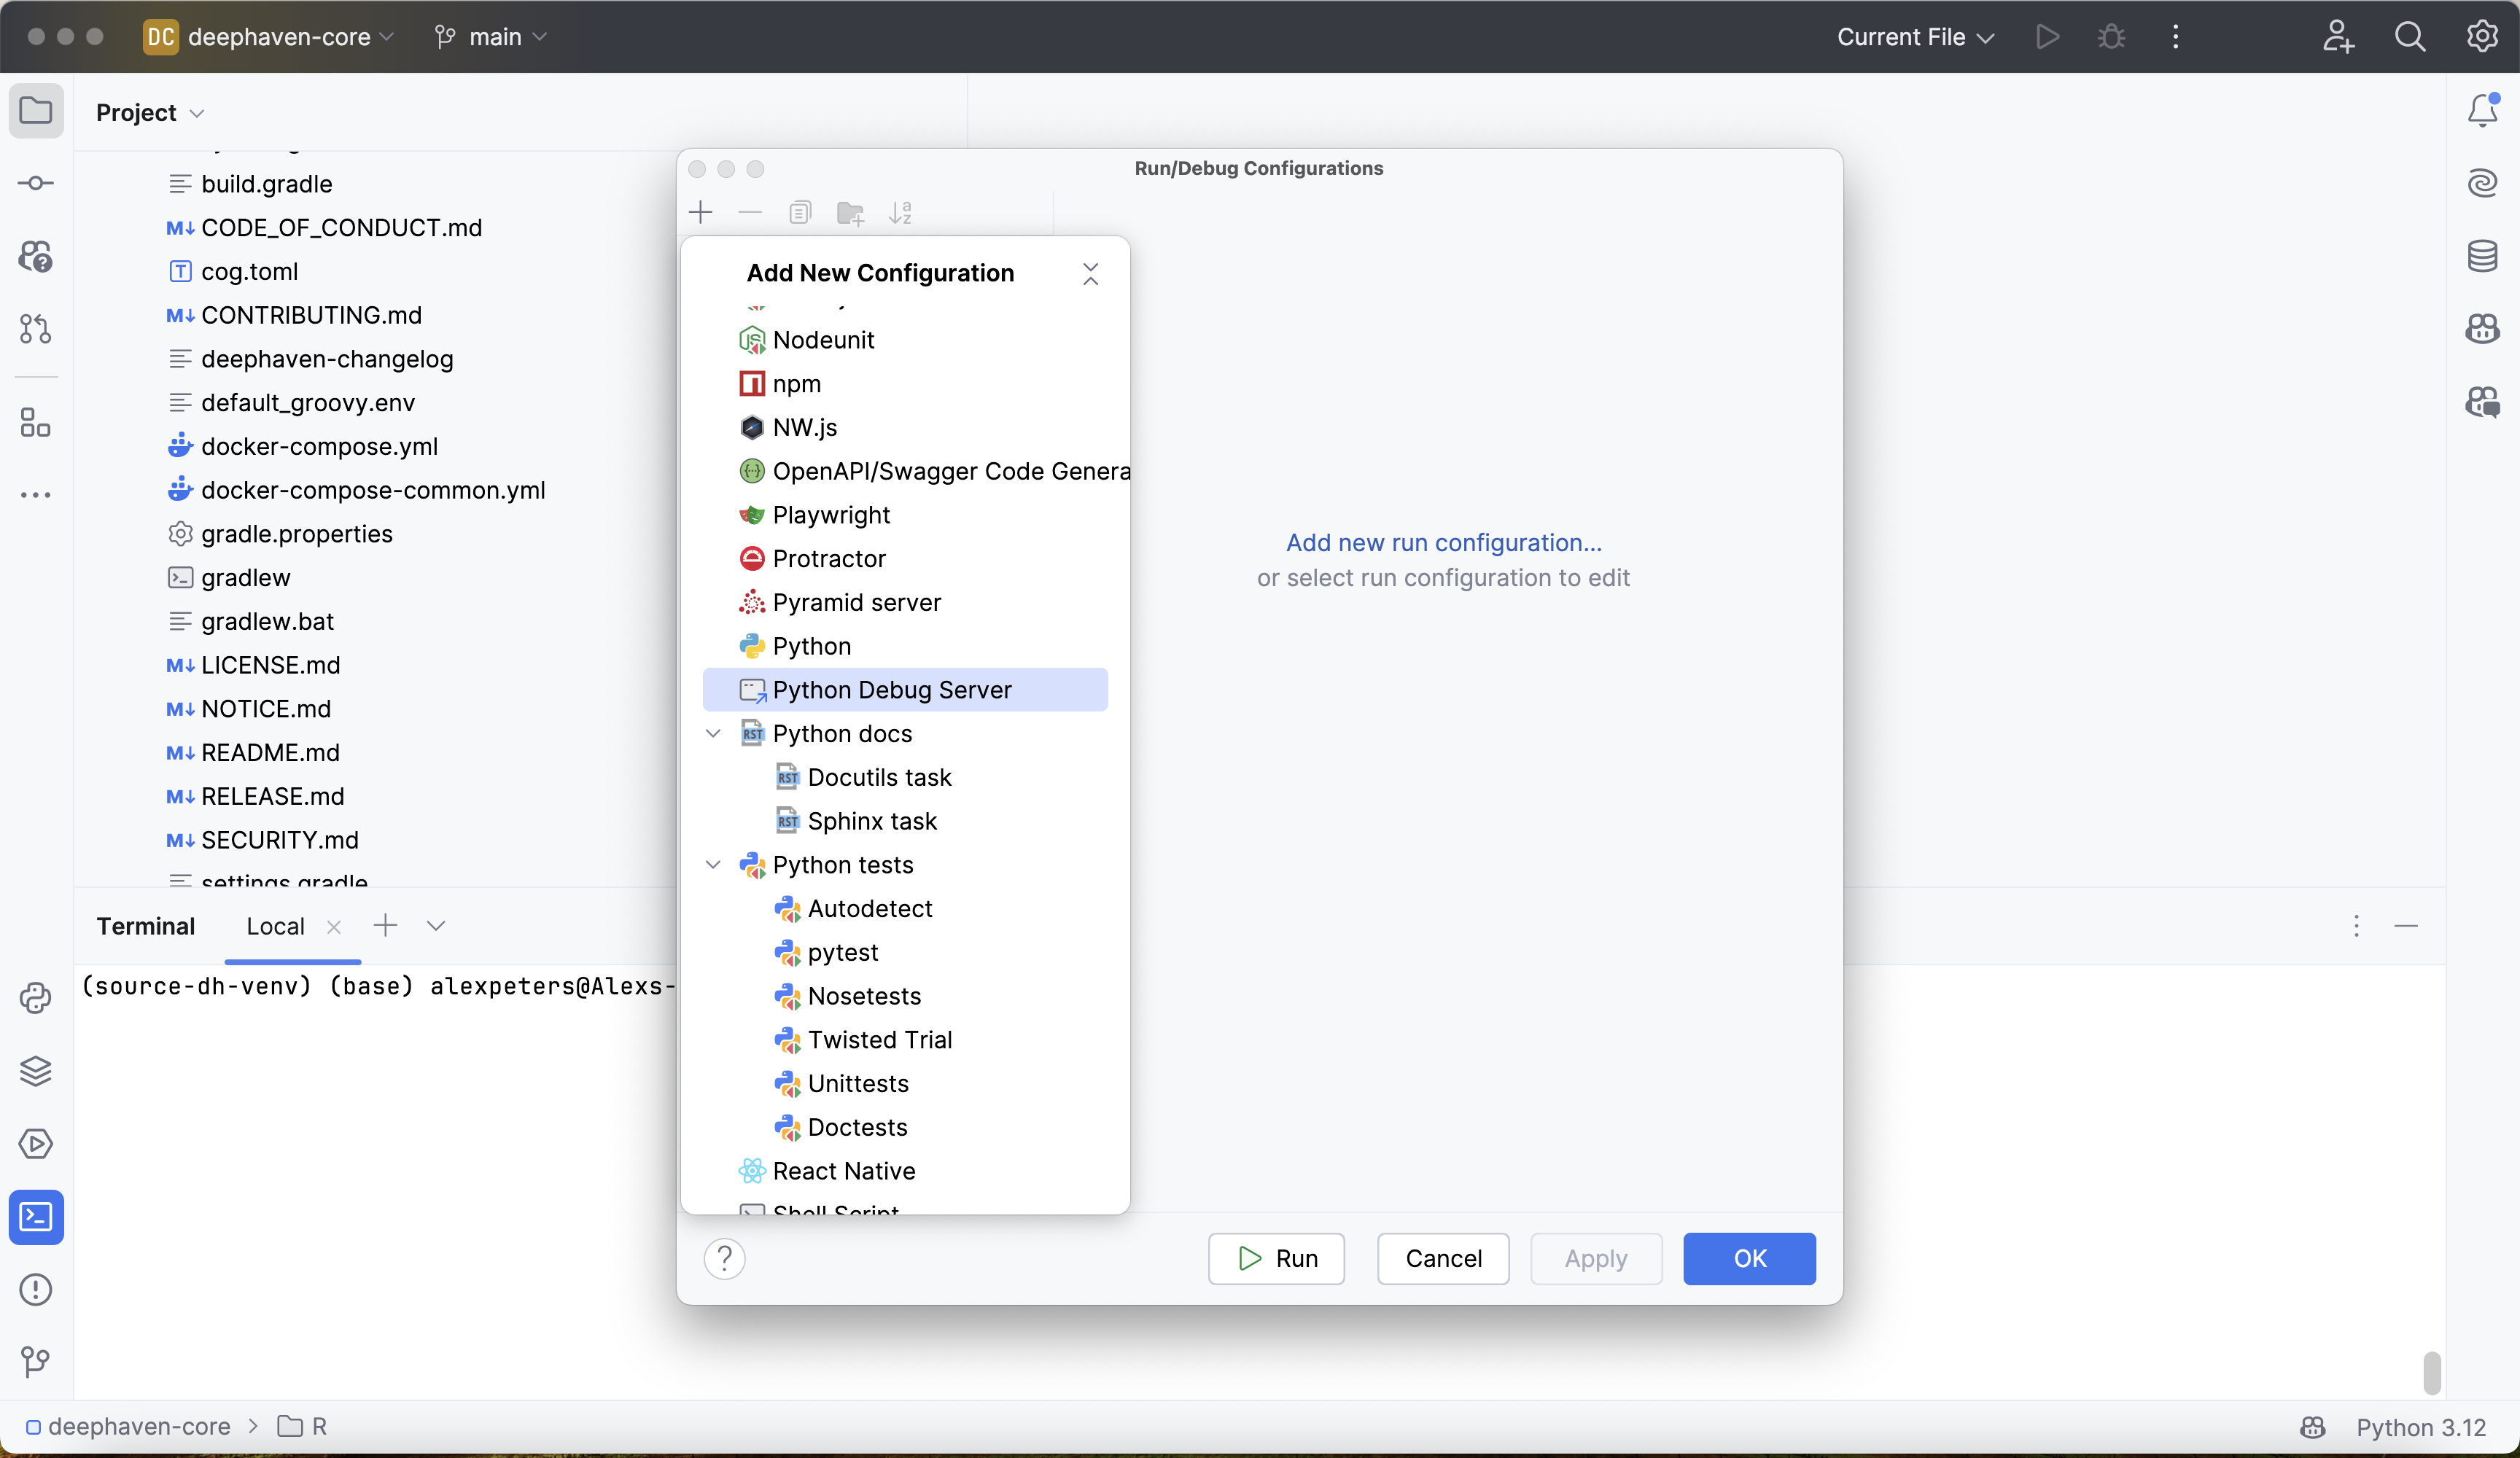
Go to Run > Edit Configurations to open the Run/Debug Configurations window. Click + in the top-left corner to add a new configuration. PyCharm shows a list of configuration types. Scroll down and select the Python Debug Server configuration option:
Give the configuration a reasonable, memorable name. The virtual environment is named source-dh-venv, so this guide names the configuration source-dh-venv-debugging-server.
Next, set IDE host name. The Deephaven server runs locally, so set it to localhost.
Finally, choose a port for the debug server to run on. This port is not the same as the port the Deephaven server runs on, which is 10000 by default. Any unused port works. This guide uses port 4444.
The dialog also shows instructions to install pydevd-pycharm and call pydevd_pycharm.settrace. This guide uses the generic pydevd package from step 1 instead, so you can skip those instructions. If pydevd doesn't work with your PyCharm version, see Version compatibility issues.
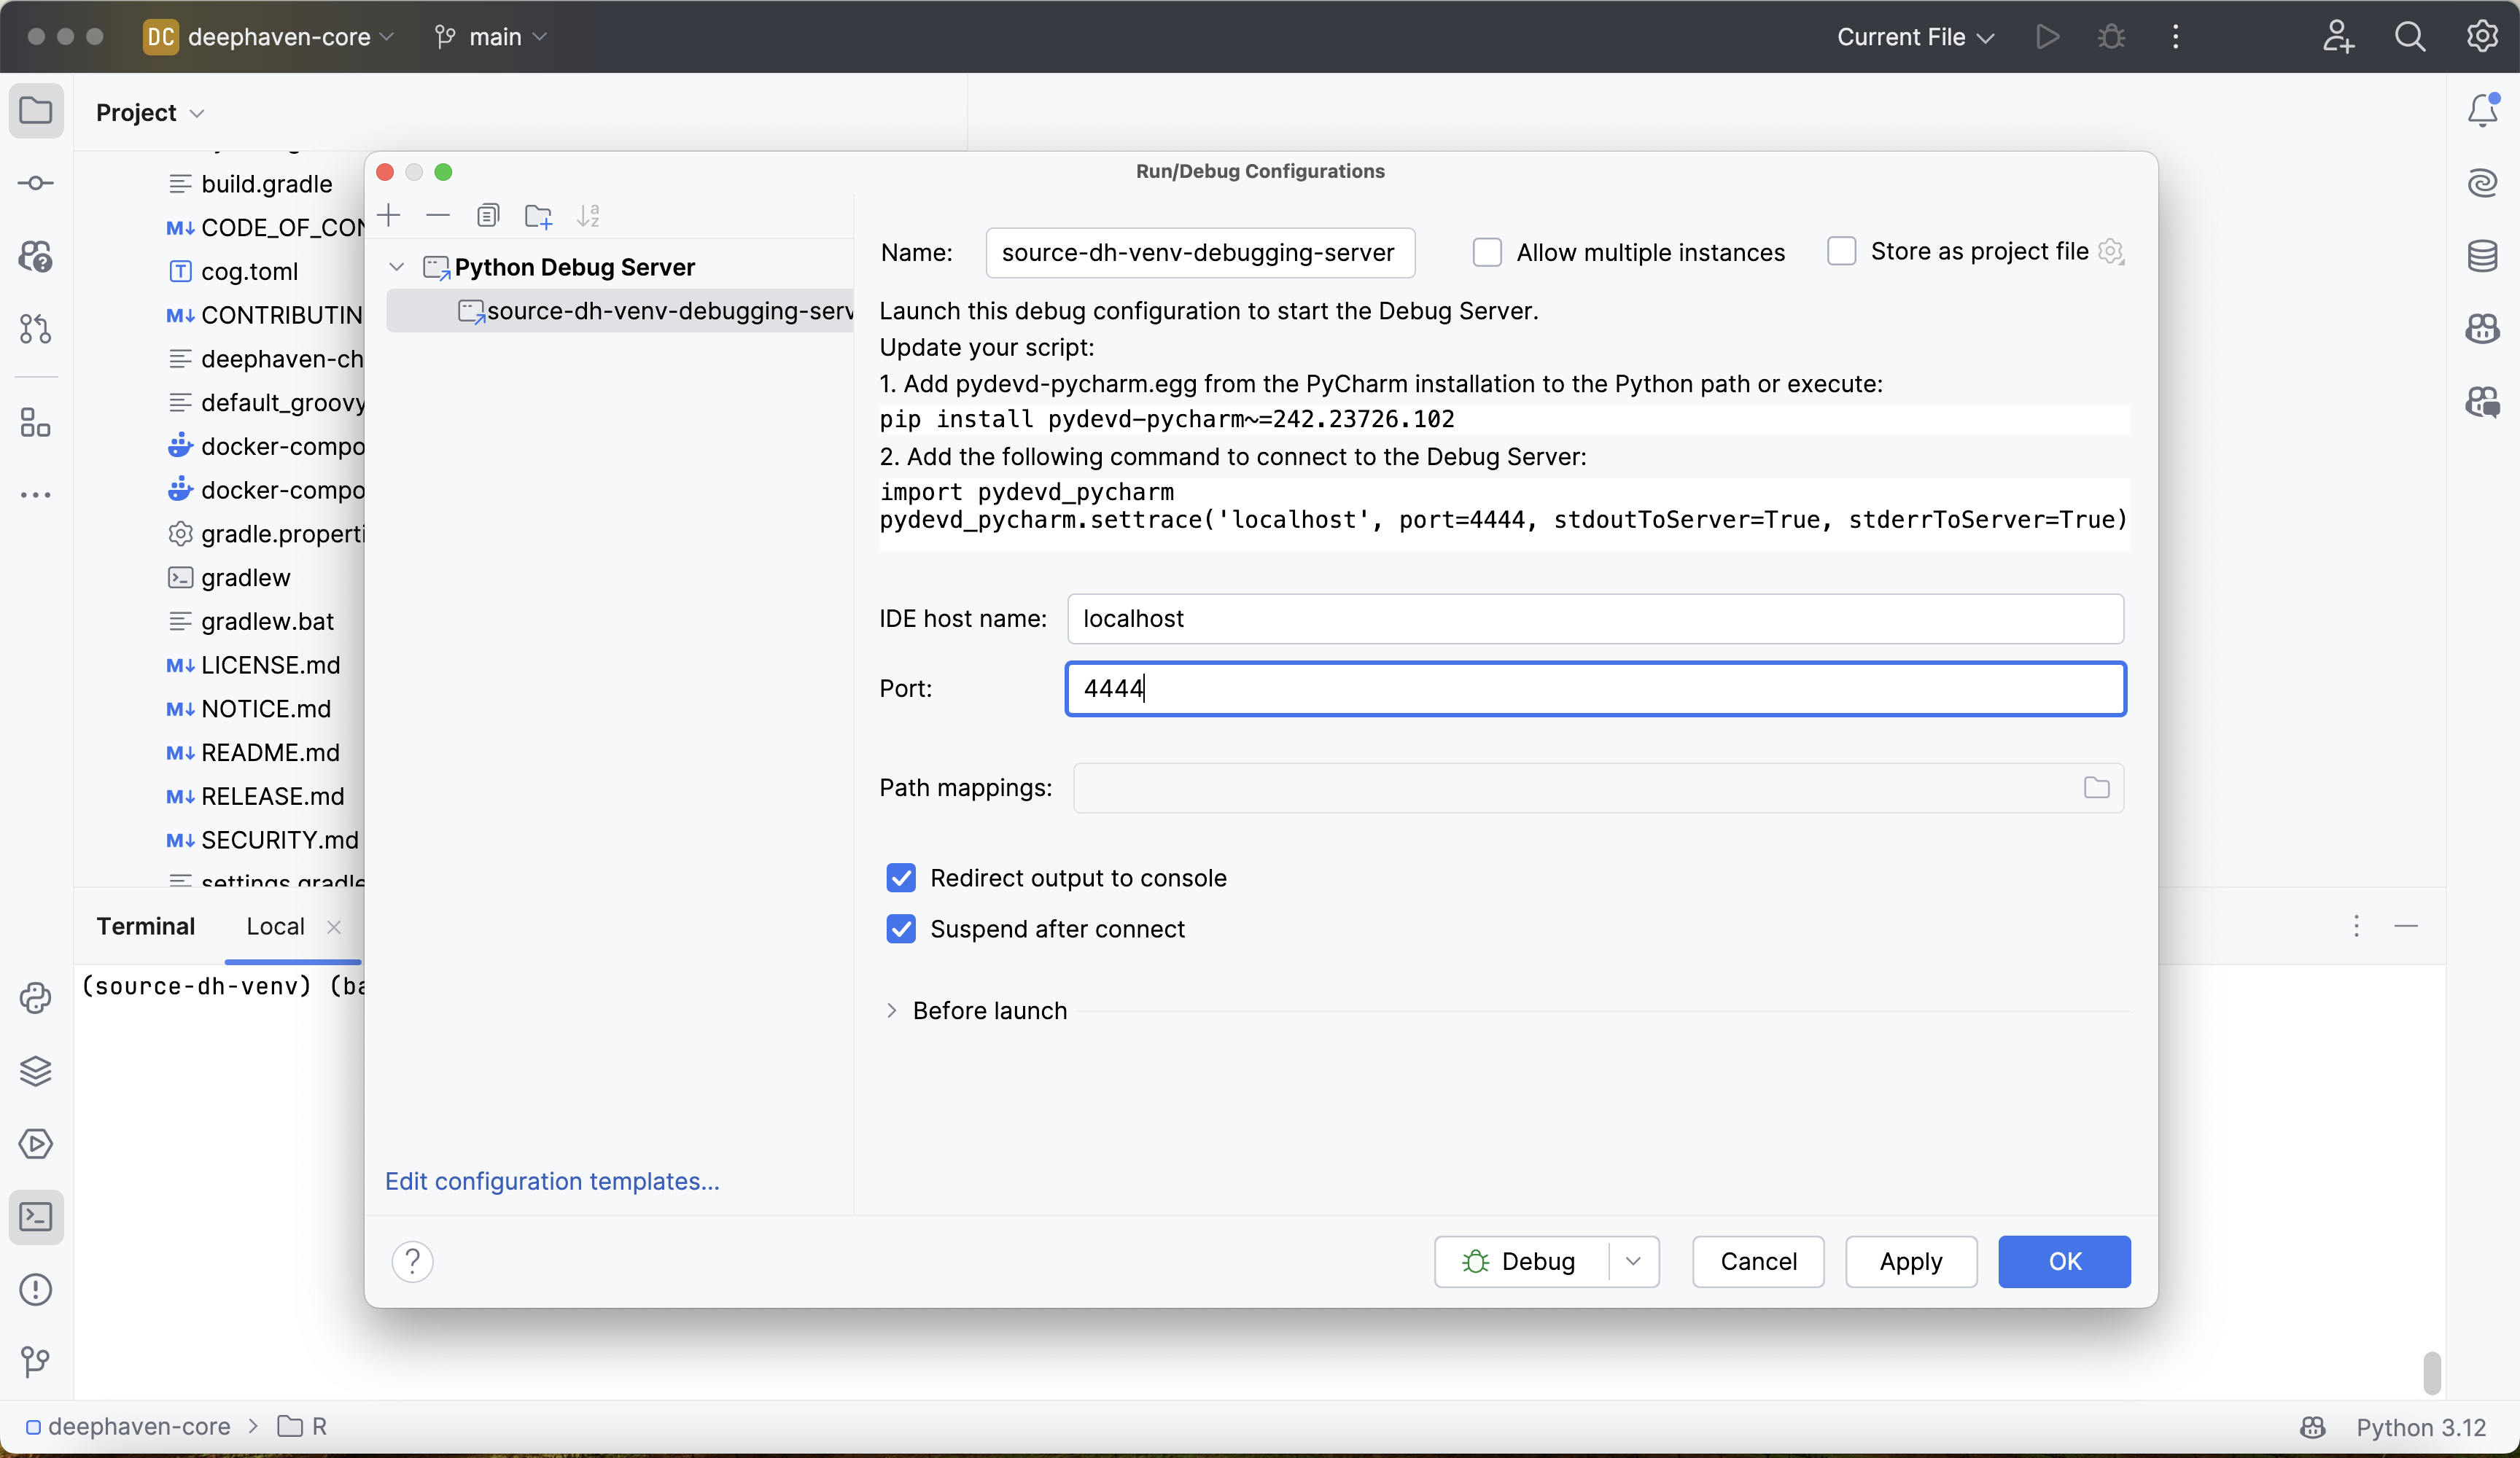
Click Apply and OK to save the configuration.
4. Attach the debugger to Deephaven
Start the debugger in PyCharm by clicking the small green bug icon in the window's top-right corner. This starts the debugger and opens a debugging console:
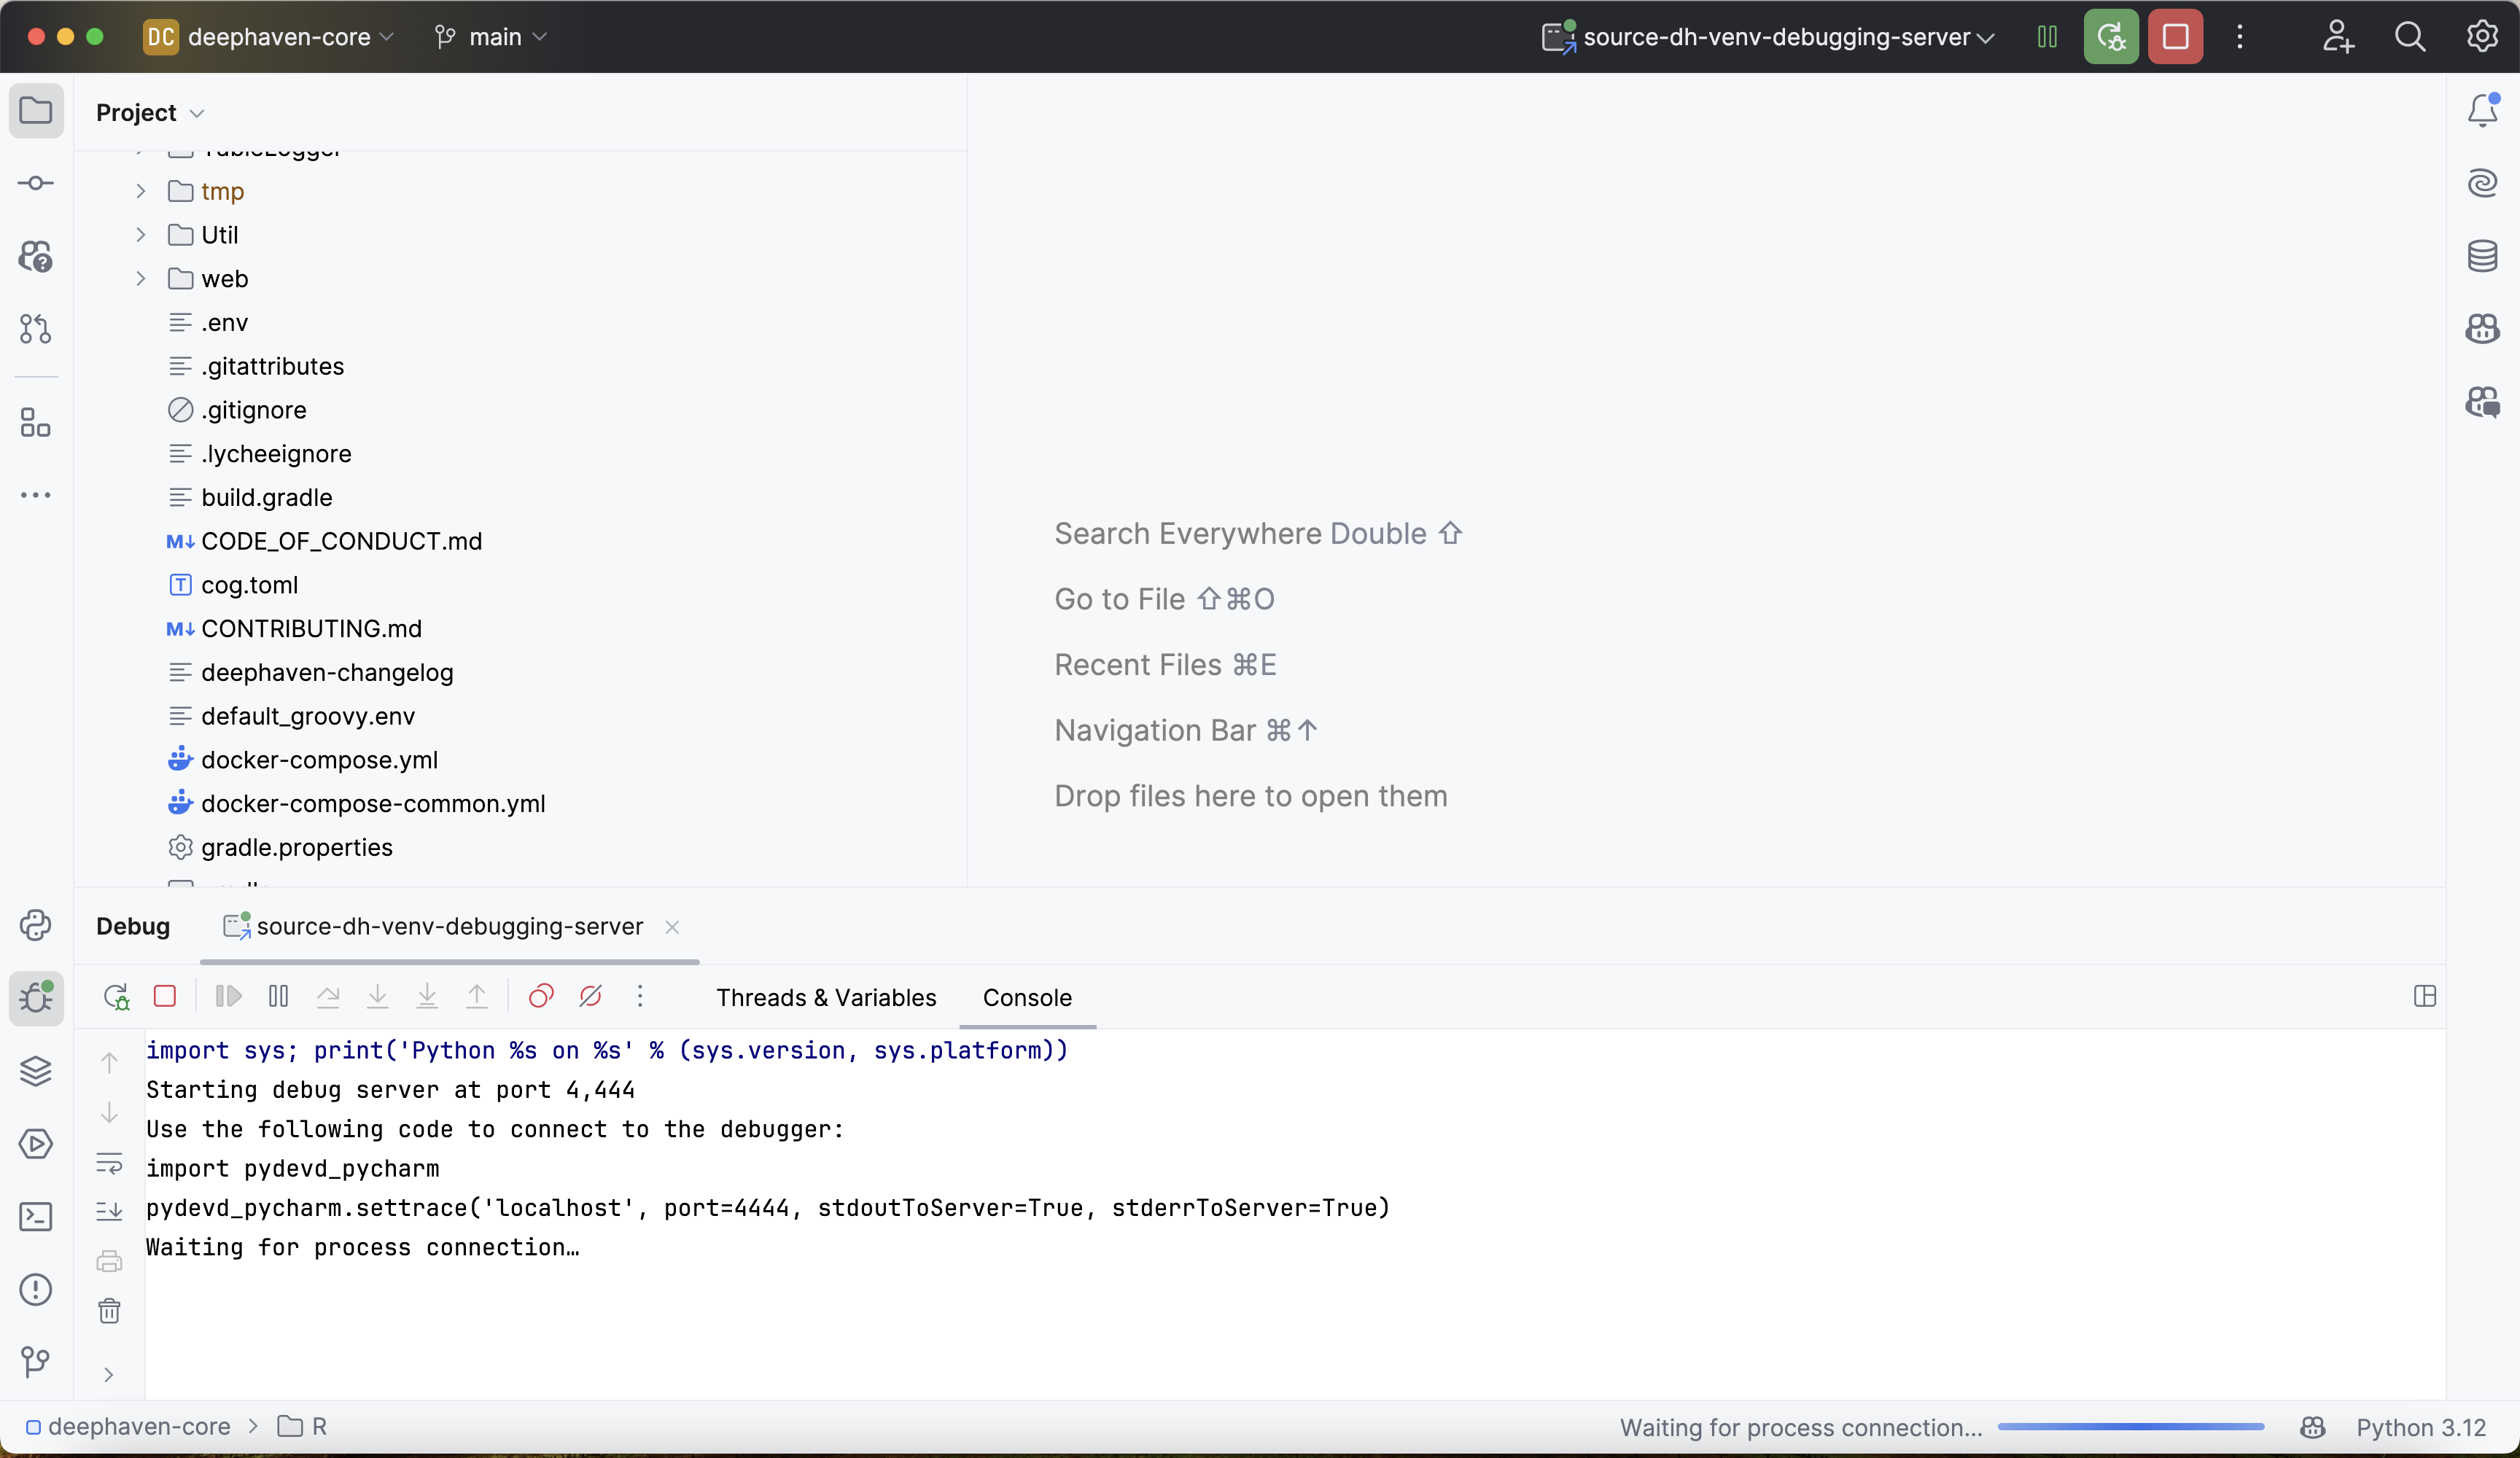
The output above states that the debugger is "waiting for process connection". This means that the debugger is not yet attached to the Deephaven process.
Now start the Deephaven server from a shell where source-dh-venv is active. The server runs Python from the active virtual environment, which is where pydevd is installed. A new terminal in this PyCharm project activates the project interpreter's environment for you. In it, run:
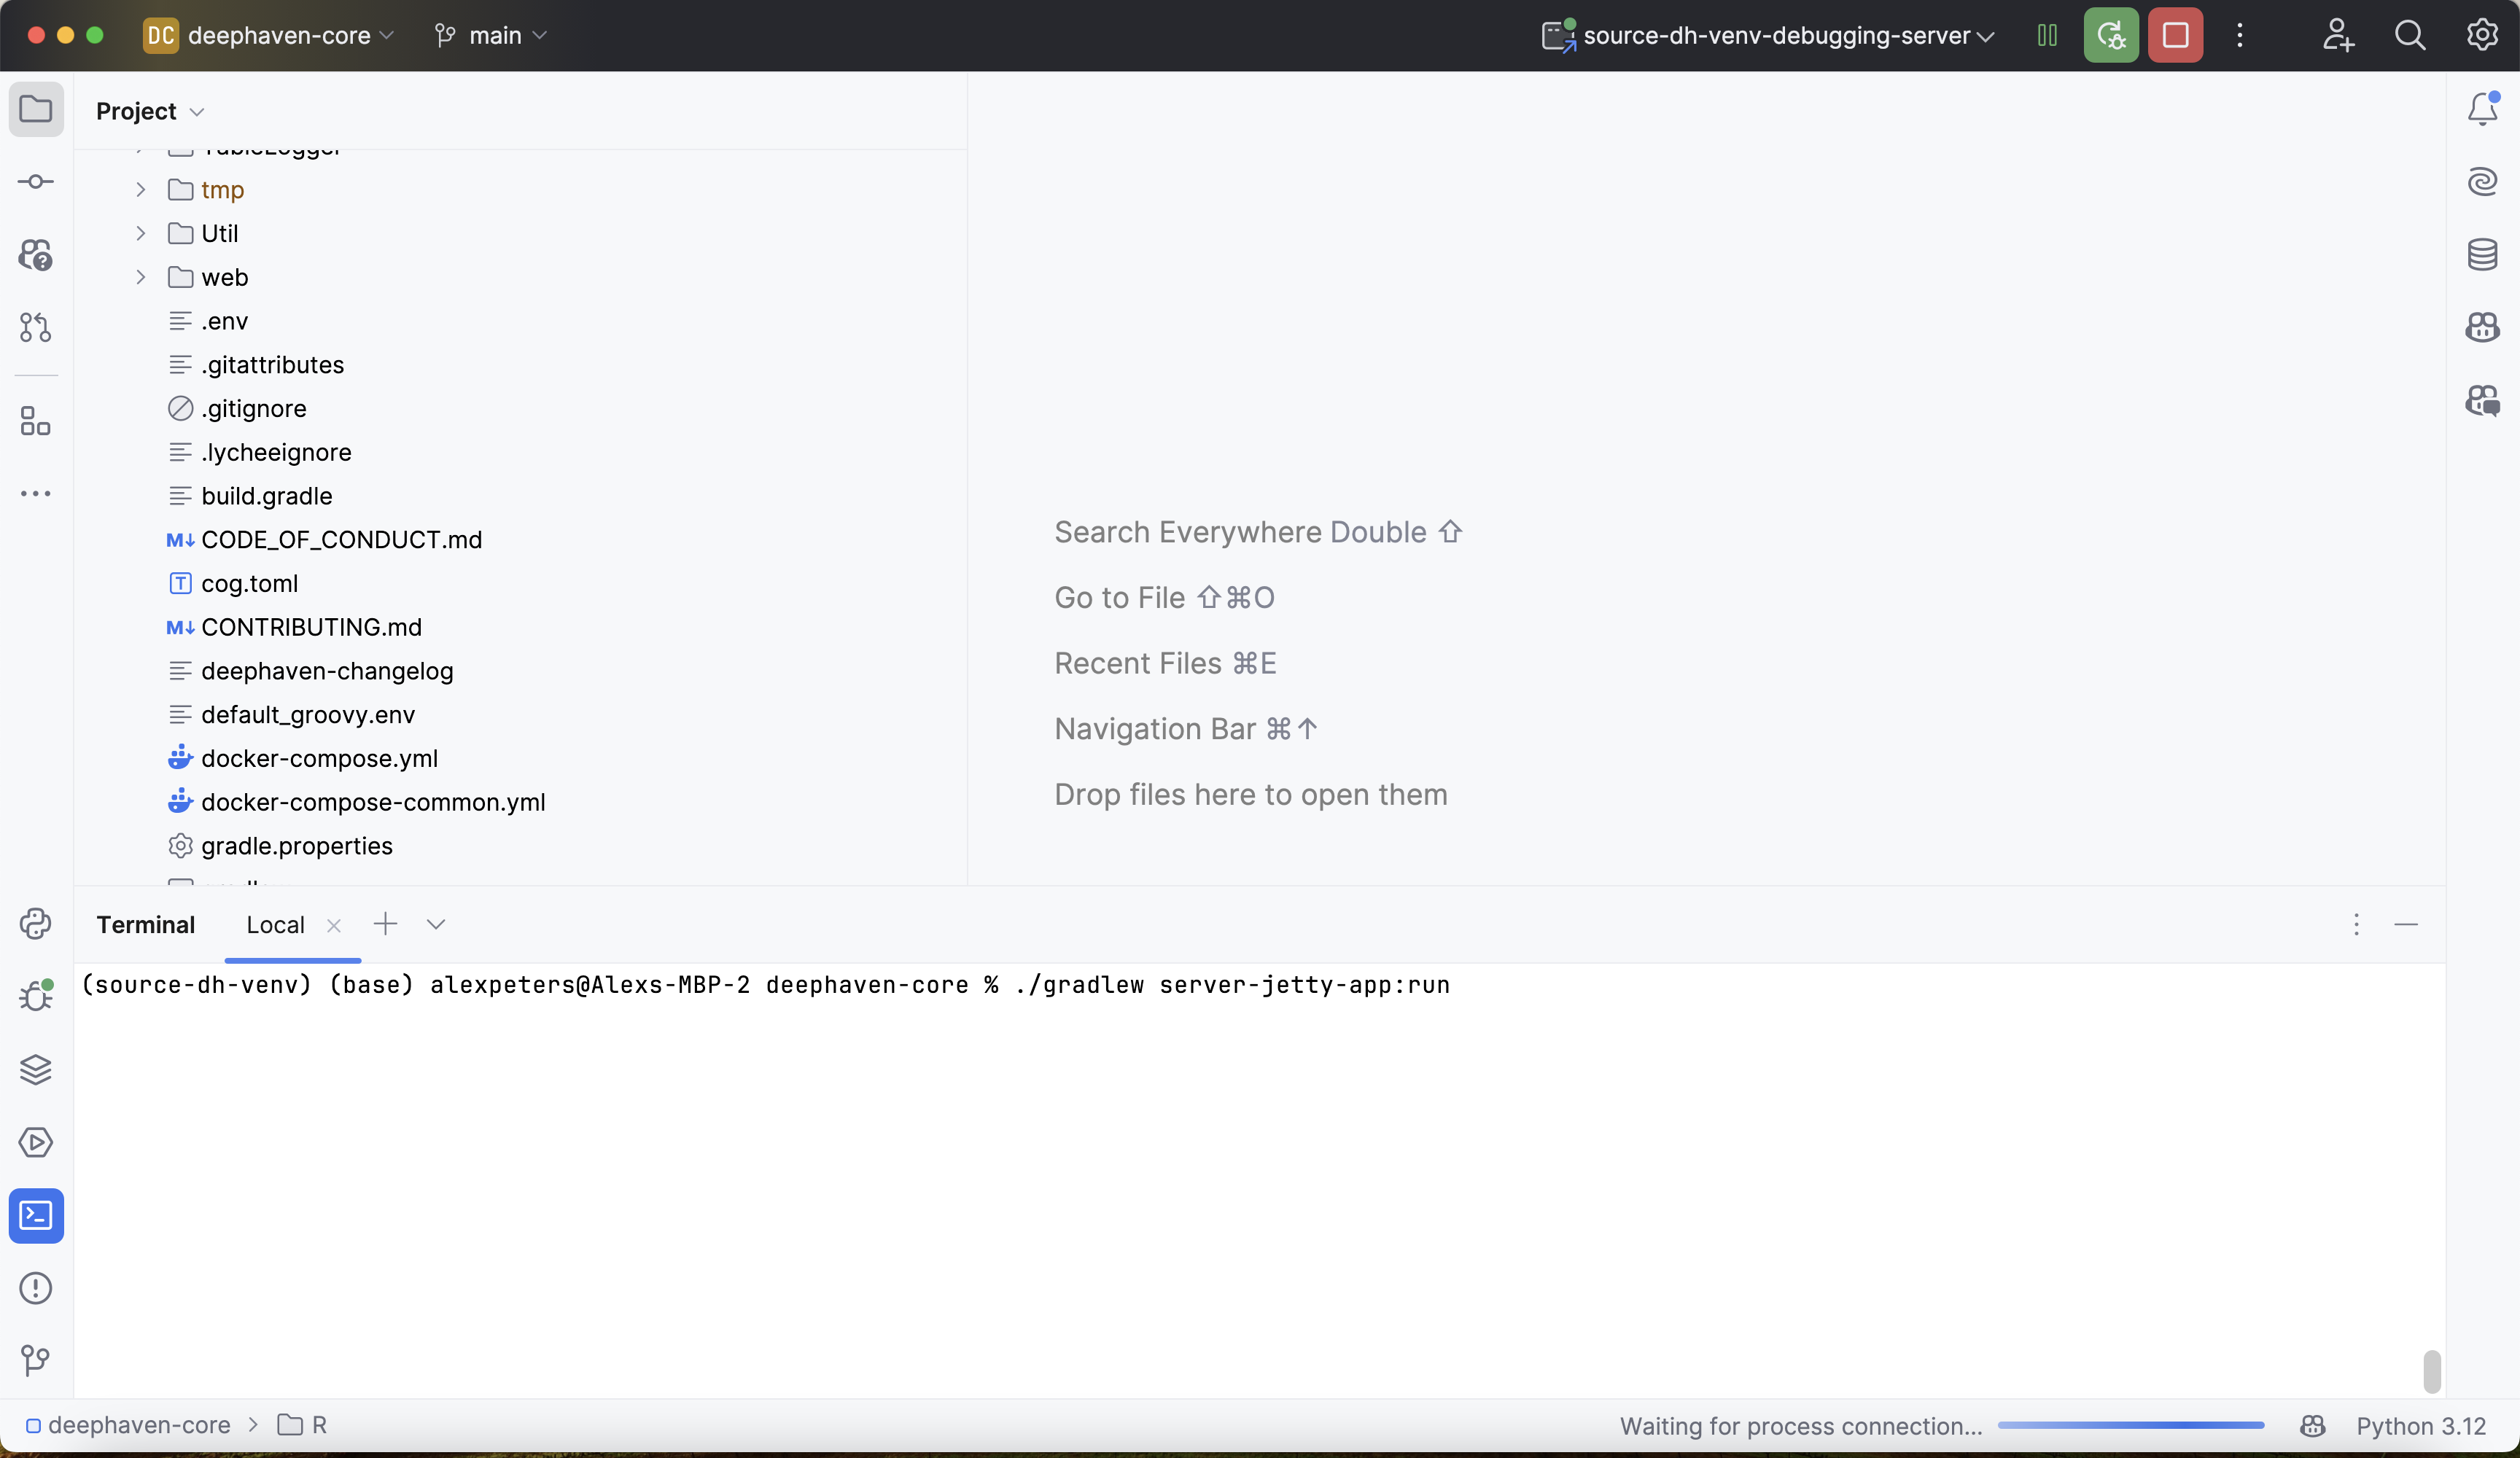
By default, the server uses pre-shared key authentication and prints the key to the server log, so enter that key when you open the Deephaven IDE. To skip the key prompt, add the -Panonymous flag to the command above. The flag enables anonymous authentication, so anyone who can reach port 10000 can use the server, and the server listens on all network interfaces. Use it only on a network you trust. The debugger works with either.
The server is ready when the log shows Server started on port 10000.
To attach the debugger, open the Deephaven IDE at http://localhost:10000/ide/ and execute the following commands in the console:
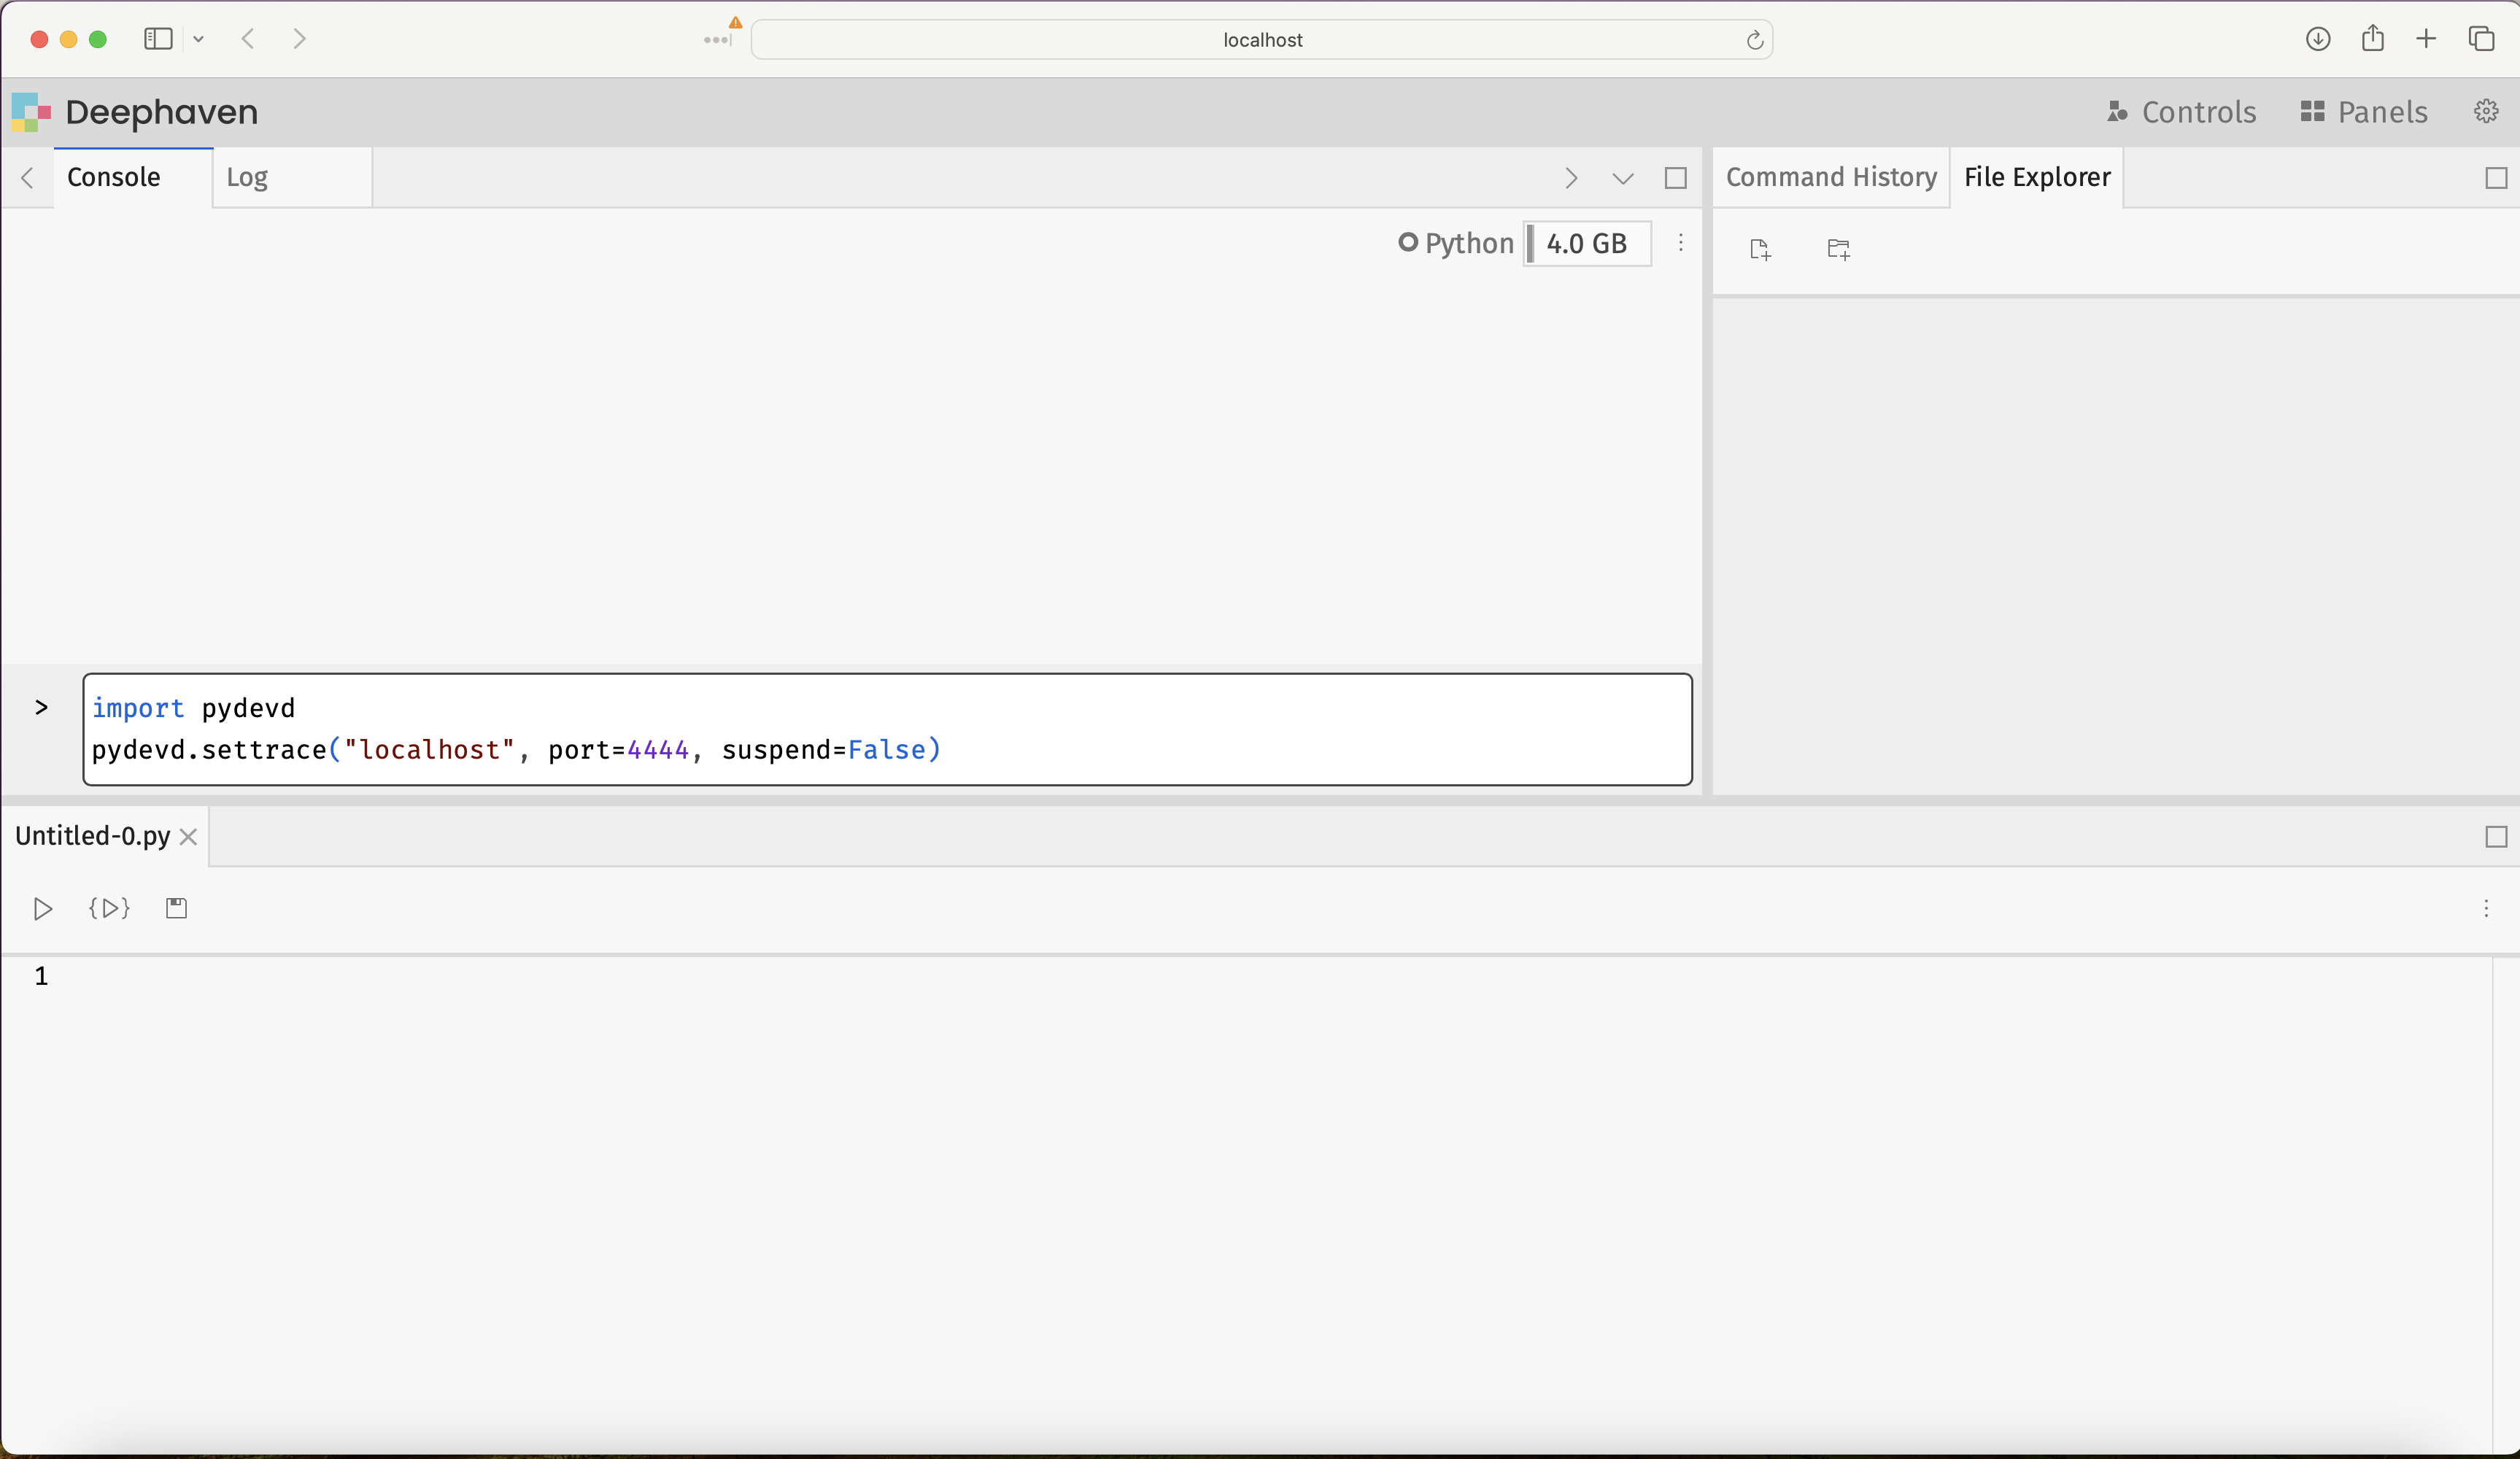
The console might print a warning from pydevd that frozen modules are in use. The warning doesn't stop debugging:
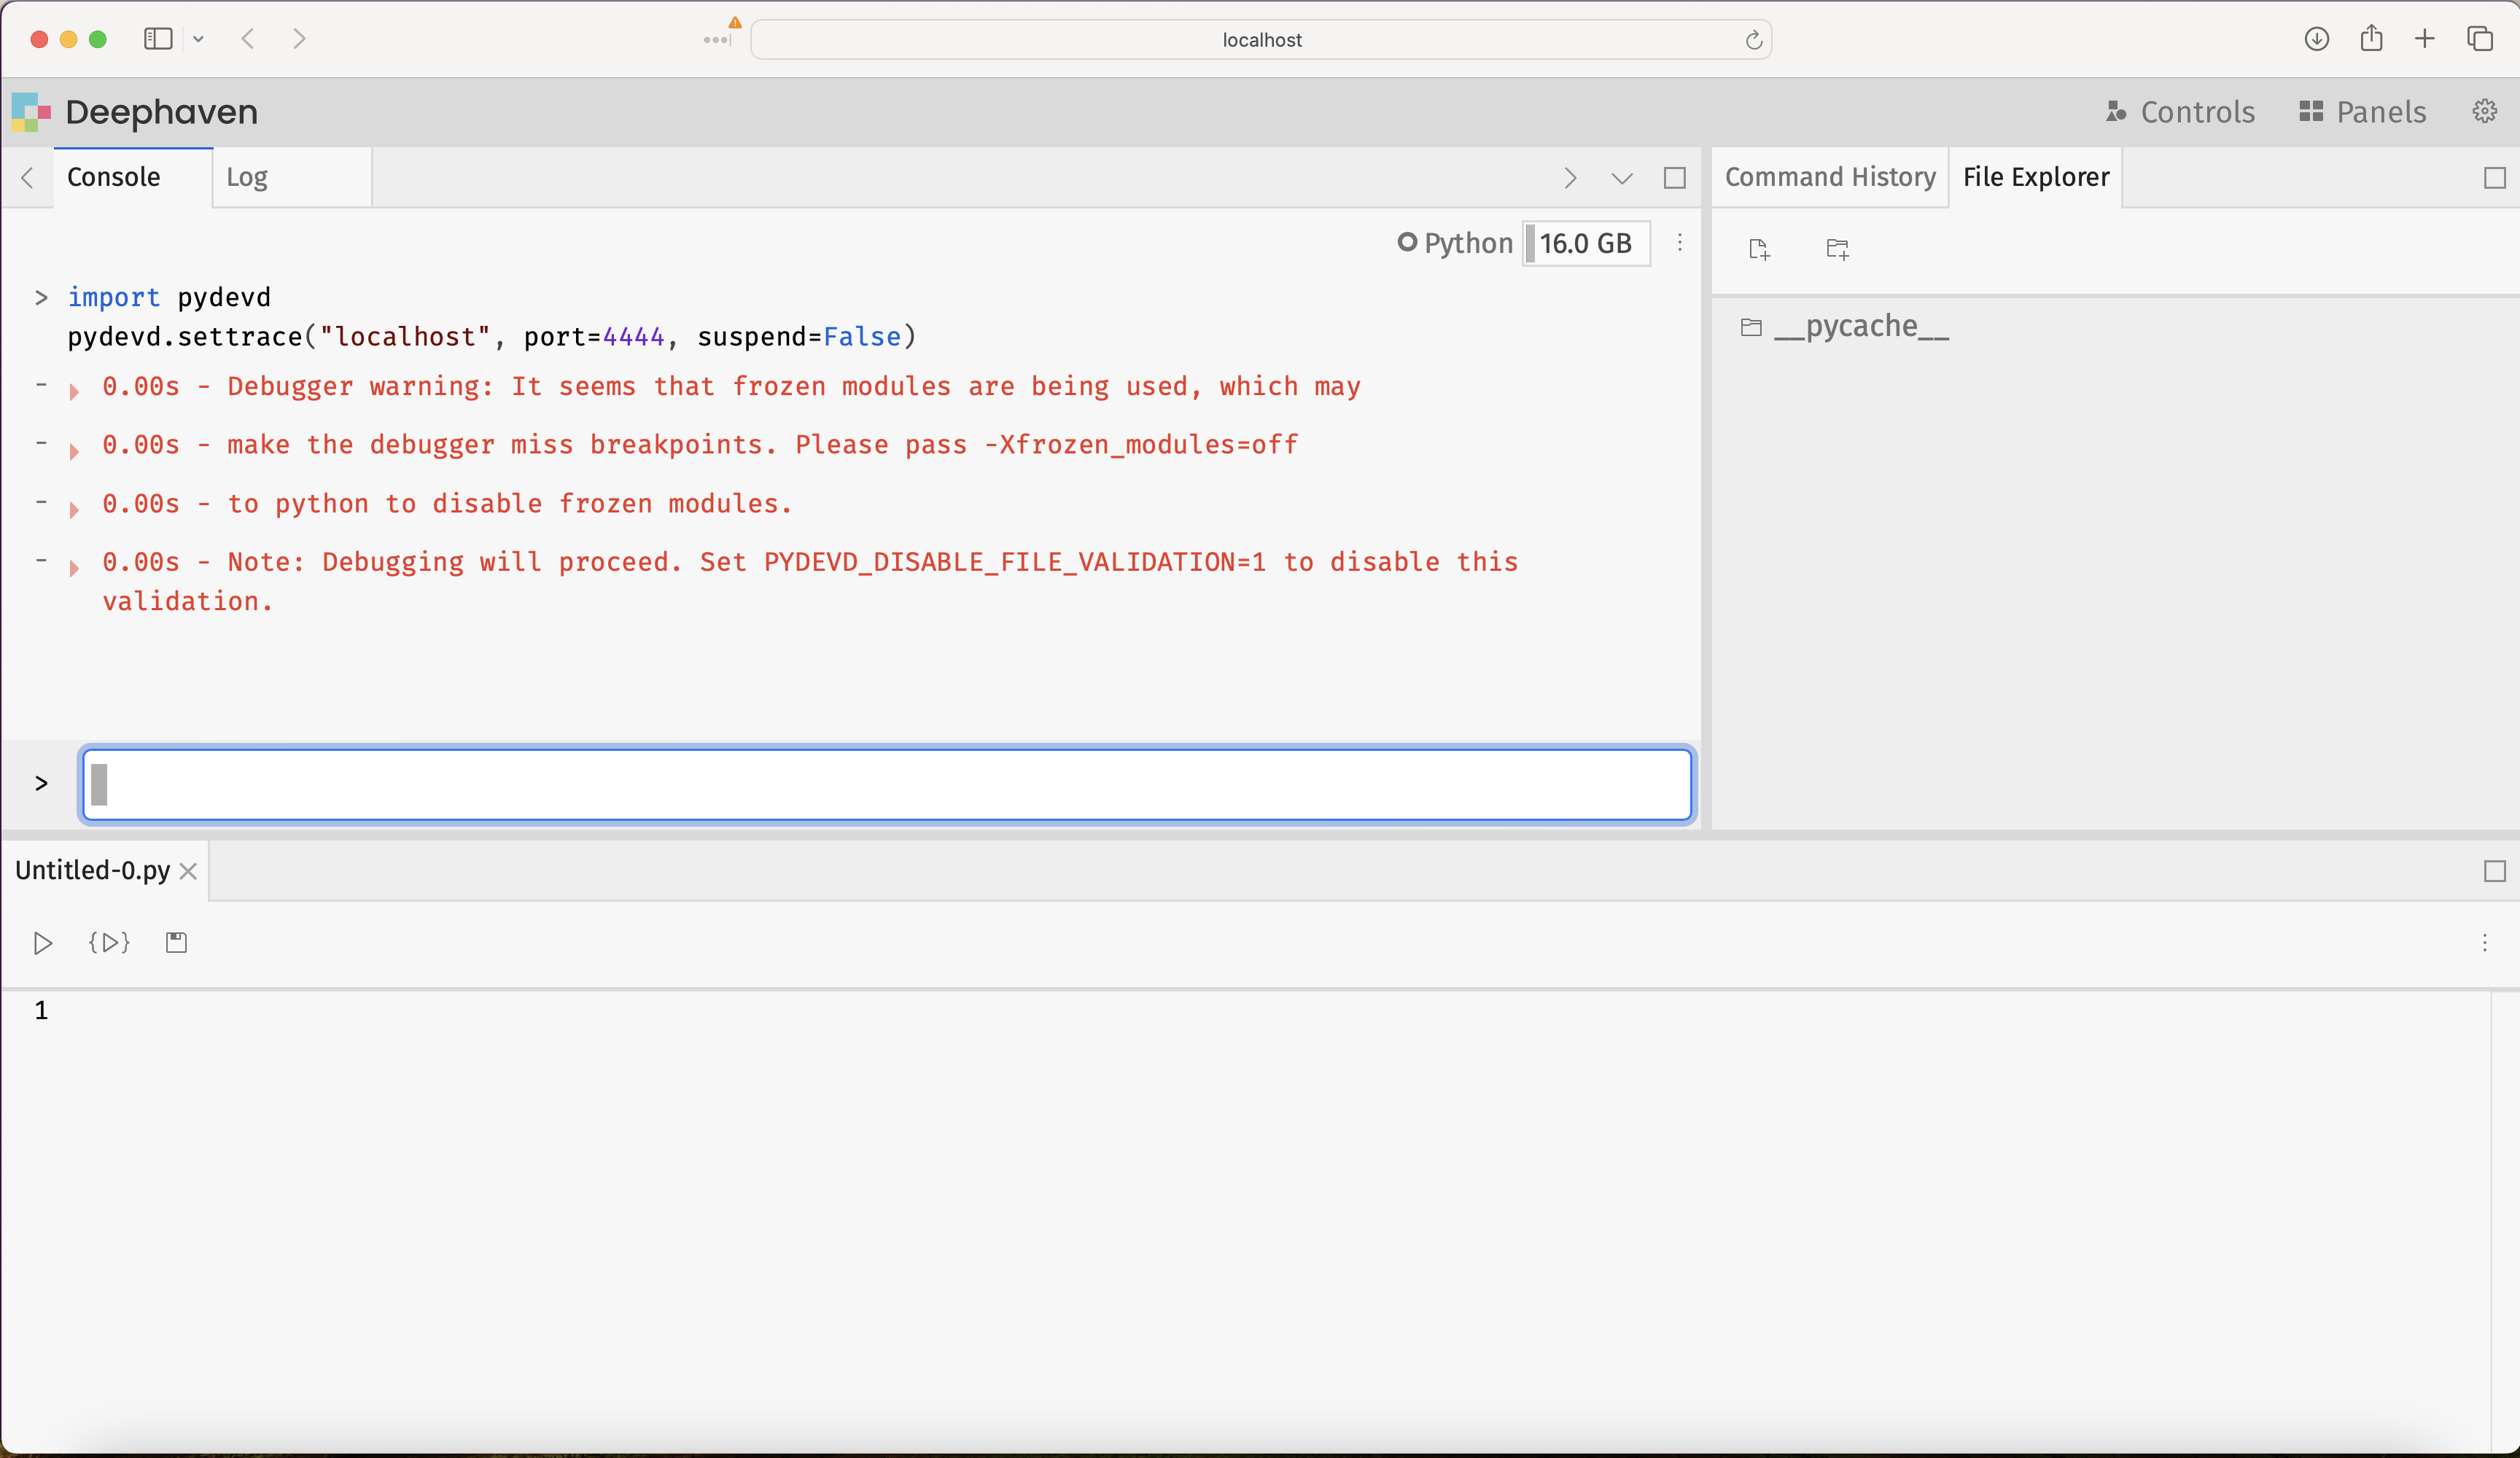
To confirm the connection, check PyCharm. Its debugging console shows a new line of output like the following. The build number matches your PyCharm build:
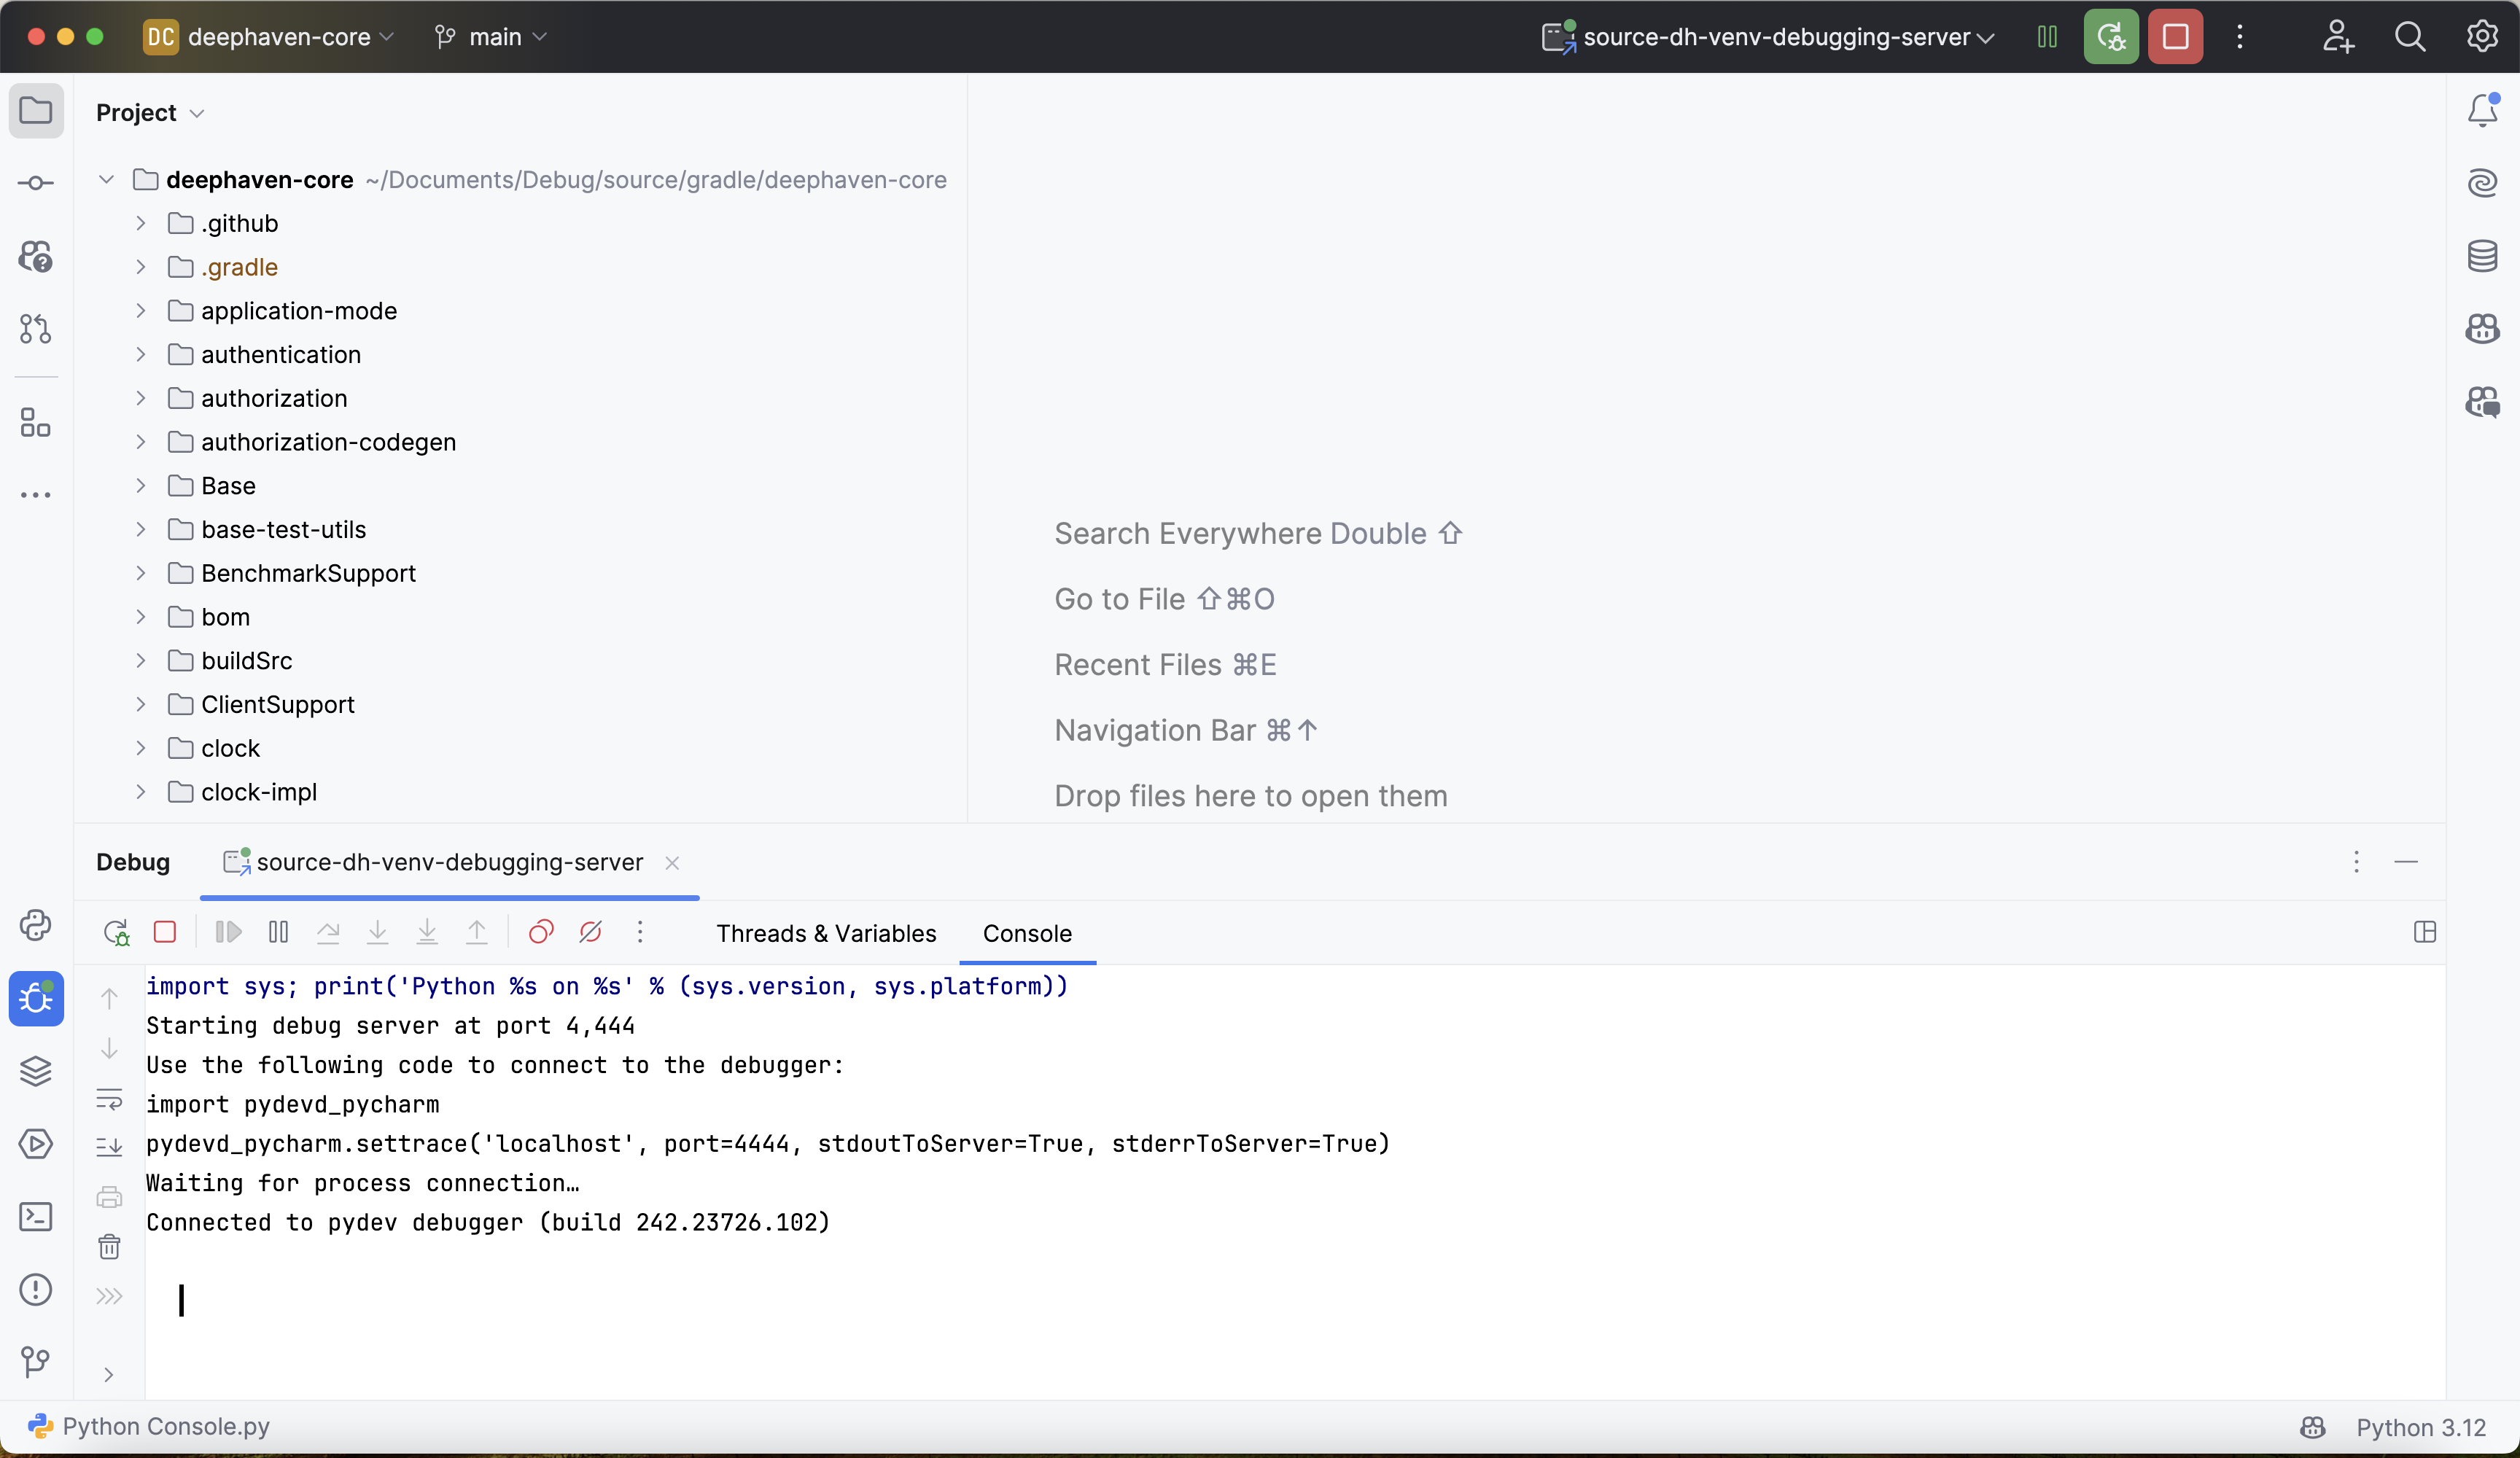
The debugger is ready.
5. Use the PyCharm debugger
Once connected, you can use the PyCharm debugger in two ways:
- Set breakpoints in PyCharm: Click in the left margin next to a line of Python to set a breakpoint. Set it in the copy of Deephaven's Python source that the server actually runs:
- Wheel install (the build guide's default): the
deephavenpackage installed insource-dh-venv. PyCharm lists it under External Libraries in the Project tool window. Breakpoints inpy/serverin the clone aren't hit. - Editable install:
py/serverin the clone.
- Wheel install (the build guide's default): the
- Use
pydevd.settracein code: Callpydevd.settraceon the line where you want execution to pause. This works for code typed into the Deephaven console, which has no source file for PyCharm to set a breakpoint in.
After the initial connection in step 4, you can call pydevd.settrace with no arguments. Here's an example using it as a breakpoint:
Each time the update call evaluates udf, execution pauses inside udf, and PyCharm shows its local variables, such as x. The table has 10 rows, so execution pauses 10 times. Click Resume Program to continue to the next row.
While execution is paused in a command you ran from the console, that command holds the update graph's lock. Ticking tables stop updating, and other console commands wait, until you resume. The tables then catch up.
In PyCharm, you can now use the full debugger. Step through Deephaven's Python source code, set breakpoints, and inspect variables and intermediate values inside function calls. Many resources are available online for using PyCharm's debugger, and JetBrains' guide to the debug console is a good starting point.
Debugging Deephaven has a few quirks of its own. Common problems when debugging Deephaven covers issues specific to Deephaven's table operations and ticking tables. For example, a breakpoint might not be hit because a table operation evaluates lazily. See Lazy evaluation of some table operations.
Debug Deephaven's Java engine
PyCharm can't step into Deephaven's Java engine. To debug the engine, use a JVM debugger such as IntelliJ IDEA. The Groovy version of this guide walks through it, with two changes for Python:
- Start the server from a shell where
source-dh-venvis active, with./gradlew server-jetty-app:run -Pdebug. Leave out-Pgroovy, which starts a Groovy console. - Follow that guide's steps 1-4 and Debugging Deephaven's internals in step 5, but run this Python code in place of its Groovy example:
IntelliJ pauses inside where when the JVM reaches the breakpoint.
Troubleshooting
Debugger won't connect
Problem: import pydevd or pydevd.settrace fails in the Deephaven console.
Solutions:
- Verify that the PyCharm debug server is running. Its green bug icon is active while it runs.
- Check that no firewall blocks port
4444. - Ensure the port in the
pydevd.settracecall matches the port in the PyCharm configuration. - If
import pydevdfails, verify thatsource-dh-venvis active in the shell where you started the server, and that it is the PyCharm project interpreter.
Gradle build fails
Problem: The ./gradlew server-jetty-app:run command fails with errors.
Solutions:
- Verify you successfully built Deephaven from source following the build guide.
- Check that you're running the Gradle command from the
deephaven-corerepository root. - Ensure the build guide's prerequisites are installed.
- Try cleaning and re-running:
./gradlew clean, followed by./gradlew server-jetty-app:run.
PyCharm can't find Deephaven source files
Problem: When debugging, PyCharm shows "Source code not available" or can't find files.
Solutions:
- Verify the PyCharm project was created from the same
deephaven-coredirectory used to build and run the server. - Check that the Python interpreter is set to
source-dh-venv. - Look for Deephaven's Python source where the server loads it: under External Libraries for a wheel install, or in
py/serverfor an editable install (see step 5).
Breakpoints are not hit
Problem: Execution runs through a breakpoint without pausing.
Solutions:
- Confirm that the debugger is connected. Look for the
Connected to pydev debuggerline in PyCharm's debugging console. - Set breakpoints in the copy of Deephaven's Python source that the server runs: the copy installed in
source-dh-venvfor a wheel install, orpy/serverfor an editable install (see step 5). - If you use
update_view, switch toselectto force eager evaluation. See Lazy evaluation of some table operations.
Version compatibility issues
Problem: Debugger behaves unexpectedly, shows errors, or features don't work.
Solutions:
- Use PyCharm 2024 or later. Debugging Deephaven with PyCharm 2023 has known problems.
- Check which debugger package your PyCharm version expects. The Python Debug Server configuration dialog in step 3 shows a
pip install pydevd-pycharm~=<build>command, where<build>is your PyCharm build number. - Run
pip show pydevd pydevd-pycharminsource-dh-venvto check which packages and versions are installed. - If the generic
pydevdpackage doesn't work with your PyCharm version, install thepydevd-pycharmversion the dialog shows, and useimport pydevd_pycharmandpydevd_pycharm.settracein place ofimport pydevdandpydevd.settrace.
Related documentation
- Deephaven's live Directed-Acyclic-Graph (DAG)
- Table operations overview
- Deephaven's table types
- Build Deephaven from source code
- Debug Python code in Deephaven
- Common problems when debugging Deephaven
- Formulas
- Debug Docker-run Deephaven with PyCharm
- Debug pip-installed Deephaven
- Debug an embedded Deephaven server with PyCharm
- Pre-shared key authentication
- Anonymous authentication
empty_tableselectupdateupdate_viewwhere