How to run full garbage collection
Garbage collection (GC) is a memory management process that automatically collects unused objects created on the heap and deletes them to free up memory. This guide shows how to use the convenience function garbage_collect to run garbage collection in Python and request a full garbage collection from the JVM.
The garbage_collect function runs garbage collection in Python first. It then requests that the JVM run its garbage collector twice, because Python and Java objects in Deephaven can hold references to each other.
Note
Java provides no way to force its garbage collector to run, so the effect of calling garbage_collect is non-deterministic.
To run garbage collection, import and call the function:
When to run garbage collection
You don't need to call garbage_collect for Deephaven to free memory. The JVM runs its garbage collector on its own when it needs space for new objects, so used memory normally rises and falls in a sawtooth pattern. How does memory work in the JVM? explains this pattern.
Call garbage_collect when you want unused memory reclaimed now, rather than when the JVM next needs space. For example:
- After you delete large tables, to measure how much memory your remaining objects use. Measure memory before and after garbage collection shows how.
- When table columns that hold Python objects aren't being freed, as described in The Python-Java boundary.
Running garbage collection has overhead, so don't call it routinely.
For tables created by a query on ticking data, a liveness scope can be a better tool than garbage_collect. Unreferenced ticking tables keep updating until the JVM collects them. A liveness scope lets you stop their updates as soon as you're done with them. In both cases, the JVM reclaims their memory the next time it collects garbage.
Measure memory before and after garbage collection
This example creates a large table, replaces it with a second one of the same size, deletes the list that holds it, and then calls garbage_collect. It measures how many MiB of JVM heap memory are in use in two ways:
- A
printat each step shows the effect of that step immediately, as total JVM memory minus free memory. - A
memtable shows the memory samples the server takes every 15 seconds by default, so it shows the same trend over time.
The JVM can also collect unused objects on its own at any point. Your numbers differ from run to run, and a step can show less memory in use than the one before it.
The example holds two tables of about 763 MiB each at the same time, so it needs a JVM heap of at least 2 GB. If your server has a smaller heap, reduce the row count.
First, create a table that tracks memory over time, and print the starting memory use. The code does the following:
- The
deephaven.perfmonmodule'sserver_statefunction returns a table of server statistics. ItsUsedMemMiBcolumn records how much memory is in use. The Server State section of Performance tables describes the other columns. viewkeeps theIntervalStartandUsedMemMiBcolumns, andreverseputs the newest sample at the top.- jpy gets the JVM's
java.lang.Runtimeobject,rt, which theprintcalls use to read total and free memory. - The list
xholds the tables that the later steps create and delete.
The mem table starts with no rows and gains one at each sample. It can also show samples from before you created it. That's because all server_state results, from any session, share one table of samples until every earlier result has been garbage collected.
Next, use empty_table and update to create a table with 100 million rows and one double column, and store it in x[0].
The new column holds 100 million 8-byte values, about 763 MiB, so used memory can rise by about that much.
Then, replace the table with a second one of the same size, and delete x. Typically, neither reassigning x[0] nor running del x frees memory by itself. The memory stays in use until the JVM collects it.
Finally, run garbage collection in its own block:
One call doesn't always reclaim every unused table, so run garbage_collect a second time:
The following screenshot shows the printed output from one run, above the mem table. The table includes samples from before and after garbage collection:
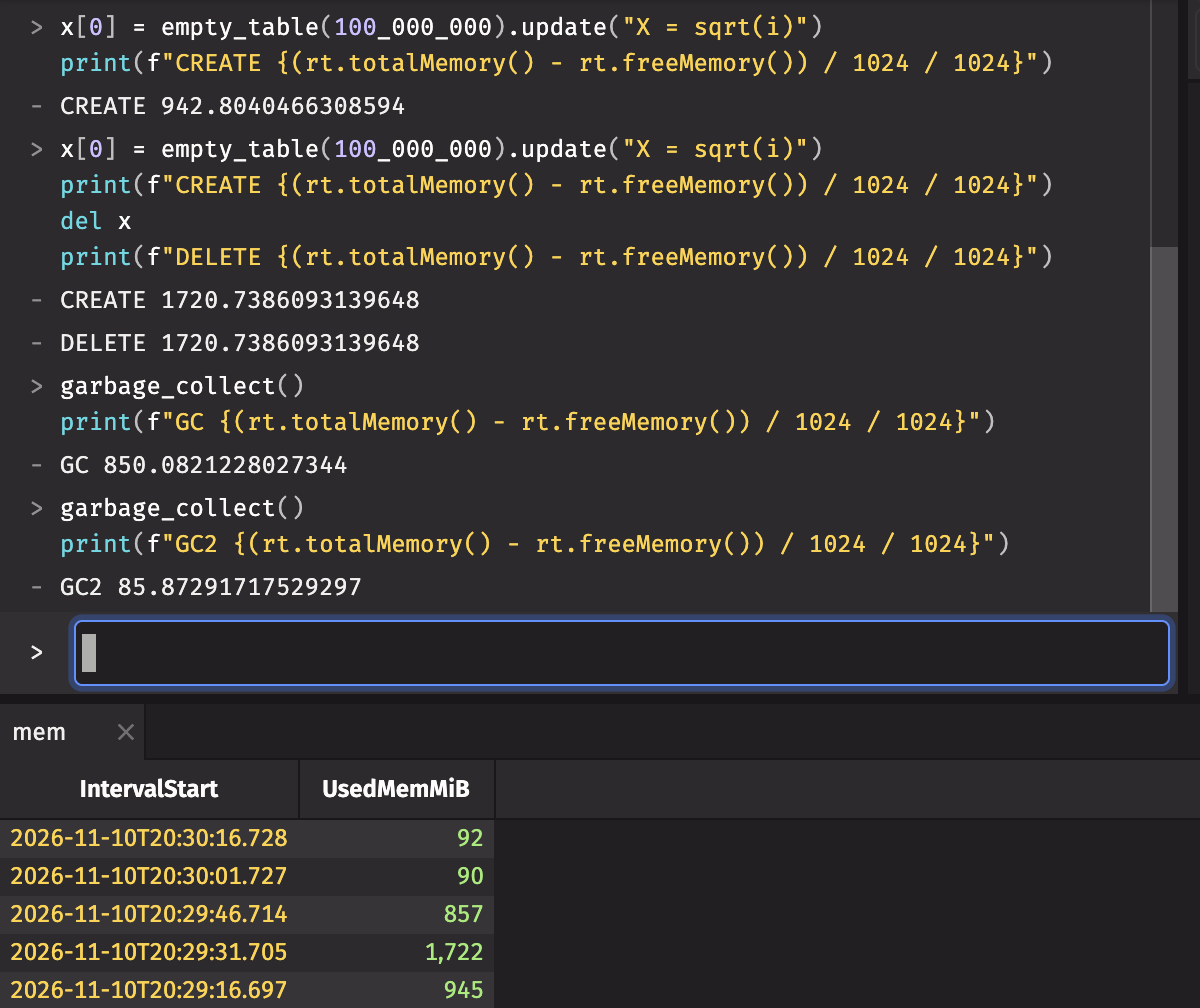
The printed values typically show the following:
- The first
CREATEvalue is higher thanSTART, by up to the size of the table. The increase can be smaller if the JVM collects leftover garbage while it allocates the table. - The second
CREATEvalue includes both tables. Replacingx[0]removes the reference to the first table, but that table's memory stays in use. DELETEshows no change, for the same reason.GCis usually about 770 MiB lower thanDELETE, the size of one table. The JVM treats a collection request as advisory, so a single call doesn't always reclaim everything that's unused.GC2is lower again, by about the size of the other table. Together, the two calls reclaim both tables.