Use table tools in the UI
Deephaven's web UI lets you reshape, format, and summarize tables without writing a query. These tools work on live, ticking tables as well as static ones, so you can sort, group, or add columns to data that is still updating.
This guide walks through the two menus that hold these tools:
- The column header menu: hide, freeze, filter, sort, reverse, value formatting and alignment, and a few other options.
- The Table Options menu: Chart Builder, column organization and grouping, conditional formatting, custom columns, rollup rows, aggregate columns, distinct values, CSV download, advanced settings, the Quick Filters toggle, the search bar, and the Go to bar.
Note
The deephaven.ui Python package lets you format tables programmatically. With it, you can:
You can also set column order, visibility, freezing, and groups with the built-in layout_hints table method.
Column header menu
To open the column header menu, right-click any column header.
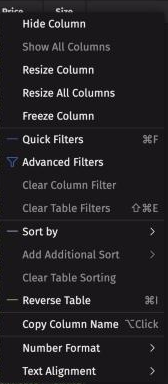
Hide column
To hide a column, right-click its header and choose Hide Column.
After you hide a column, the Show All Columns option becomes available. It shows all hidden columns again.
Freeze column
The Freeze Column option keeps a column in view as you scroll horizontally. Deephaven moves the column to the left edge of the table, after any columns that are already frozen.
You can't freeze a column that belongs to a column group, or any column in a table with expandable rows, such as a rollup table.
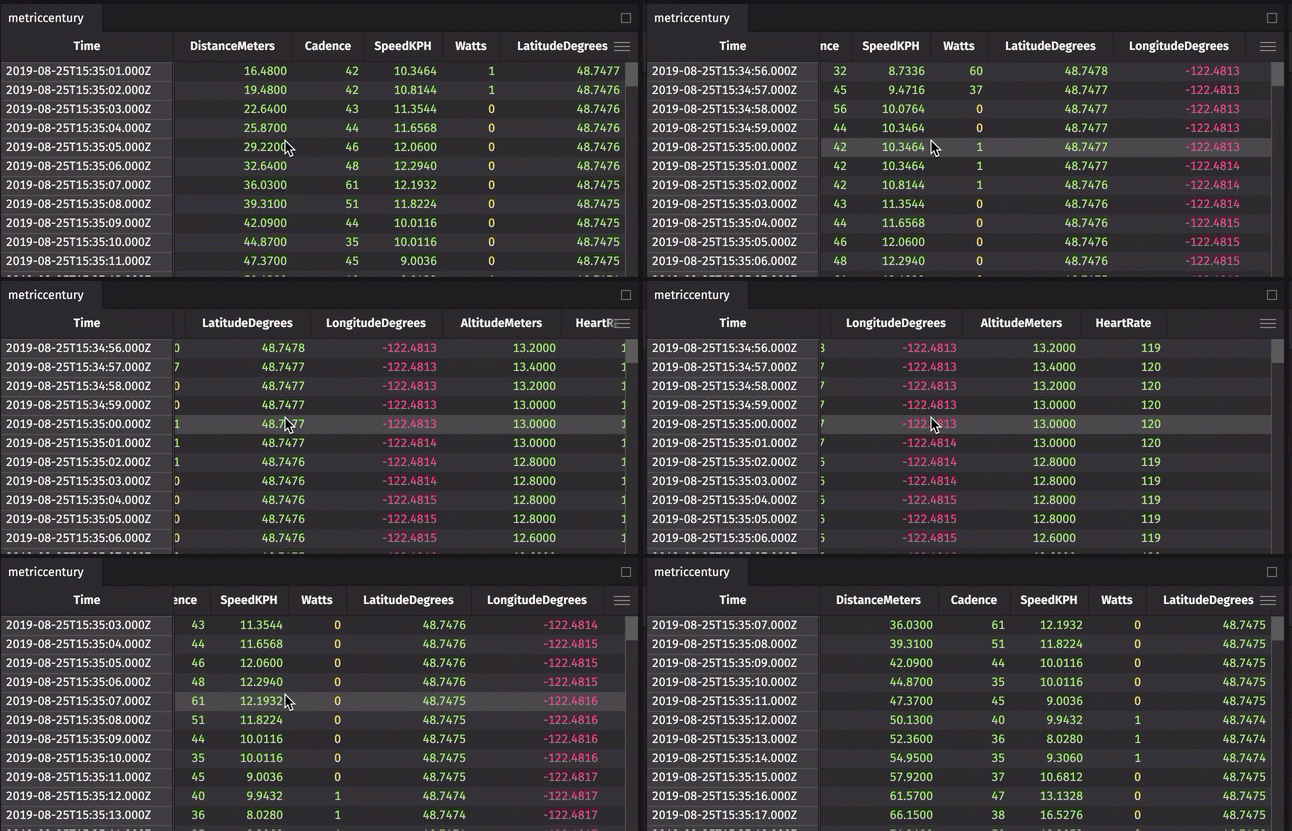
If a column is already frozen, its column header menu shows Unfreeze Column instead.
Quick filters
The Quick Filters option adds a filter row below the column headers, where you can type a value under any column to filter the table. You can also toggle it from the Table Options menu or with the keyboard shortcut Ctrl+F or ⌘F. See Quick filters in the filtering guide for details.
Advanced filters
The Advanced Filters option opens a panel with more ways to filter the data in a column. See Advanced filters in the filtering guide for details.
Sort by
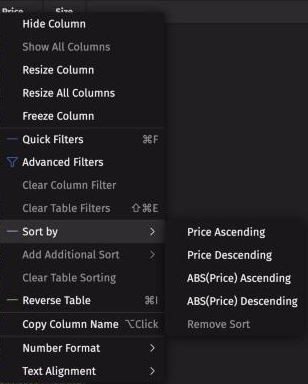
The Sort by option sorts a column in ascending or descending order. For numeric columns, it can also sort by absolute value.
After you sort one column, two more options become available:
- Add Additional Sort sorts by another column as well.
- Clear Table Sorting removes all sorts from the table.
Reverse table
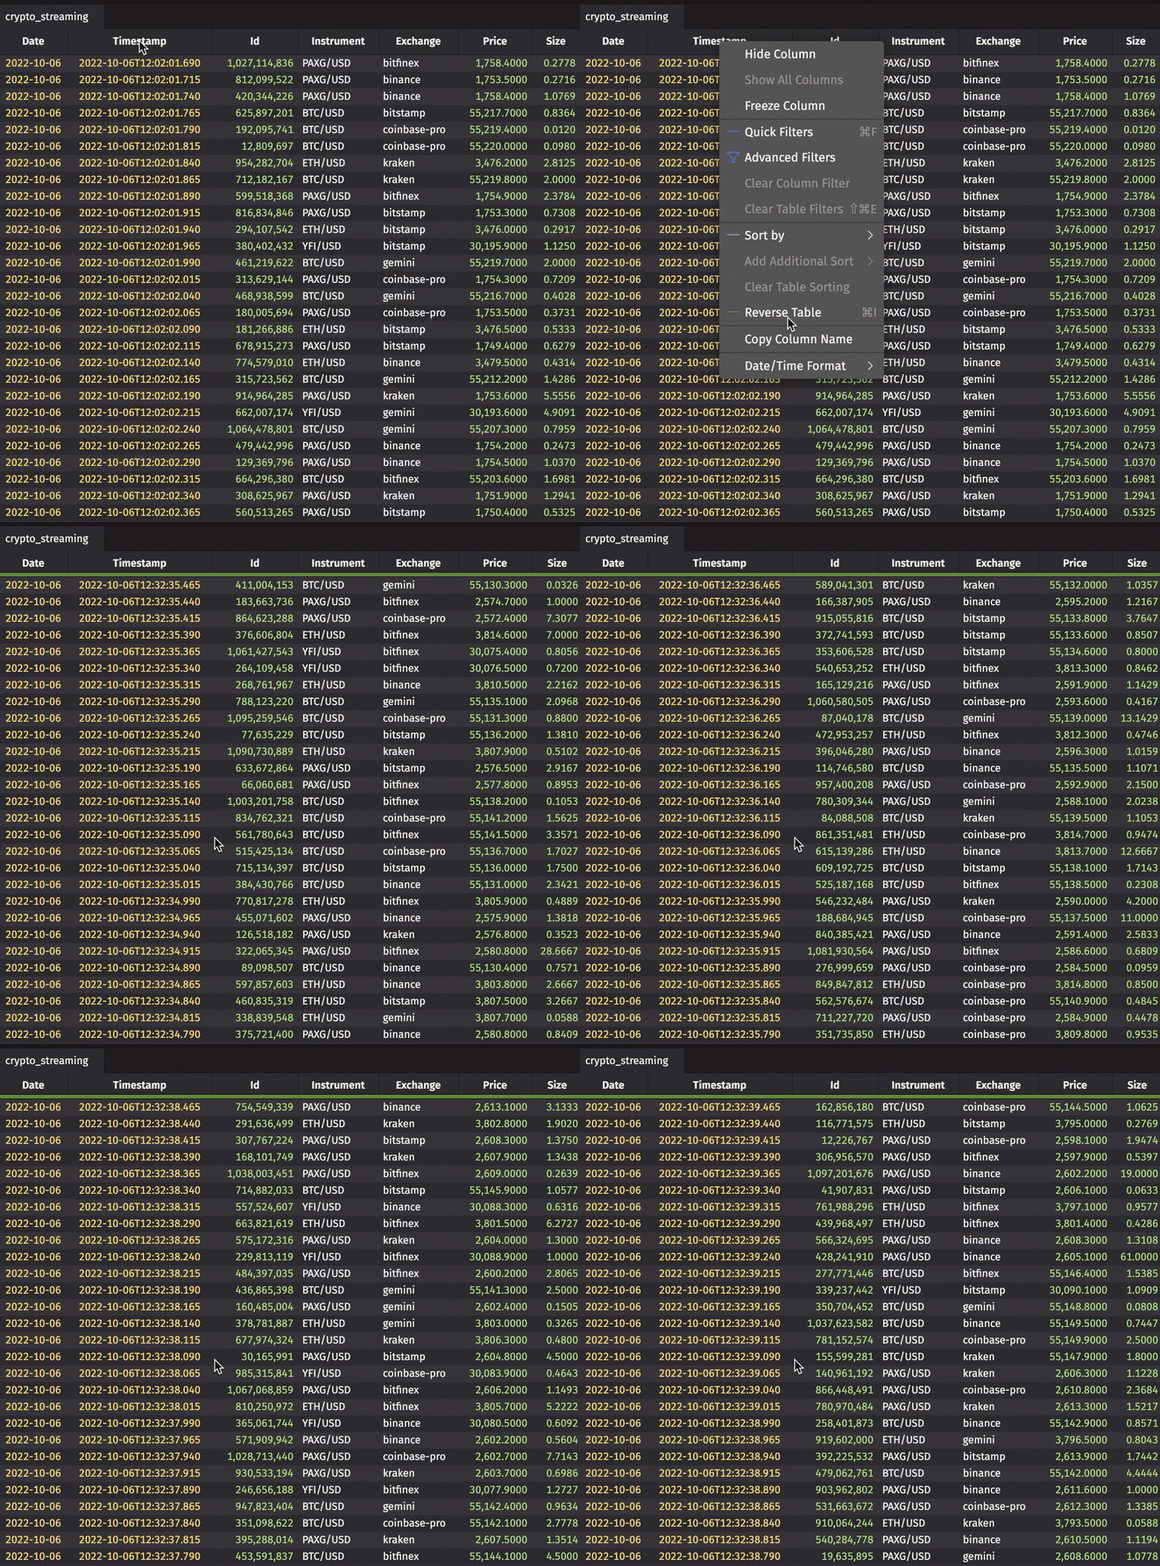
The Reverse Table option reverses the row order of the entire table. It produces the same result as the reverse method. Its keyboard shortcut is Ctrl+I or ⌘I. Once the table is reversed, the option reads Clear Reverse Table, and choosing it restores the original order.
Reversing is handy for live data. For example, if you reverse a ticking table that adds new rows at the end, such as a time table, new rows appear at the top of the table.
Format options
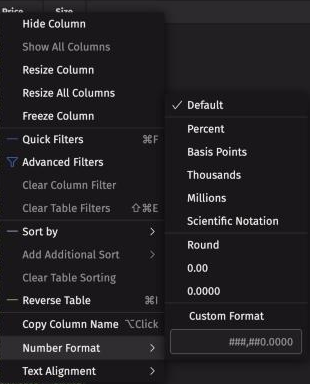
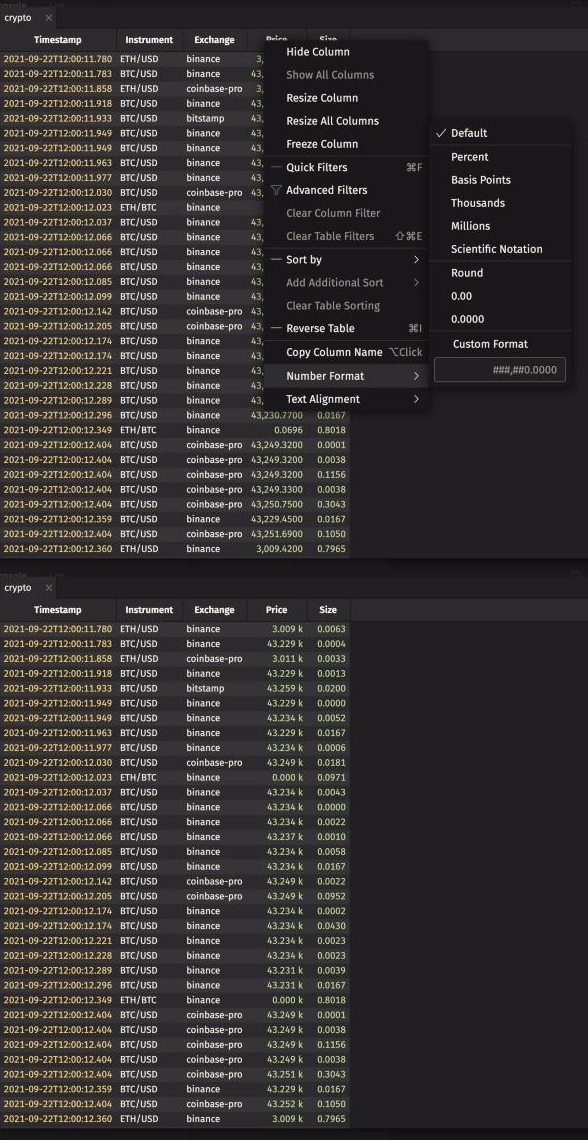
For columns that contain numeric data, the Number Format option changes how the column displays its values. For date-time columns, the Date/Time Format option appears instead. Every column also has a Text Alignment option.
Other options
The column header menu also includes these options:
- Resize Column resizes the column to fit its contents. Resize All Columns does the same for every visible column.
- Clear Column Filter removes the quick filter and advanced filter on that column.
- Clear Table Filters removes the table's quick filters, advanced filters, and search bar filter. Its keyboard shortcut is Ctrl+Shift+E or ⇧⌘E. To clear the filters on every table in a dashboard instead, see Clear all filters.
- Copy Column Name copies the column's name to the clipboard. You can also Alt-click or ⌥-click the header.
- Expand All Columns and Collapse All Columns appear only on tables with expandable columns.
Table Options menu
The Table Options menu offers several options to customize, manipulate, and download your table data. To open it, click the hamburger icon to the right of a table's column headers.
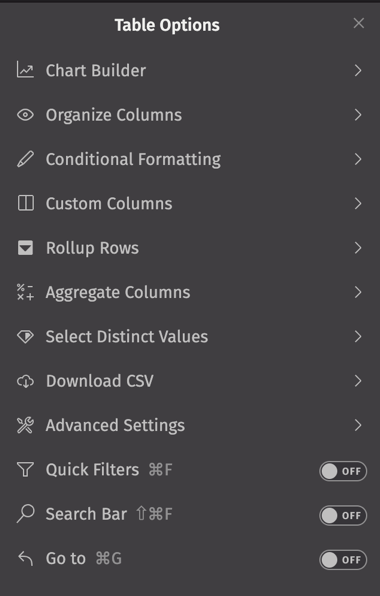
The menu shows only the options that the current table supports:
- On a rollup table, Chart Builder and Select Distinct Values don't appear, and Reverse Table is disabled in the column header menu.
- Rollup Rows and Select Distinct Values exclude each other. While one is in use, the other doesn't appear.
- Custom Columns doesn't appear while a Select Distinct Values selection is active.
Chart Builder
The Chart Builder option creates a plot from the table without writing a query. See the Chart Builder guide for details.
Organize columns
The Organize Columns option lets you drag and drop columns into the order you want them to appear. To hide a column, click the eye icon next to its name.
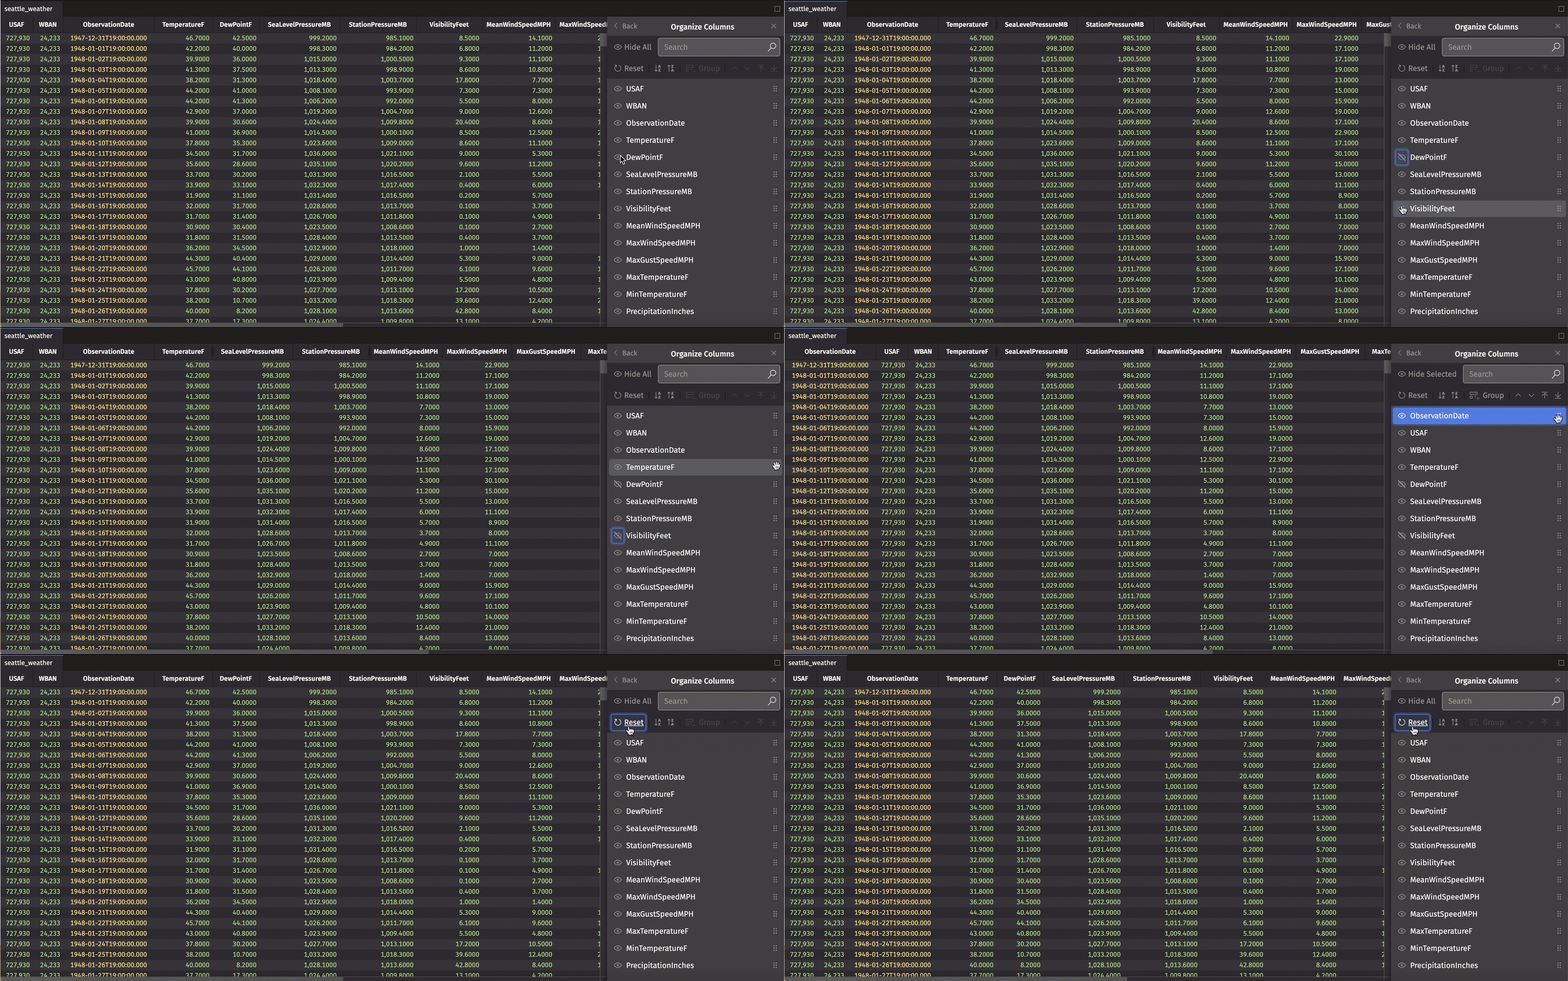
The toolbar at the top of the dialog includes these controls:
- Reset restores the table's original column order, column groups, and frozen columns, and shows any hidden columns again.
- The sort buttons reorder the table's movable columns by name, in ascending or descending order.
- Group creates a column group from the selected columns.
- The move buttons move the selected columns up, down, to the top, or to the bottom.
Group columns
The Organize Columns dialog can also put related columns into named groups. Groups are useful for organizing a wide table into logical sections.
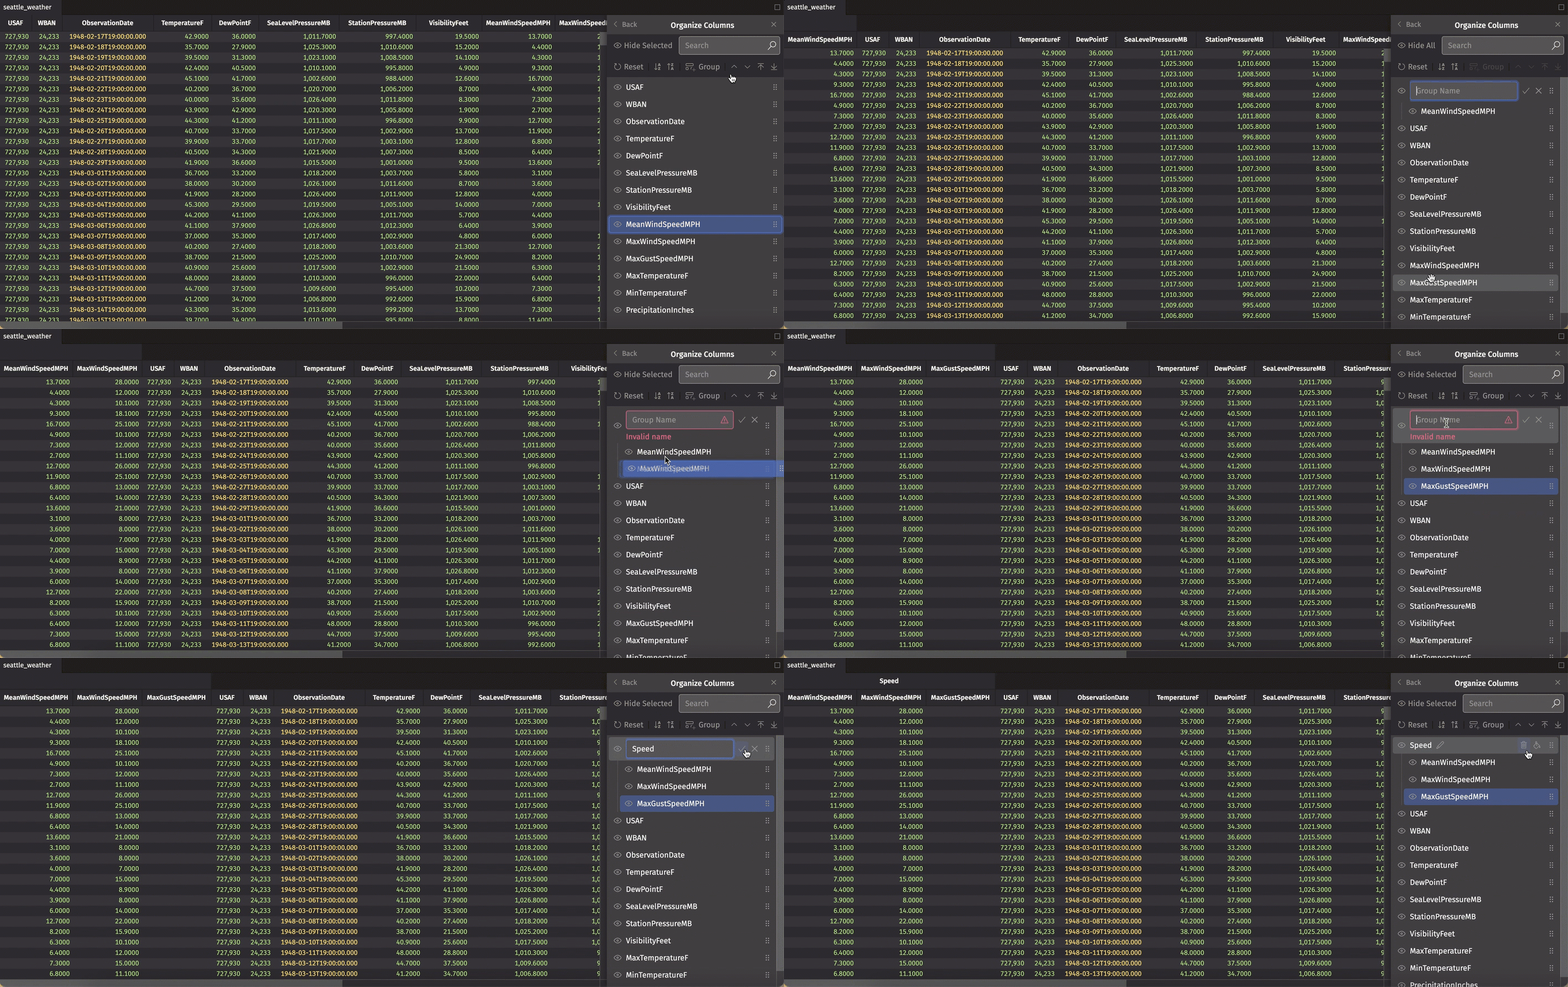
To create a group, select a column in the Organize Columns dialog and click Group. Then drag and drop any other columns you want to include. After you name the group, click the check mark (Confirm) to save. In the example below, we group the weather columns related to speed:
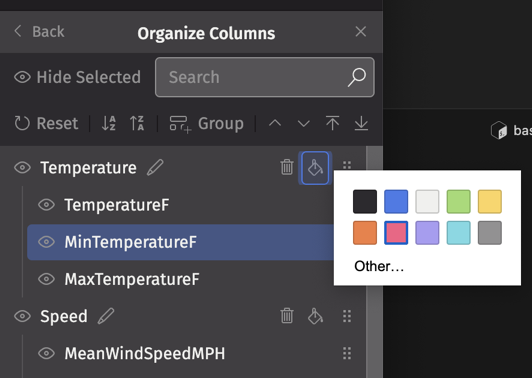
You can also choose a color for your column group using the paint can icon:
The table below now includes two groups with distinct colors:
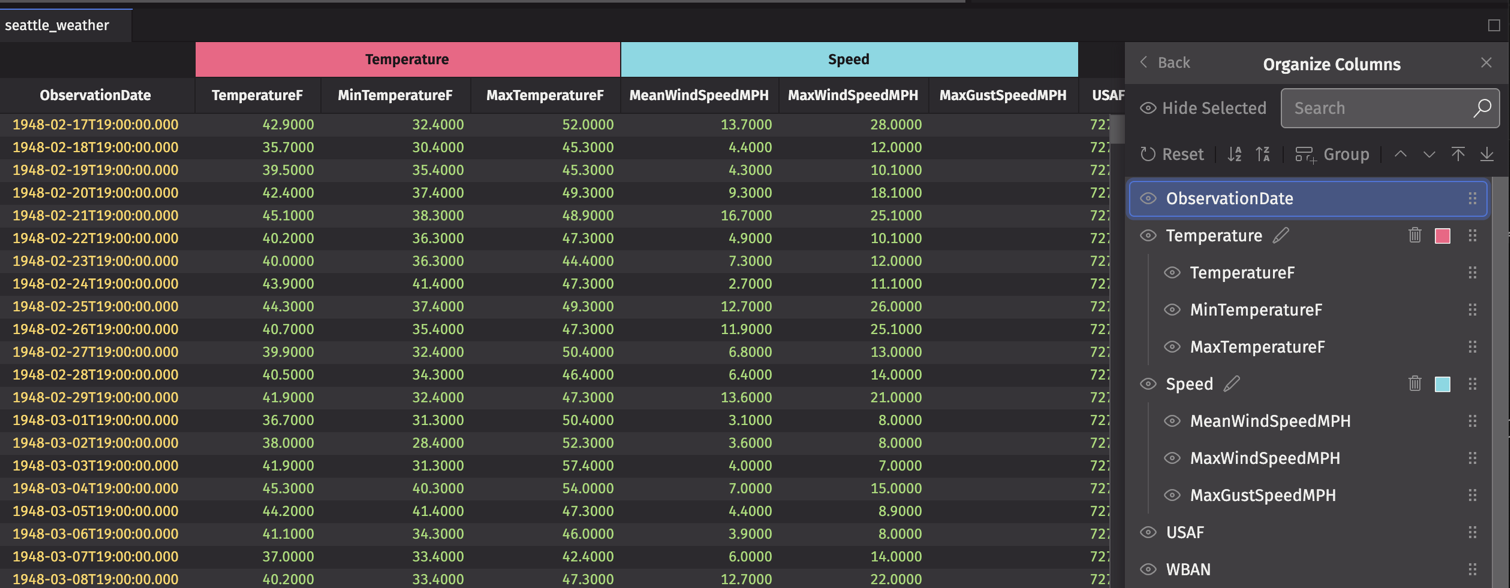
As with single columns, you can drag a group to change where it appears in your table.
Conditional formatting
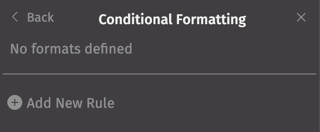
The Conditional Formatting option applies a style to cells or rows that match rules you define.
Select Add New Rule, then choose Conditional to format individual cells or Rows to format entire rows.
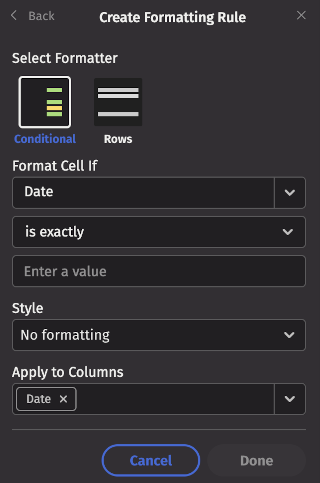
Then build the rule:
-
From the dropdown list, choose the column that the rule tests. This column is the left-hand side of the condition.
-
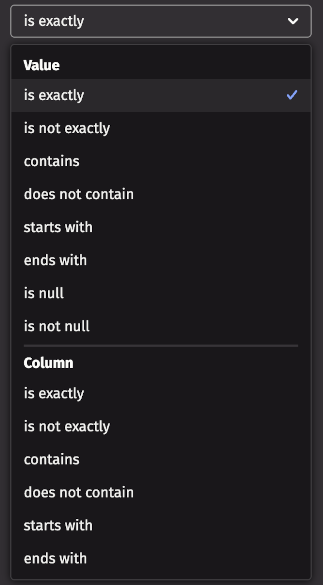
Select a condition. The available conditions depend on the column's data type. For a string column, they include is exactly, contains, and starts with.
- You can choose conditions that apply to Value or Column.
- With a Value condition, the right-hand side of the condition is a specific value. With a Column condition, it is another column in the table.
-
Select a style:
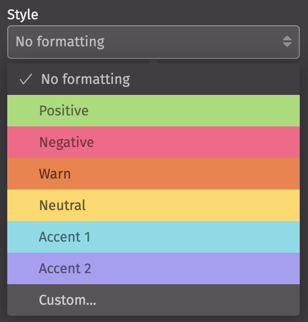
Six named styles, such as Positive and Negative, are available by default. The Custom... option lets you define your own color.
-
For a Conditional rule, you can use Apply to Columns to choose one or more columns for the rule to format. By default, the rule formats the left-hand column selected in the first step. Rows rules always format the entire row.
-
Click Done to save the rule.
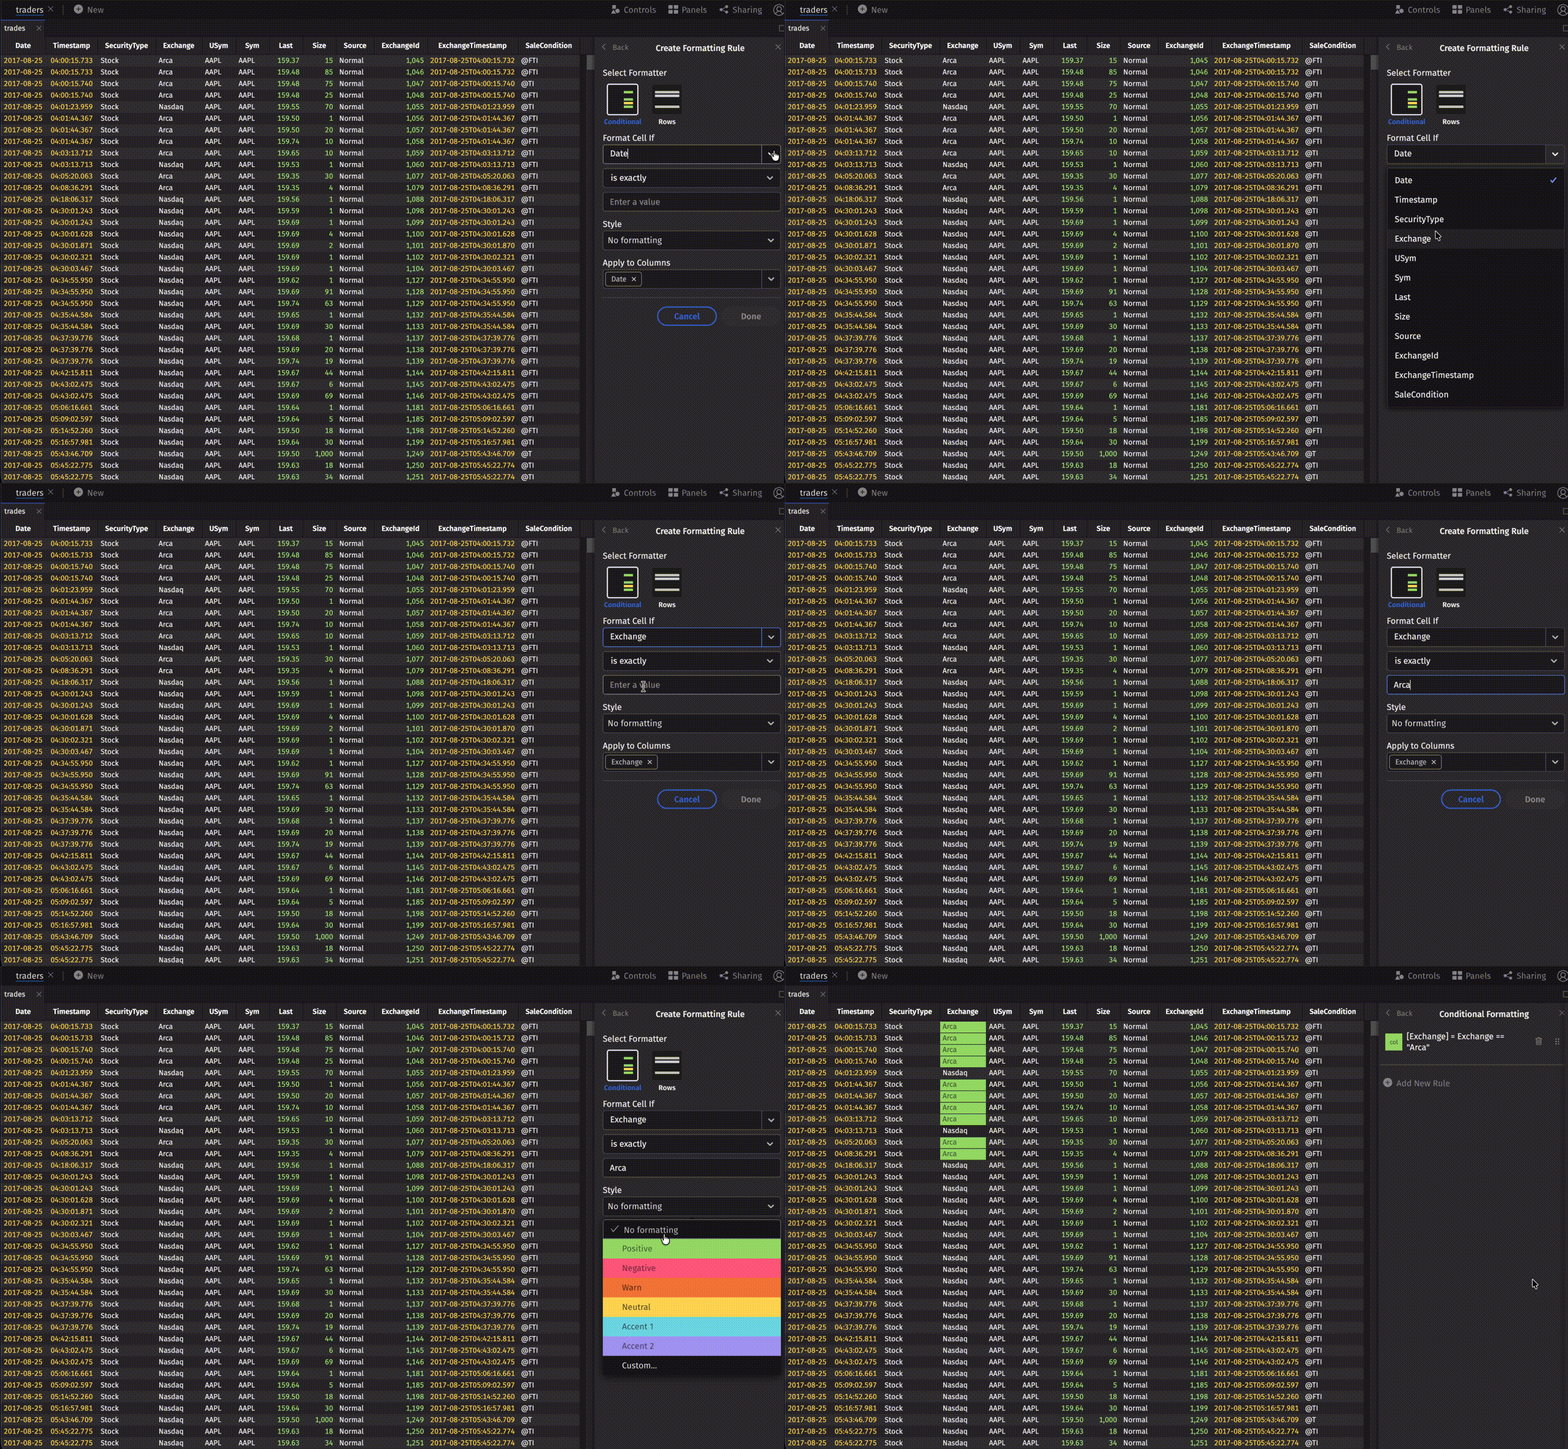
In the example below, Deephaven applies the Positive style to every cell in the Exchange column whose value is exactly Arca:
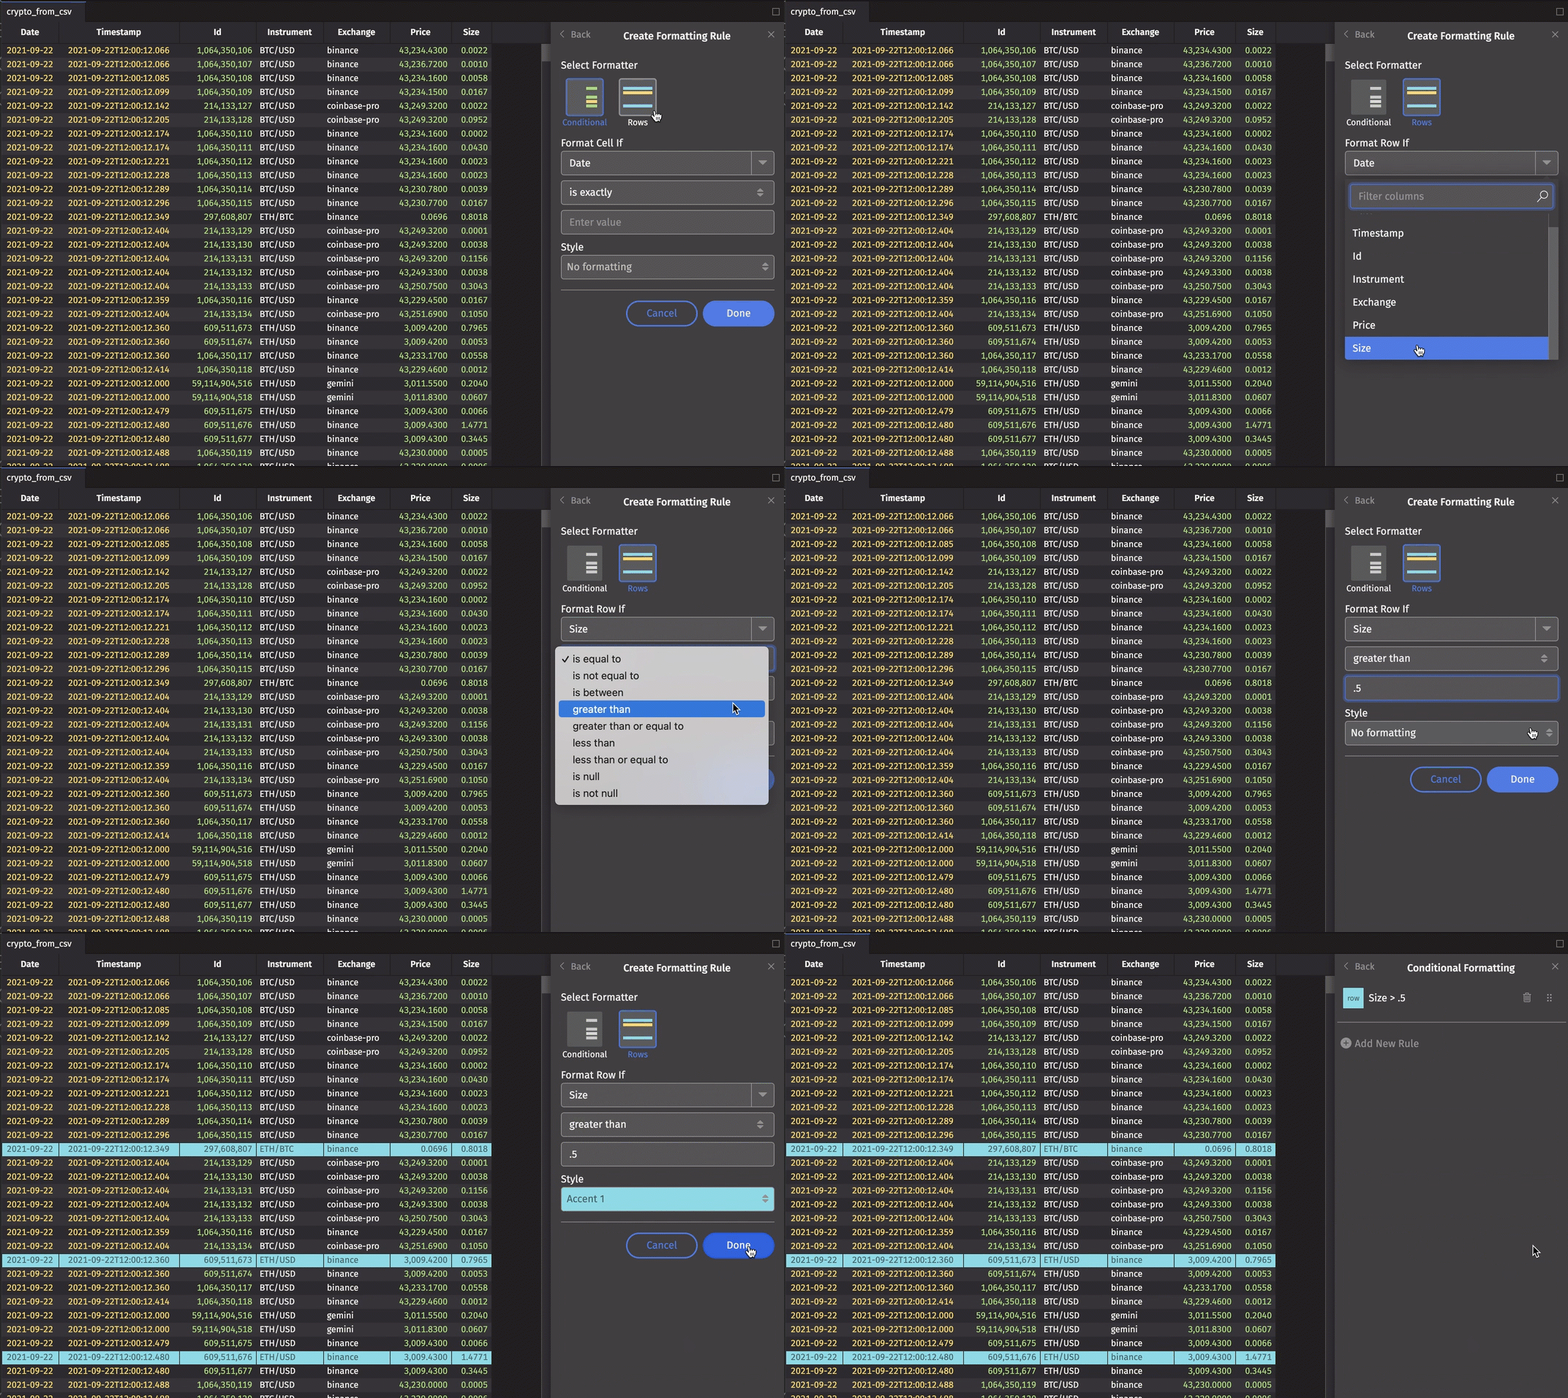
In the example below, a Rows rule applies the Accent 1 style to every row whose Size is greater than 0.5:
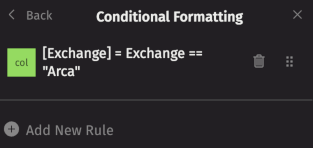
To delete or reorder your rules, return to the Conditional Formatting dialog.
To apply color formatting in a query instead, see Apply color formatting to columns.
Custom columns
The Custom Columns option adds one or more calculated columns to your table. Deephaven adds them with update_view.
Choose a name for your new column, then specify the formula in the field below. To add more columns, click Add Another Column. Click Save Column (or Save Columns) to add the columns to the table.
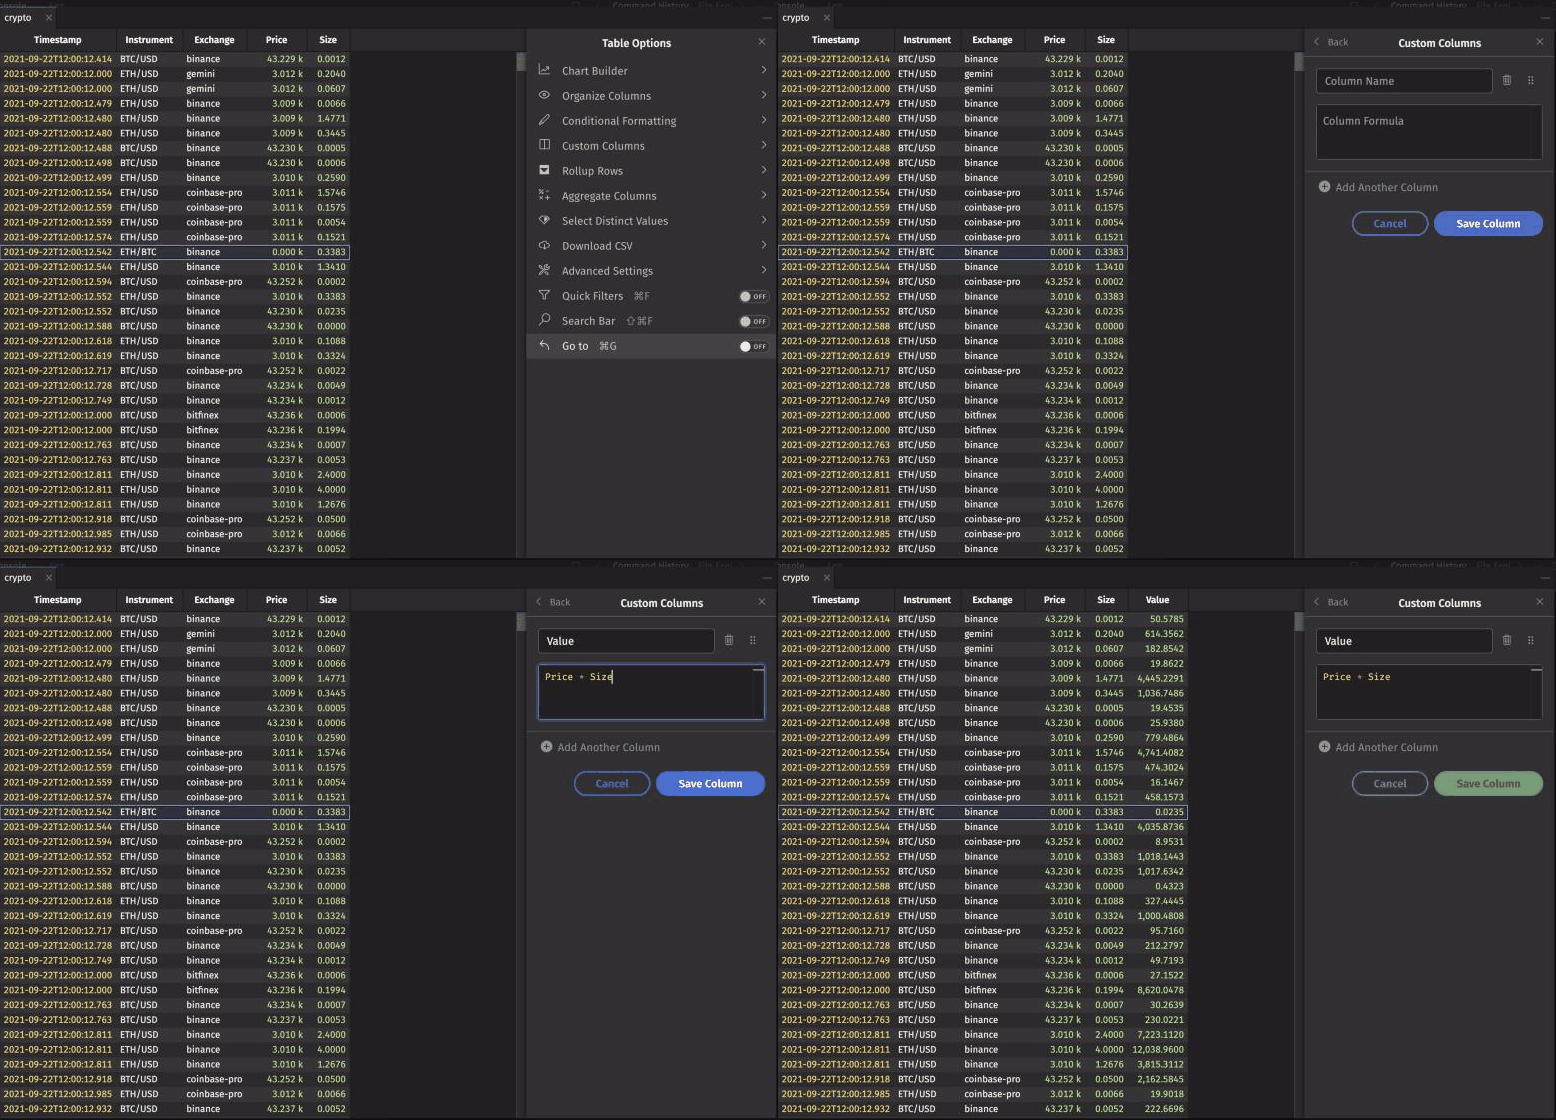
To reorder custom columns, drag and drop them into the order you want in the Custom Columns dialog.
Reopen the dialog to edit your formulas or delete columns.
Rollup rows
Rollup Rows groups the table by one or more columns and shows an aggregated row for each group, which you can expand to see the rows inside it.
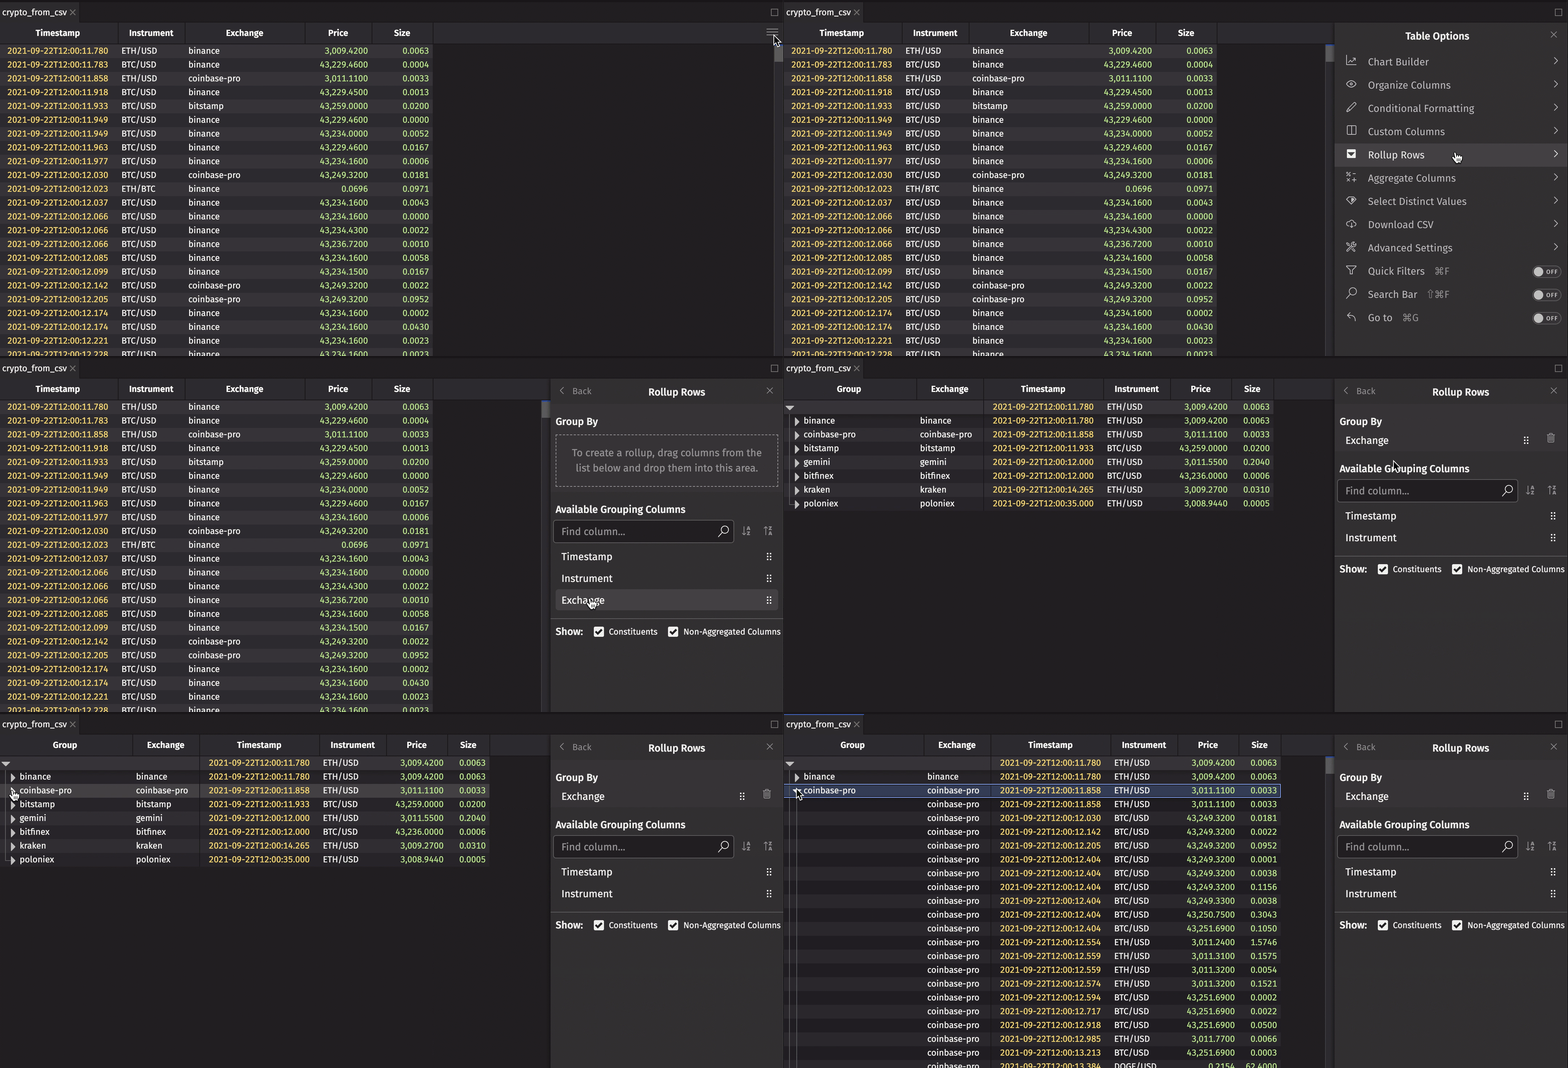
From the Table Options menu, select Rollup Rows. Drag each column you want to group by into the Group By section of the dialog:
To group by more than one column, drag each one into Group By. Each column adds another level to the rollup table, in the order the columns are listed. The example below groups by Instrument and then Exchange. It also uses Aggregate Columns to set a Sum aggregation on the Price and Size columns:
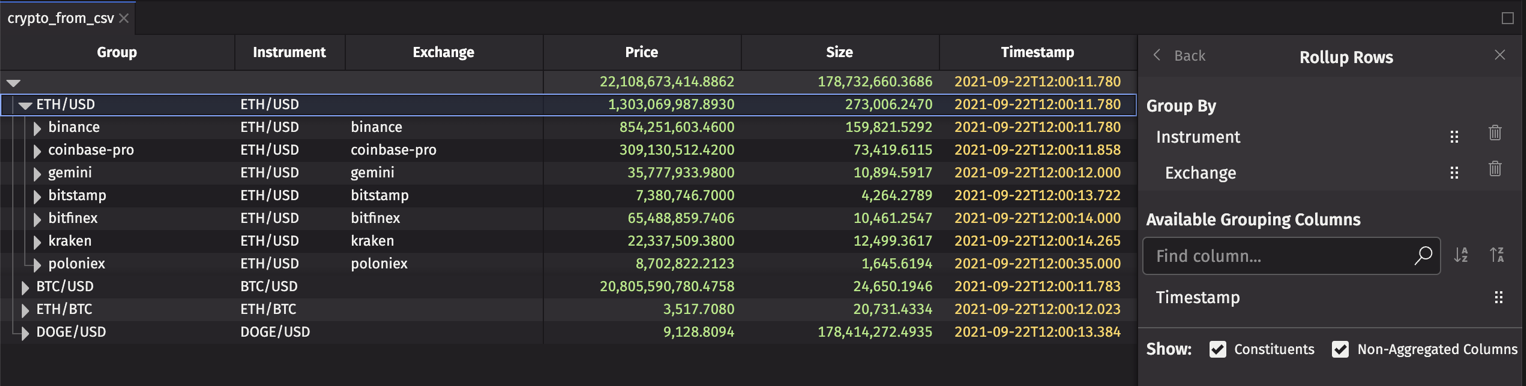
In the result table, only the top-level row, which aggregates the whole table, starts expanded. To expand a level, click the right-facing arrow next to its value in the Group column.
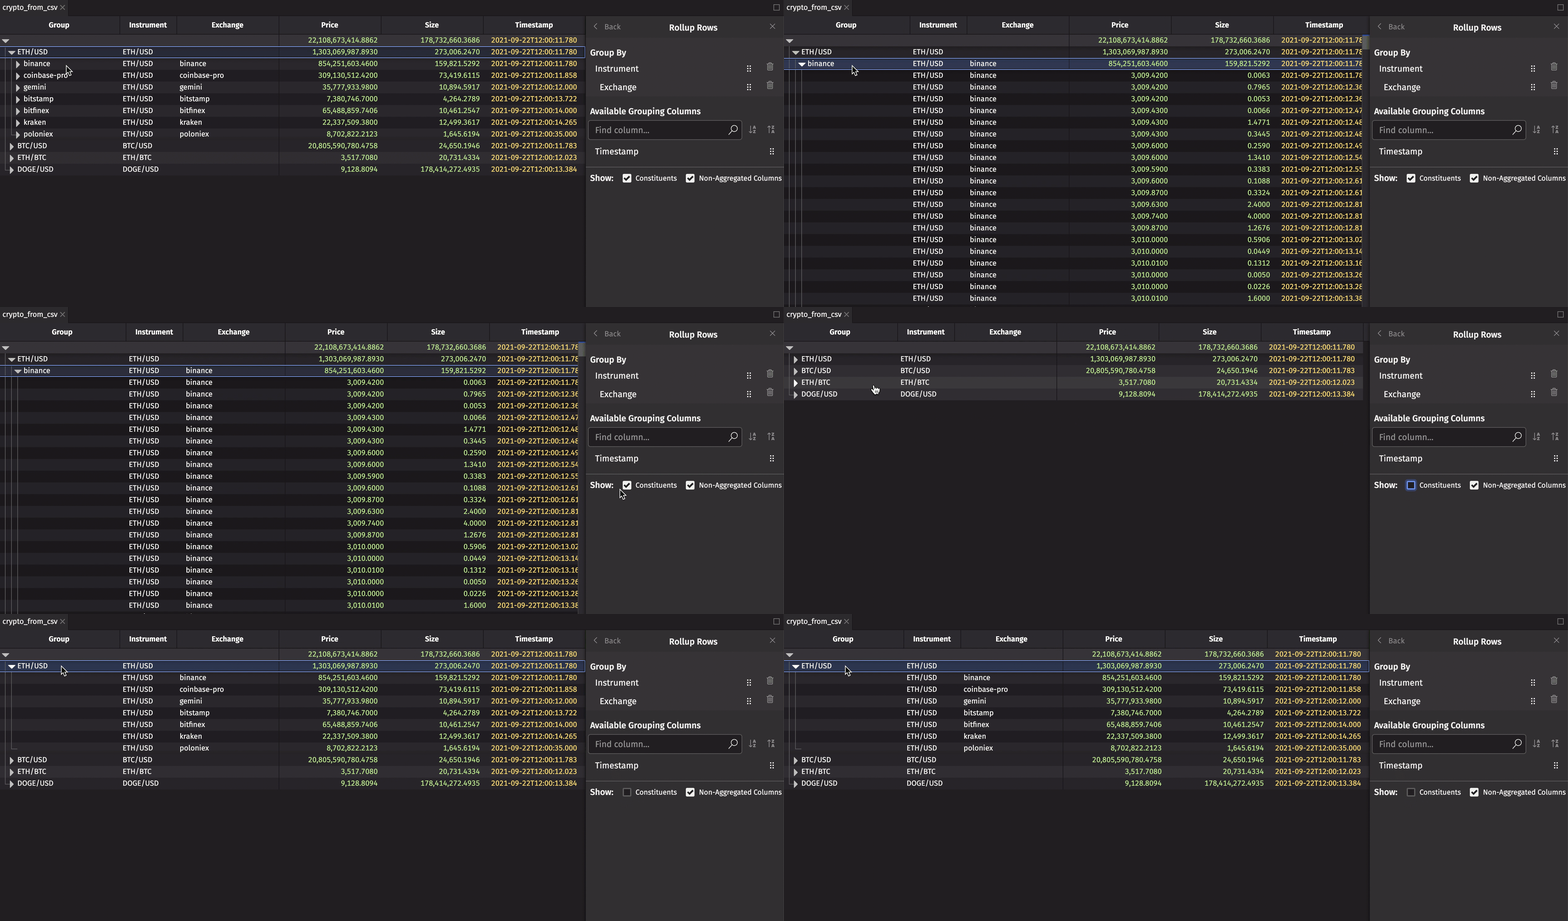
In the Rollup Rows dialog, uncheck the Constituents box to hide the original rows behind each aggregated row:
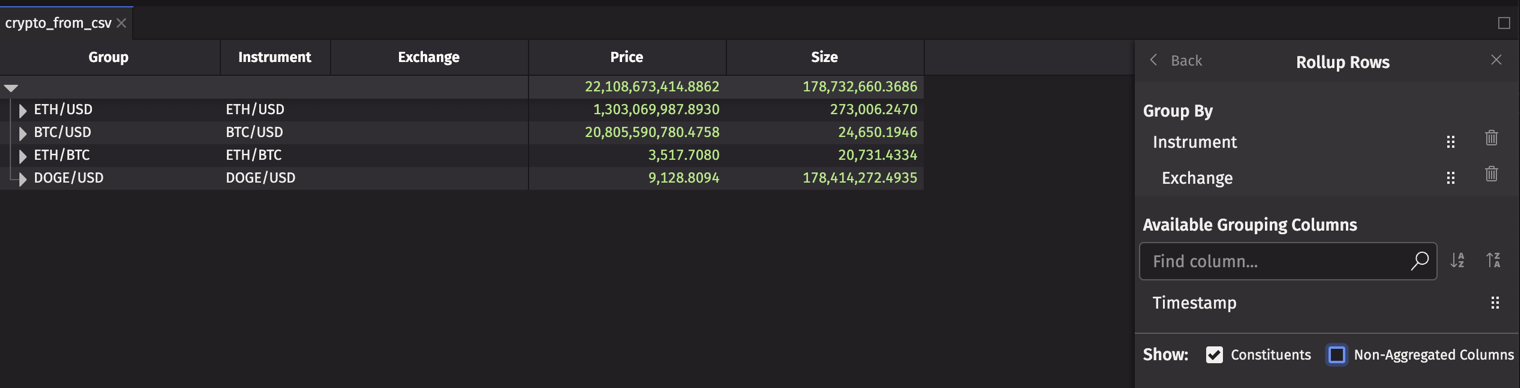
By default, the rollup table also shows every column that has no aggregation set, using its First value. To hide those columns, uncheck the Non-Aggregated Columns box:
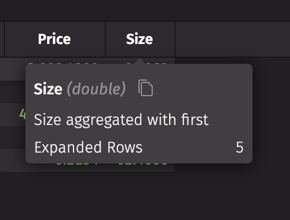
To see which aggregation a column uses, hover over its header. A column with no aggregation set shows First. The tooltip below comes from a rollup table where Size has no aggregation set yet:
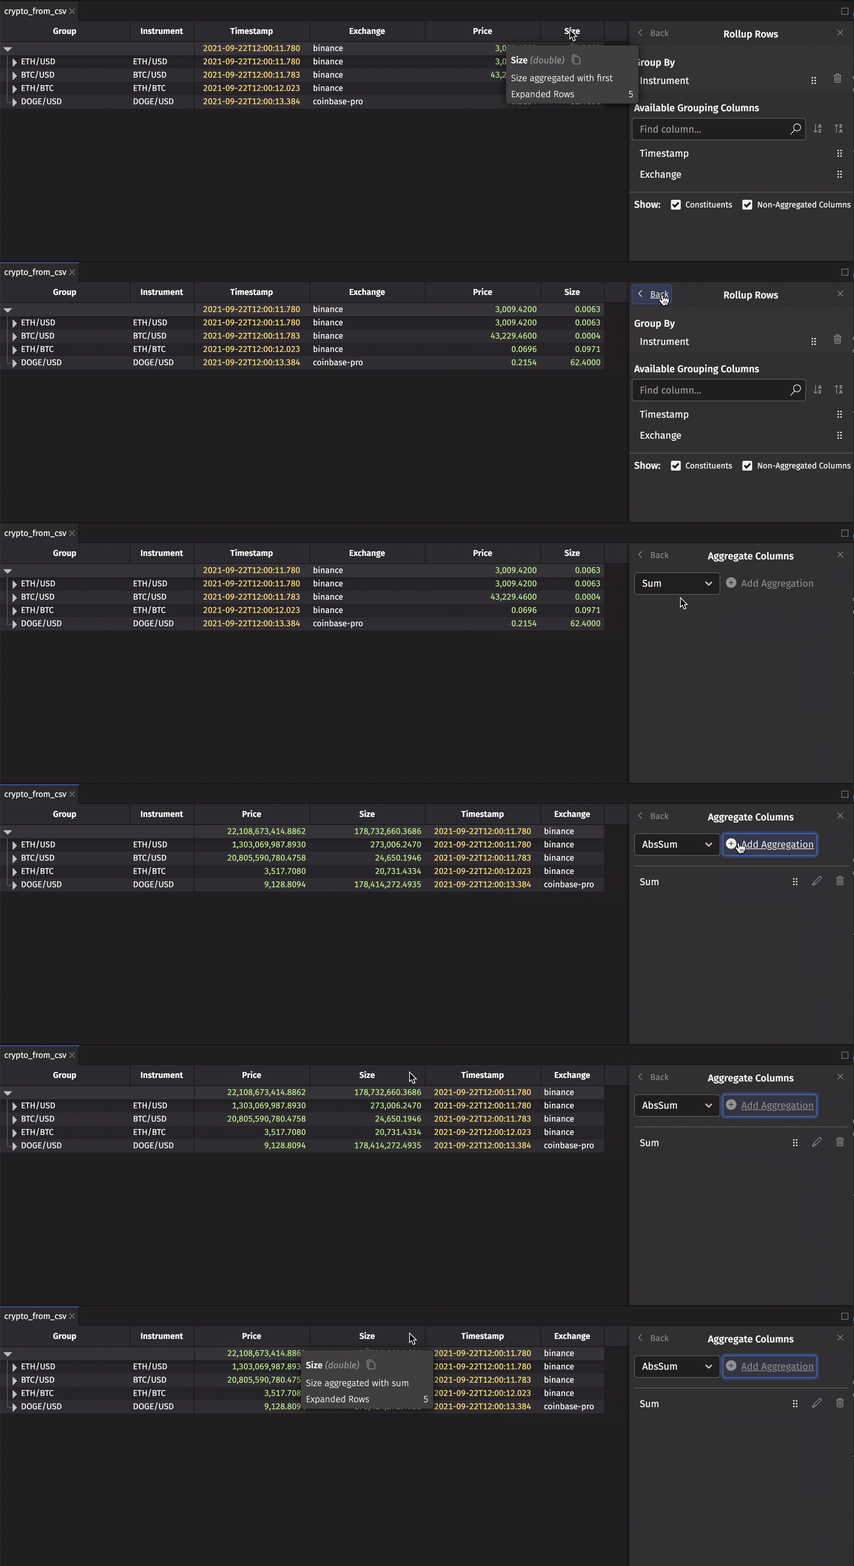
To change a column's aggregation, use Aggregate Columns from the Table Options menu. On a rollup table, it sets the aggregation used for each group:
Grouping clears the table's filters, sorts, reversed row order, column reordering, frozen columns, and any Select Distinct Values selection.
Note
To create rollup tables in a query, see Create a hierarchical rollup table programmatically.
Aggregate columns
The Aggregate Columns option adds a row to the top or bottom of your table that aggregates column data with the operation of your choice. Use it to quickly calculate the sum, average, or other aggregate of a column.
From the Table Options menu, select Aggregate Columns, choose an operation from the dropdown, and click Add Aggregation.
On a rollup table, the same steps set the aggregation used for each group instead of adding a summary row. The Median operation doesn't apply to rollup tables.
In the example below, we add an Avg (average) row and a Min (minimum) row to the top of the table:
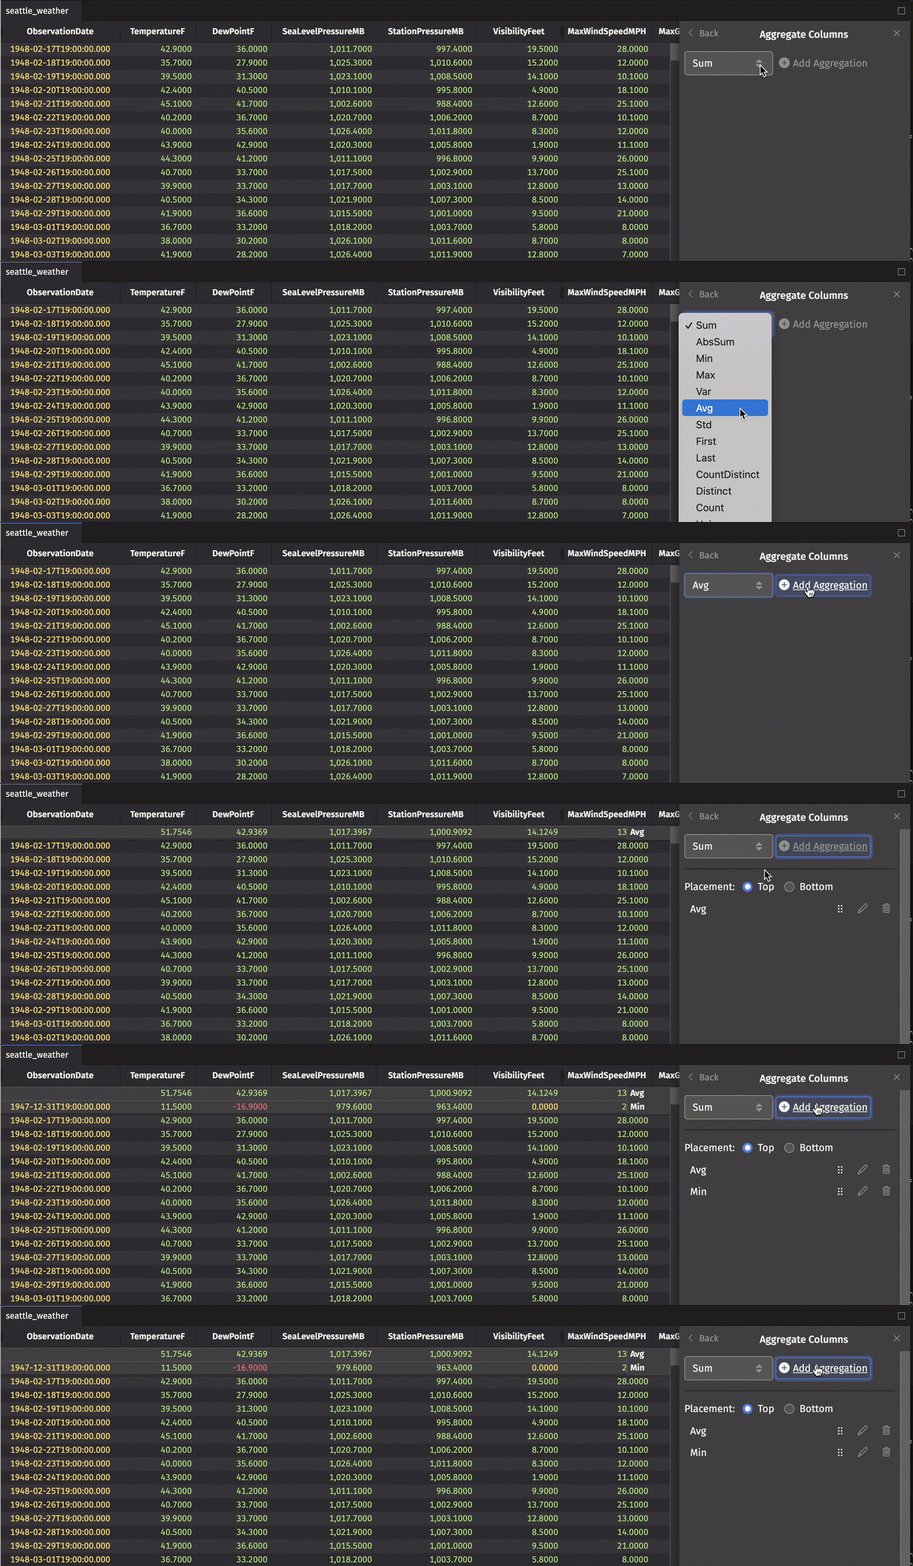
To reorder, edit, or delete these aggregations, return to the Aggregate Columns dialog.
Select distinct values
The Select Distinct Values option modifies a table to show unique values from a selected column. This produces the same result as the query method select_distinct.
From the Table Options menu of the table you'd like to reduce, choose Select Distinct Values. Pick the column whose unique values you want to see.
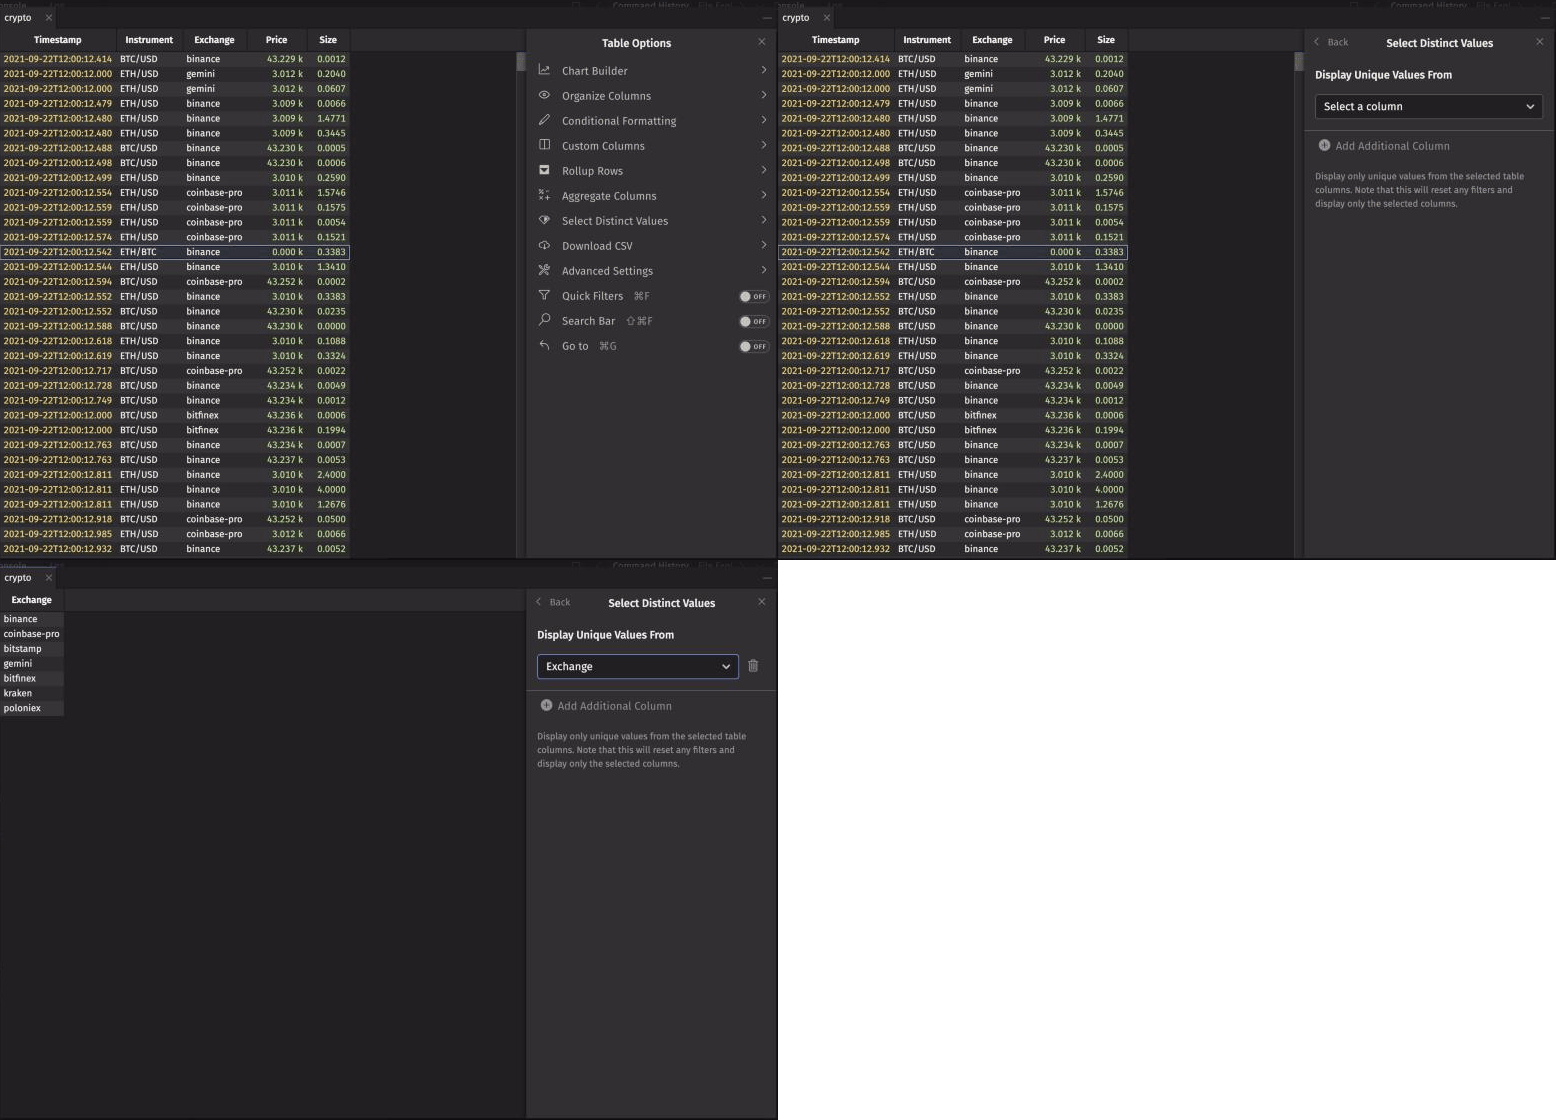
Selecting distinct values clears the table's filters, sorts, reversed row order, aggregations, and column reordering, and shows any hidden columns again.
After you apply it, you can change the selection in the same dialog:
- Select more columns to show the distinct combinations of their values.
- Click the trash icon next to a column to remove it. Removing every column shows all of the table's rows again, but does not restore any of the settings that Select Distinct Values cleared.
You can use the Linker with a table reduced by Select Distinct Values to drive filters on other tables.
Download CSV
The Download CSV option saves the table's data to a CSV file. In the dialog, you choose:
- Which rows to download: all rows, only the selected rows, or a number of rows from the top or bottom of the table.
- The file name.
- Whether to include column headers and hidden columns.
- Whether to write unformatted values instead of the table's displayed formatting.
Advanced settings
The Advanced Settings option controls whether Input Filters, Dropdown Filters, and the Linker add to a table's existing filters or replace them. See Advanced settings in the filtering guide for details.
Quick Filters toggle
The Quick Filters toggle shows or hides the quick filter row. See Quick filters.
Search bar
The Search Bar option adds a search bar to the table. By default, the search bar searches all columns for your term. You can also toggle it with the keyboard shortcut Ctrl+Shift+F or ⇧⌘F. See Search bar in the filtering guide for details.
Go to
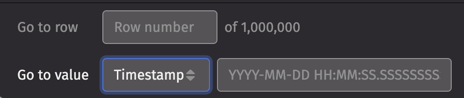
The Go to option opens a bar at the bottom of the table. Use it to jump to a value or a row number. You can also open it with the keyboard shortcut Ctrl+G or ⌘G, or by right-clicking a cell and choosing Go to.
Go to value
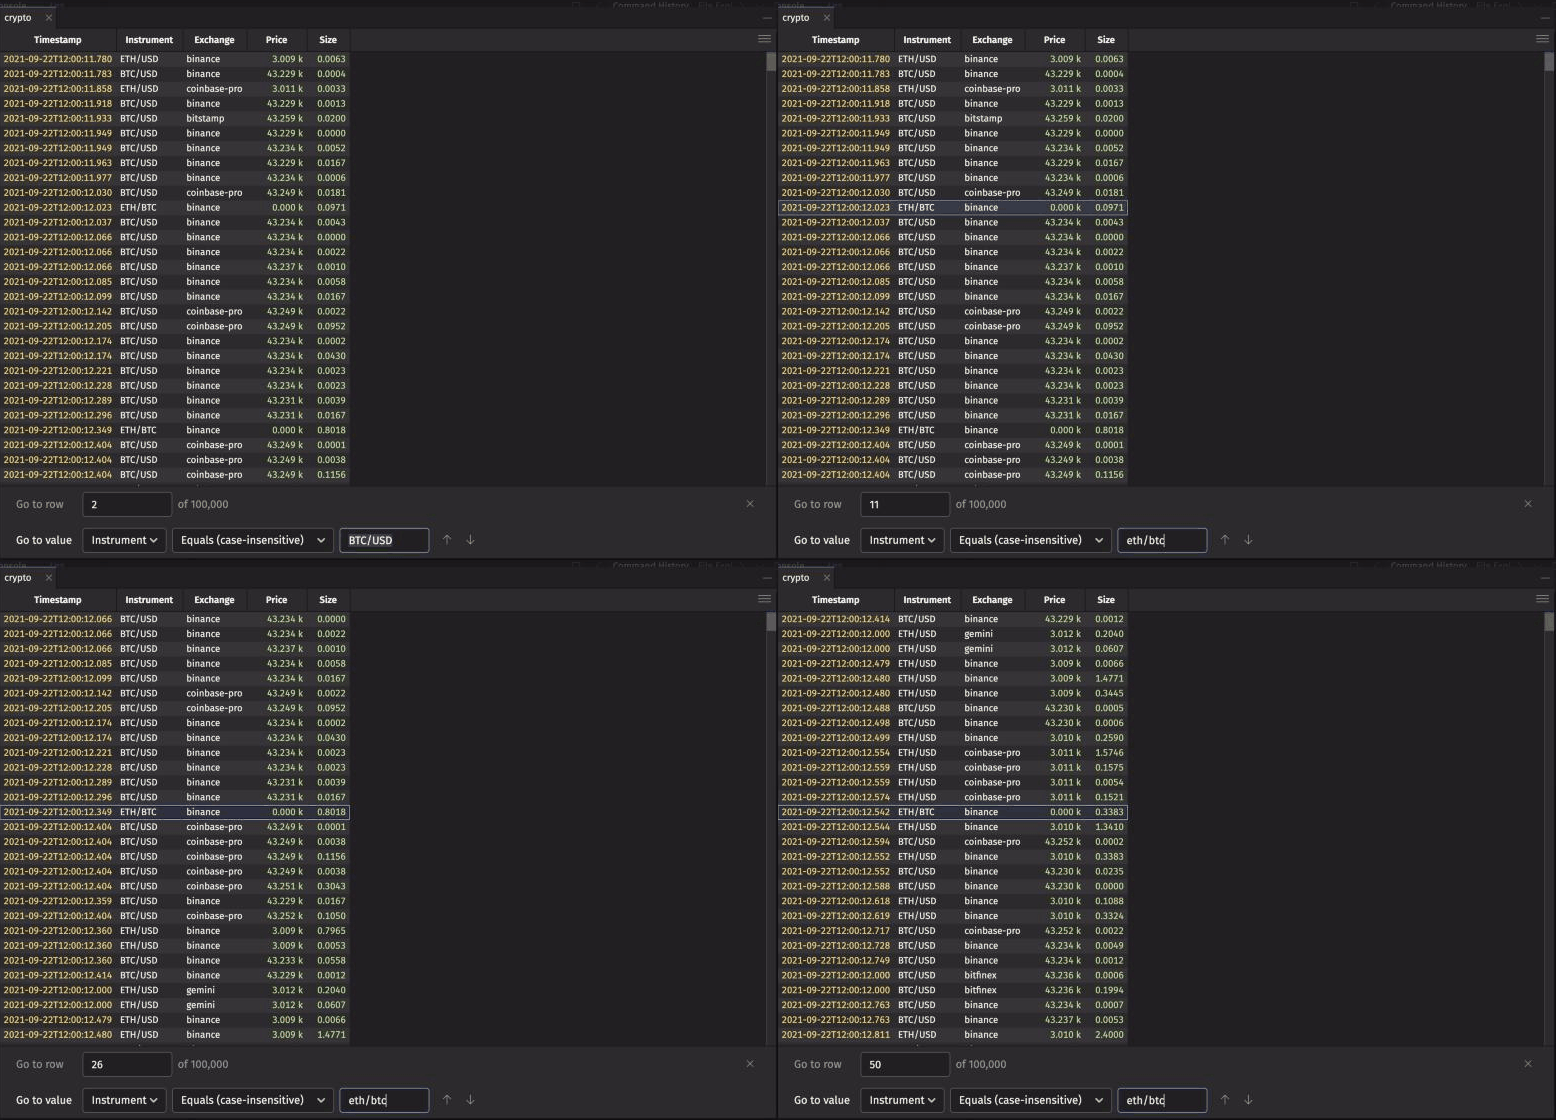
The Go to value option jumps to a value in the table. Choose a column from the bar's column dropdown. The search options depend on that column's data type. For example, when you select the Timestamp column, the search field accepts date-time values. When you select the Instrument column, it offers case-sensitive and case-insensitive equals and contains matching.
Go to row number
The Go to row number option jumps to a row number in your table.
