Debug built-from-source Deephaven with IntelliJ IDEA
When building Deephaven from source code for development tasks, you can debug both your own Groovy scripts and Deephaven's internal Java and Groovy source. This is useful for:
- Contributing to Deephaven development.
- Understanding how Deephaven works internally.
- Debugging issues that require stepping into Deephaven's source.
- Testing your own changes to Deephaven.
This guide walks through setting up IntelliJ IDEA's remote JVM debugger for a source-built Deephaven instance.
Setup
This guide assumes Deephaven has been built from source using the guide on building Deephaven from source. Following those steps produces a local clone of deephaven-core in a directory called deephaven-core.
1. Create an IntelliJ project
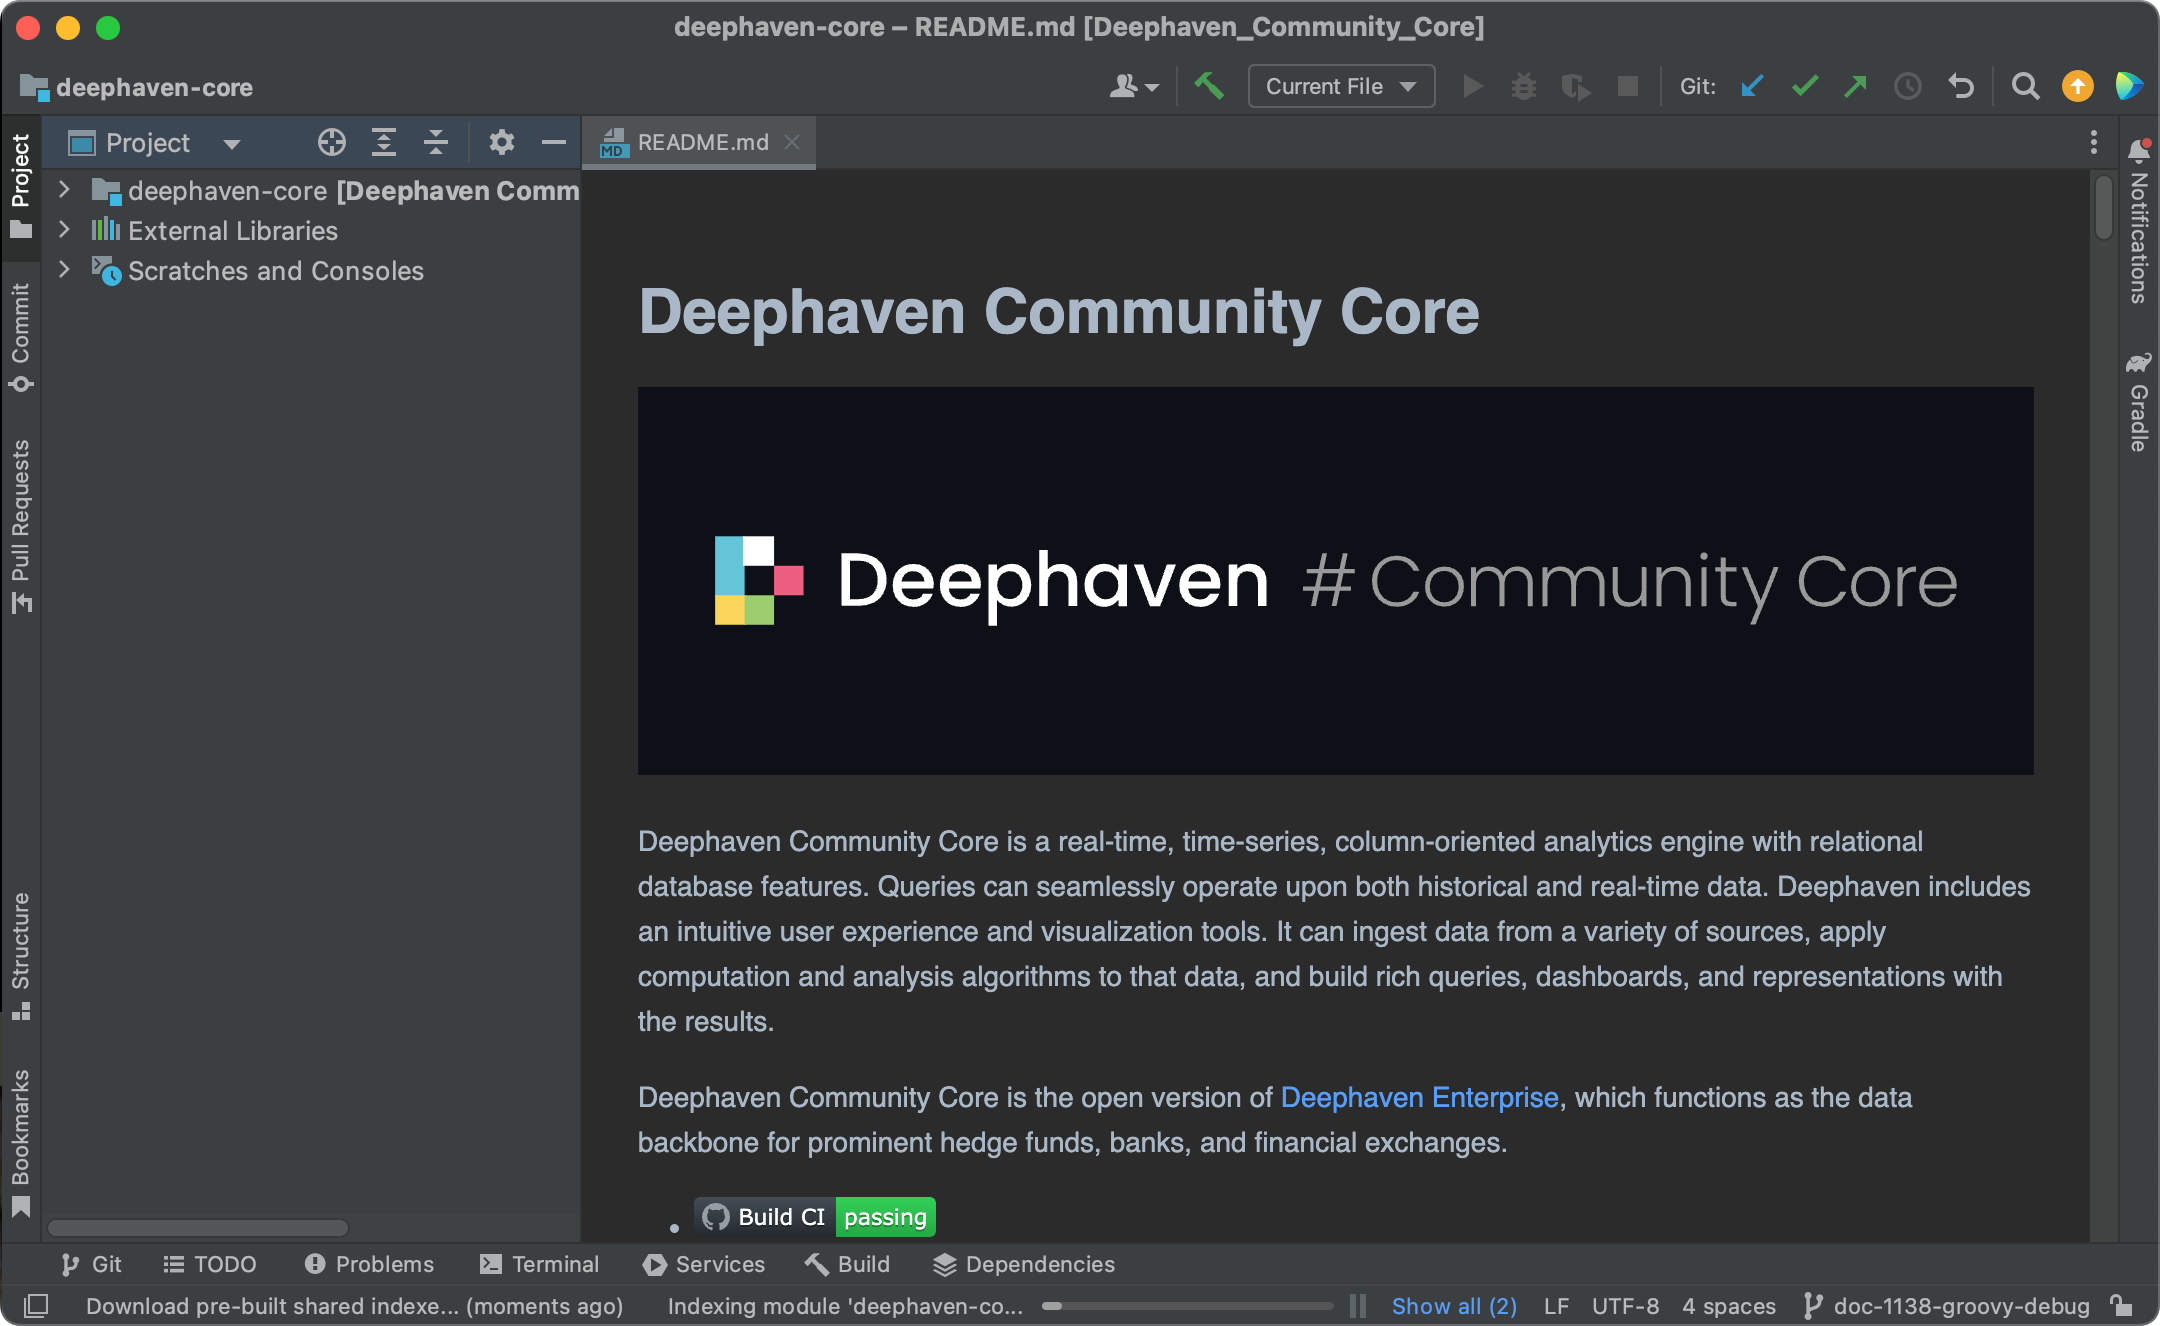
Open IntelliJ IDEA. From the welcome screen, click Open and navigate to your deephaven-core directory.
IntelliJ will import the Gradle project. This may take several minutes on first open as it resolves dependencies and indexes sources.
2. Create a remote debug configuration
Go to Run > Edit Configurations. Click + in the top-left corner and select Remote JVM Debug.
Give the configuration a name such as source-debug.
Set the following fields:
- Debugger mode: Attach to remote JVM
- Host:
localhost - Port:
5005
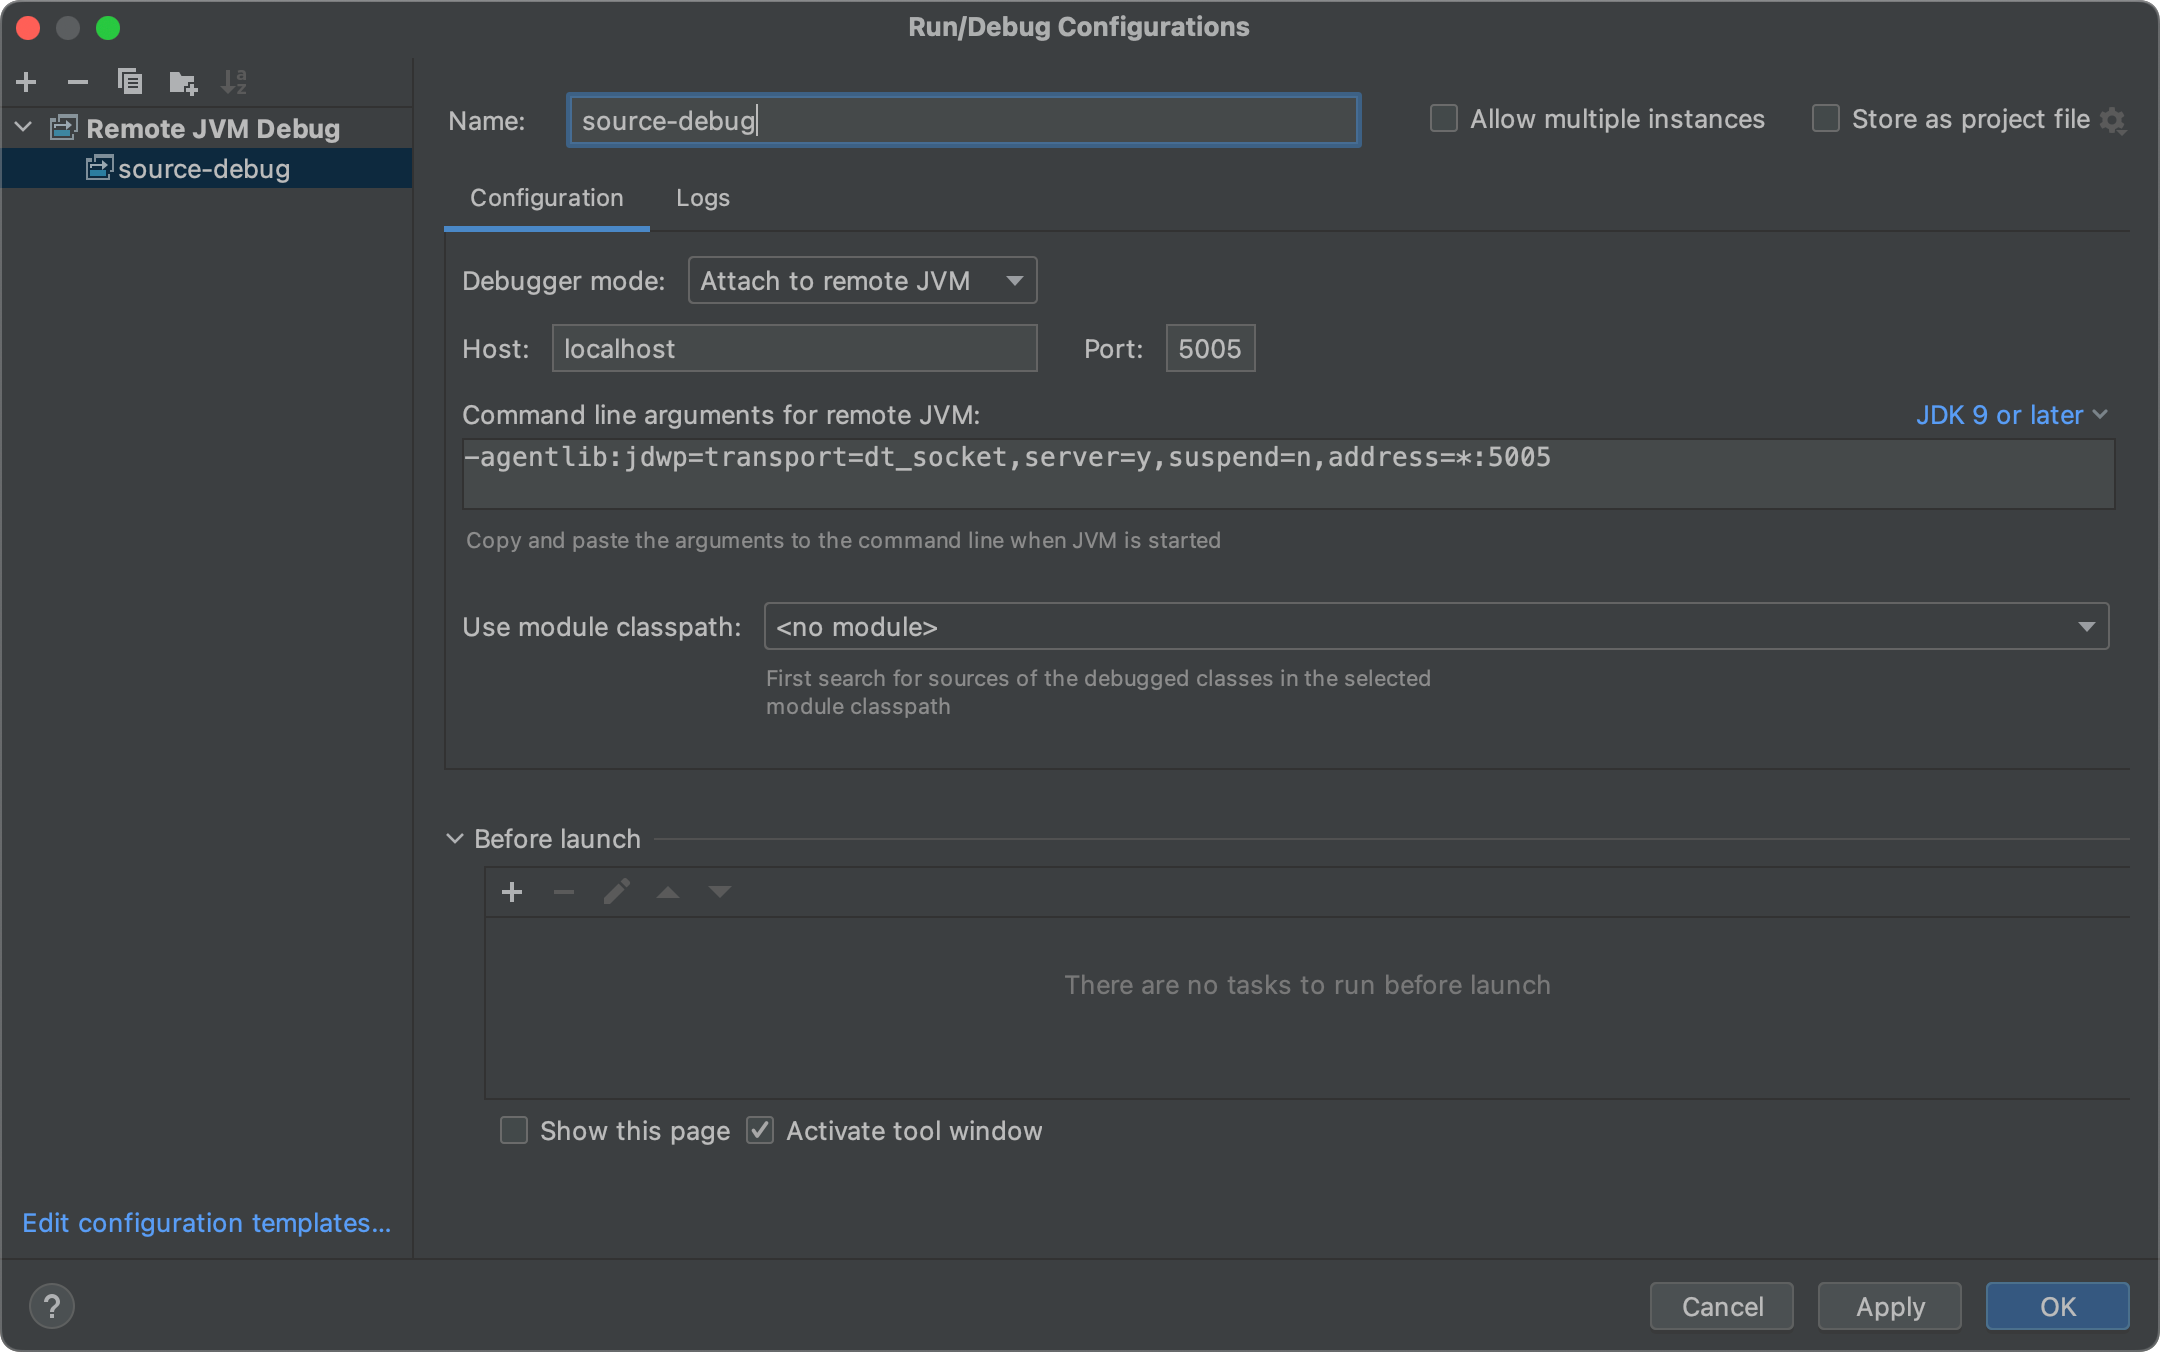
Click Apply and OK.
3. Start the server with debugging enabled
Warning
The Deephaven server must be run with anonymous authentication for this kind of debugging to work. The -Panonymous flag below enables it.
Open a terminal in the deephaven-core directory and run:
The -Pdebug flag instructs the Gradle build to start the JVM with JDWP enabled on port 5005. You can specify a different port with -Pdebug=<port>, for example -Pdebug=5006.
Note
The Gradle task will remain running and hold the terminal for as long as the server is up. This is expected — leave this terminal open and proceed to the next step in a separate terminal or window.
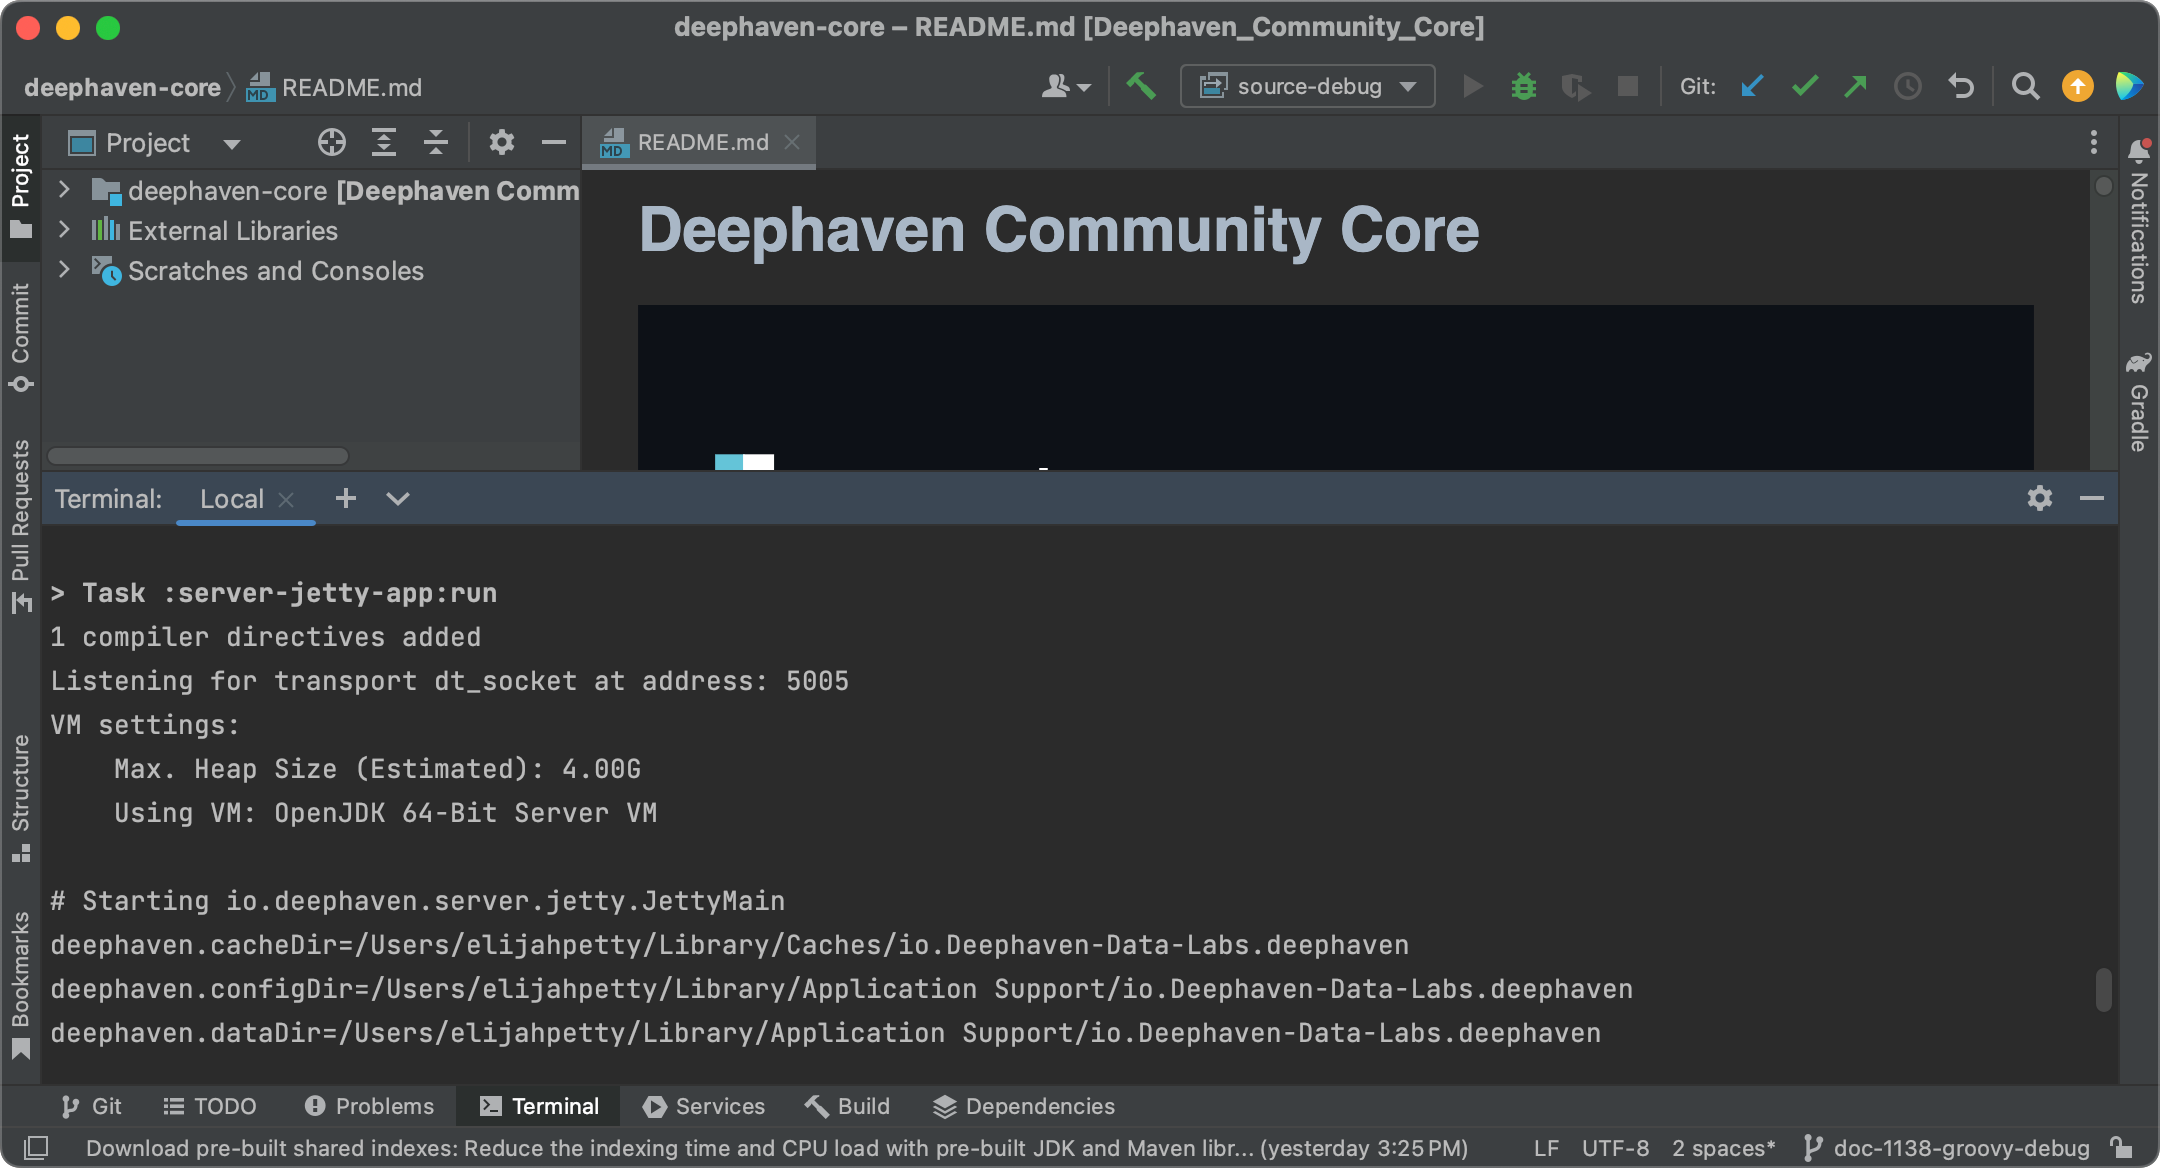
Wait for the server to finish starting. You should see output similar to:
4. Attach the debugger
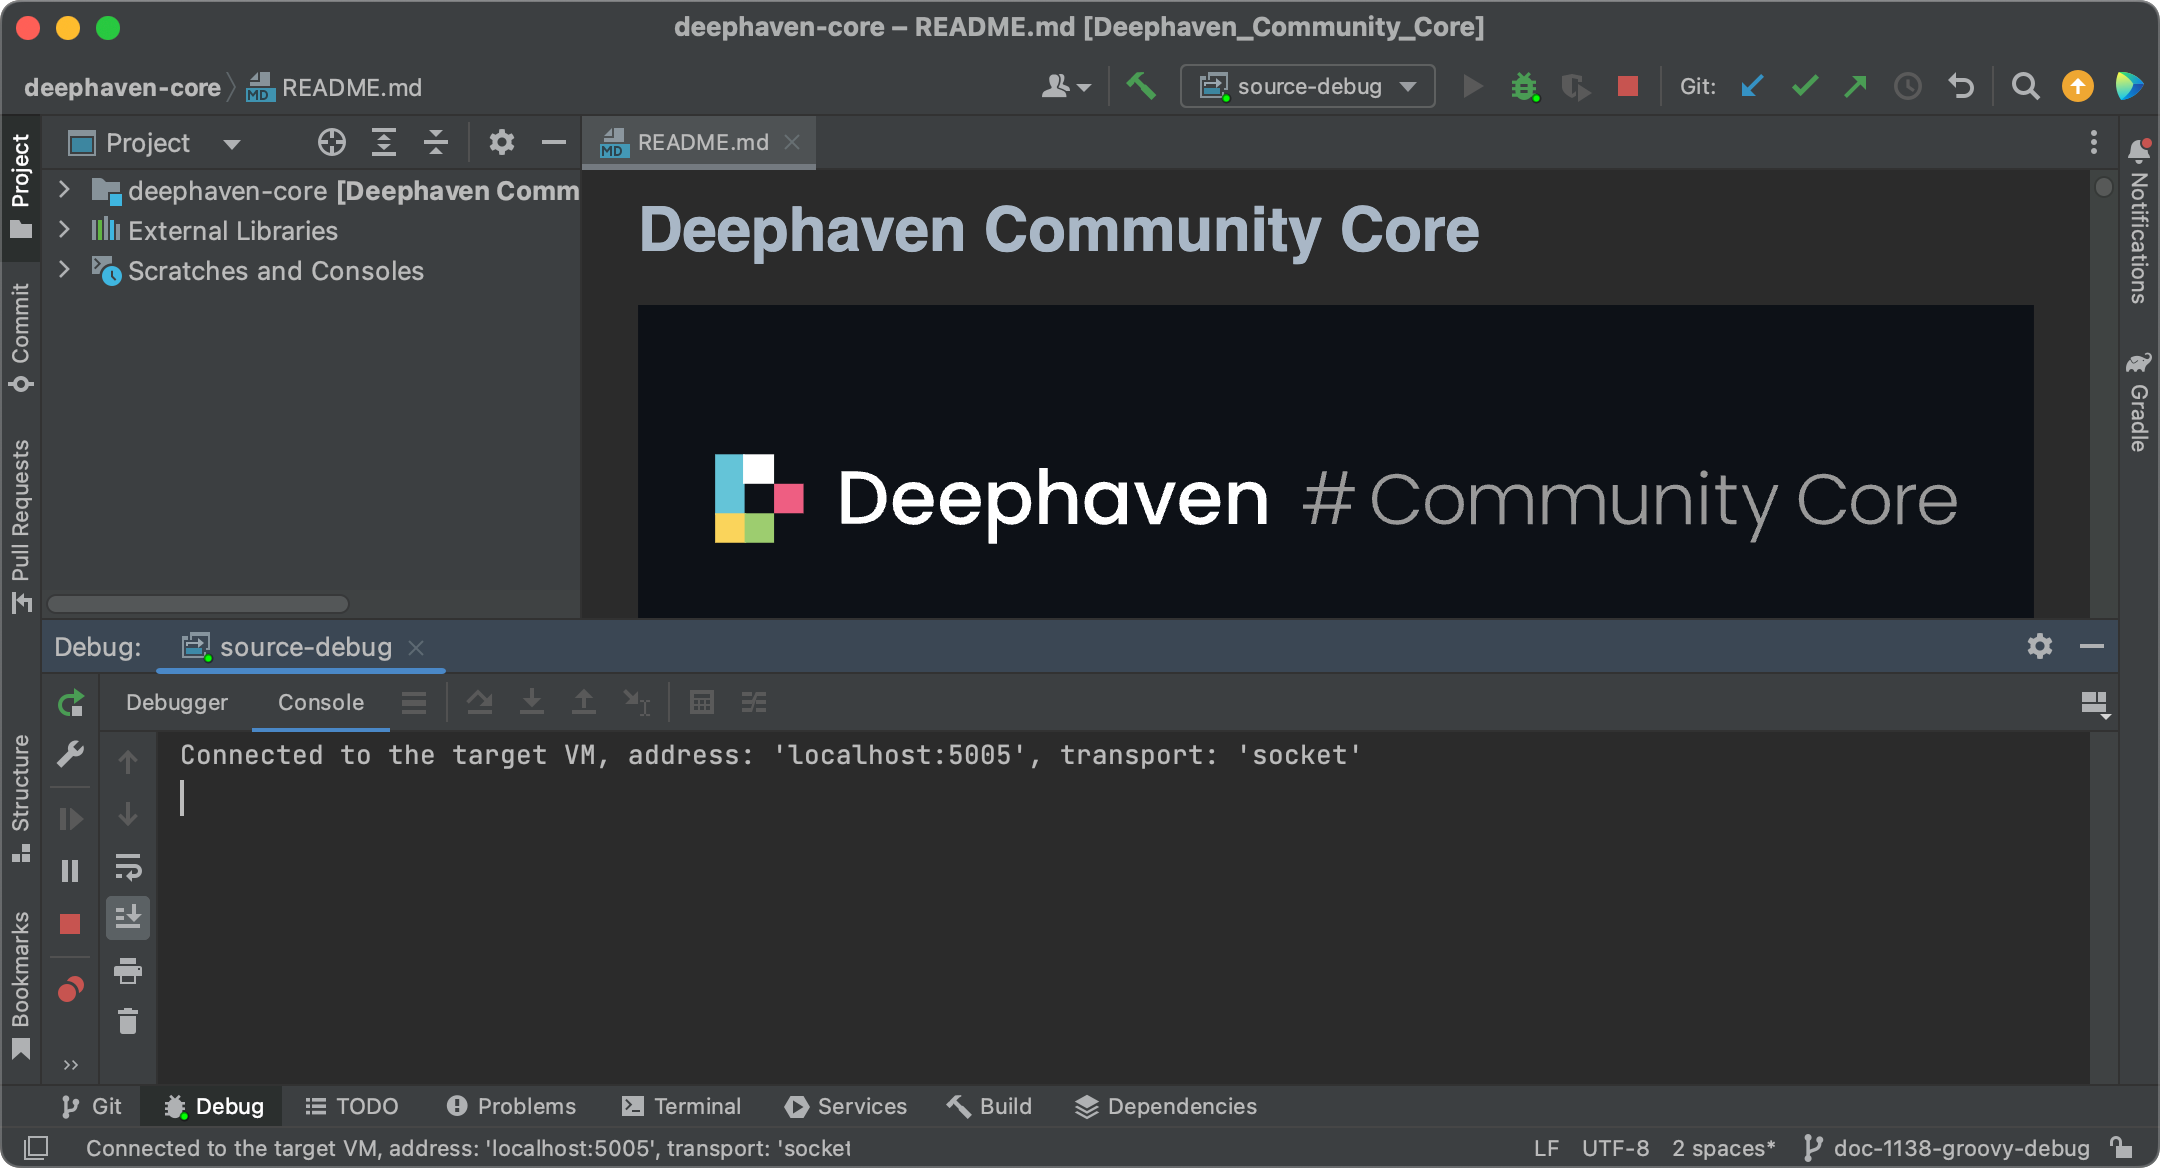
In IntelliJ IDEA, start the debug configuration by selecting Run > Debug 'source-debug', or click the bug icon in the toolbar.
IntelliJ will connect to the server on port 5005. The debugger status bar will confirm the connection.
5. Use the IntelliJ debugger
Set a breakpoint in any source file open in IntelliJ by clicking in the left margin. When the connected JVM executes a line that matches a breakpoint, it pauses and hands control to IntelliJ.
Breakpoints work for code whose source file IntelliJ knows about. There are two main workflows:
Debugging Deephaven's internals: Open any Java or Groovy source file from the deephaven-core project in IntelliJ and set a breakpoint on a line. Then run a command from the Deephaven web IDE console that exercises that code path. IntelliJ will pause when the JVM reaches that line, giving you full access to the call stack, local variables, and the ability to step through the code.
Debugging your own Groovy scripts: Code typed interactively into the Deephaven console is compiled dynamically at runtime and cannot be matched to a source file in IntelliJ. To set breakpoints in your own code, save it as a .groovy file on disk and configure the server to load it at startup (see application mode). IntelliJ can then match breakpoints in that file to the running JVM.
IntelliJ IDEA's debugger can step through Groovy and Java source, inspect variables, evaluate expressions, and navigate the call stack. JetBrains' debugging guide is a good starting point for general debugger usage.
Troubleshooting
Debugger won't connect
Problem: IntelliJ reports a connection error when starting the debug configuration.
Solutions:
- Verify the server started and shows the
Listening for transport dt_socket at address: 5005message. - Check that port 5005 is not blocked by a firewall.
- Ensure the port in the IntelliJ configuration matches the port used with
-Pdebug.
Gradle build fails
Problem: The ./gradlew server-jetty-app:run command fails with errors.
Solutions:
- Verify you successfully built Deephaven from source following the build guide.
- Check that you are running the Gradle command from the
deephaven-corerepository root. - Ensure all build dependencies are installed.
- Try cleaning and rebuilding:
./gradlew clean build.
IntelliJ can't find Deephaven source files
Problem: When stepping through code, IntelliJ shows "Source code not available" for Deephaven classes.
Solutions:
- Verify the IntelliJ project was opened from the same
deephaven-coredirectory used to build and run the server. - Wait for IntelliJ to finish indexing the project after first open (check the progress bar at the bottom).
- Ensure the Gradle sync completed without errors (View > Tool Windows > Gradle, then click the refresh icon).
Breakpoints are not hit
Problem: Execution runs through a breakpoint without pausing.
Solutions:
- Confirm the debugger is connected (check the IntelliJ status bar).
- If using
updateView, switch toselectto force eager evaluation. See Common problems.