Debug Docker-run Deephaven with IntelliJ IDEA
This guide shows you how to connect IntelliJ IDEA's remote debugger to Deephaven running in a Docker container.
When Deephaven runs in Docker, the engine and user code execute inside a Docker container. Debugging uses JDWP (Java Debug Wire Protocol), which is built into the JVM. You expose the debug port from the container and connect IntelliJ IDEA to it. To debug a Deephaven build you run from source instead, see the source debugging setup.
This setup lets you attach to the JVM and debug Deephaven's own Java code. Breakpoints in your own Groovy scripts do not fire, so trace them with println instead. See Trace your Groovy scripts with println.
You don't need a paid IntelliJ IDEA license for this. Remote JVM Debug is available in every edition of IntelliJ IDEA, including the free one. Before 2025.3, the free edition was IntelliJ IDEA Community Edition.
1. Configure Docker for debugging
The Deephaven Docker image passes the contents of the START_OPTS environment variable to the JVM as startup options. For more about START_OPTS, see Modify the deployment. To enable JDWP, make two changes to your docker-compose.yml:
- Expose the debug port (
5005) from the container. - Add the
-agentlib:jdwpJVM option toSTART_OPTS.
The following docker-compose.yml includes both changes. If you don't have one yet, create a directory with an empty data subdirectory and save this file in it.
The volumes entry mounts data at /data in the container. Keep your Application Mode scripts and data files there.
To debug Deephaven's own Java code, replace latest with a specific release tag, such as 42.7, so you know which source version to check out in step 2.
To see which version your local latest image is, run docker image inspect ghcr.io/deephaven/server-slim:latest --format '{{ index .Config.Labels "org.opencontainers.image.version" }}'. Run docker compose pull first if you want the current release.
The -agentlib:jdwp option sets these sub-options:
transport=dt_socket— the debugger connects to the JVM over a TCP socket.server=y— the JVM listens for debugger connections instead of connecting out to a debugger.suspend=n— the JVM starts immediately without waiting for a debugger to connect. Set toyto pause startup until a debugger attaches, which is useful for debugging initialization issues.address=*:5005— the JVM listens on port5005on all network interfaces. Inside Docker, the*:prefix lets the JVM accept connections from outside the container.
Warning
Anyone who can reach a JDWP port can run code in the JVM. The 127.0.0.1: prefix in the ports entry publishes port 5005 only on your own machine. Don't remove it, and don't enable JDWP on a server other people can reach.
Note
START_OPTS must appear only once in the environment section, but it can hold multiple JVM options.
Note
The -DAuthHandlers=io.deephaven.auth.AnonymousAuthenticationHandler setting above enables anonymous authentication, which lets any client connect without a password. With it enabled, you can open the Deephaven IDE without a pre-shared key. It is a convenience, not a requirement for the debugger.
The 127.0.0.1: prefix in the ports entry publishes port 10000 only on your own machine, so other computers on your network can't reach the server. Keep the 127.0.0.1: prefix while anonymous authentication is enabled.
2. Set up IntelliJ for remote debugging
To set breakpoints in Deephaven's Java code, IntelliJ needs the matching Deephaven source. Clone the deephaven-core repository, check out the tag for your image version (for example, git checkout v42.7 for server-slim:42.7), and open the clone as your IntelliJ project.
If you only need thread dumps and heap state, any project works. Skip to the debug configuration below.
Next, create the debug configuration: go to Run > Edit Configurations, click + in the top-left corner, and select Remote JVM Debug.
Give the configuration a name such as docker-debug.
Set the following fields:
- Debugger mode: Attach to remote JVM
- Host:
localhost - Port:
5005
Note
IntelliJ also displays a Command line arguments for remote JVM field. It shows the -agentlib:jdwp string that the target JVM needs. You already added this option to START_OPTS in step 1, so you don't need to copy it.
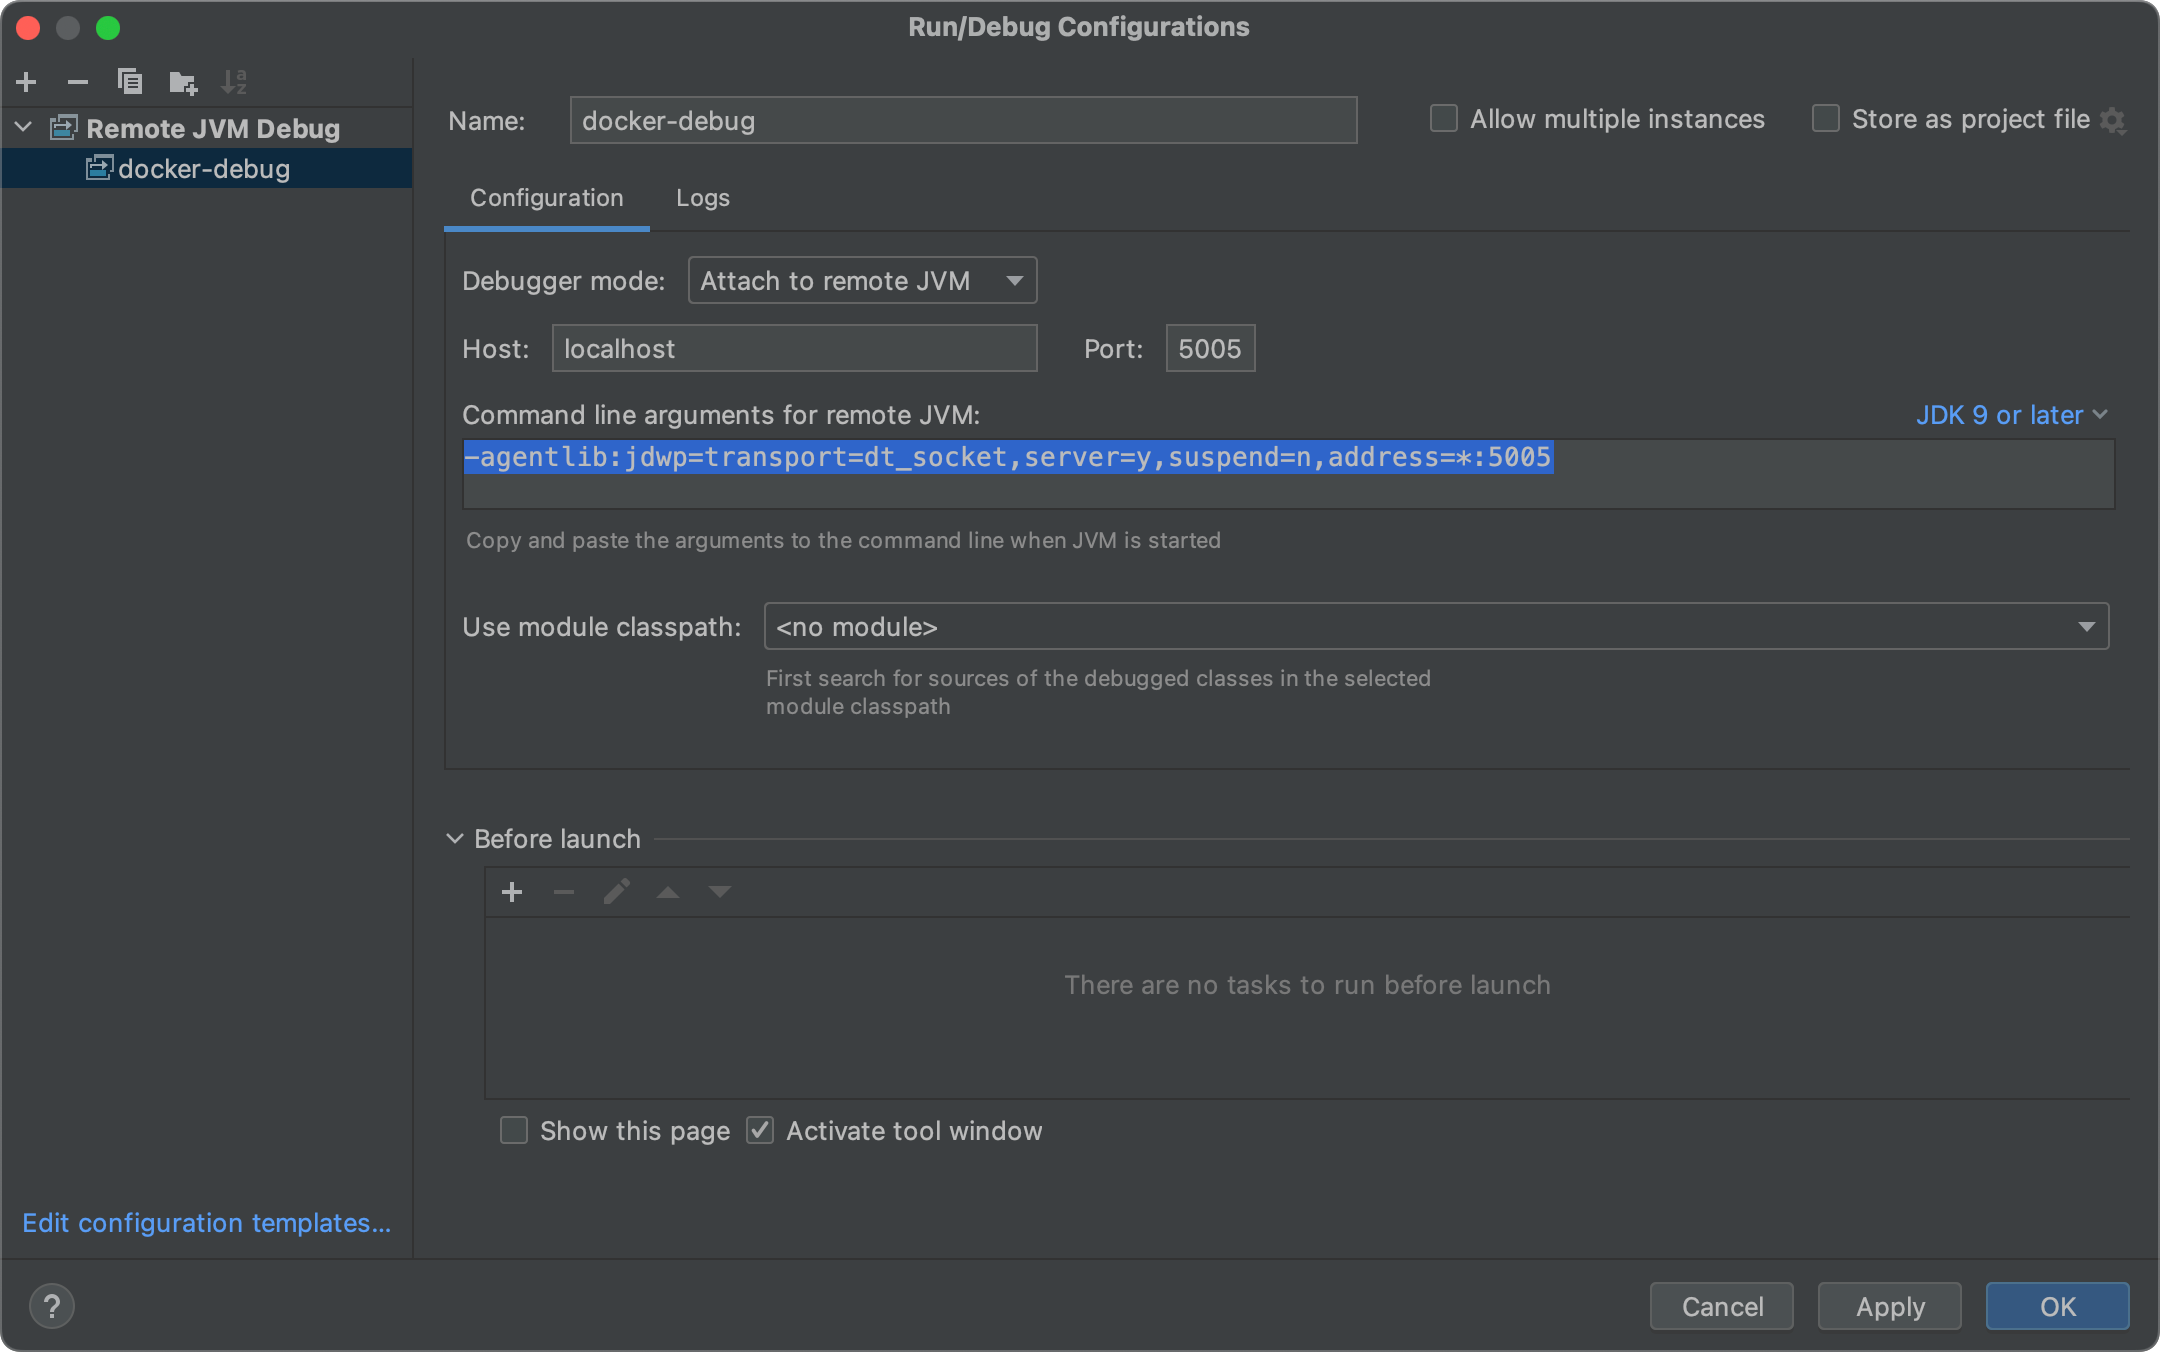
Click Apply and OK.
3. Start Deephaven
Start the Deephaven container from a terminal in the directory containing your docker-compose.yml:
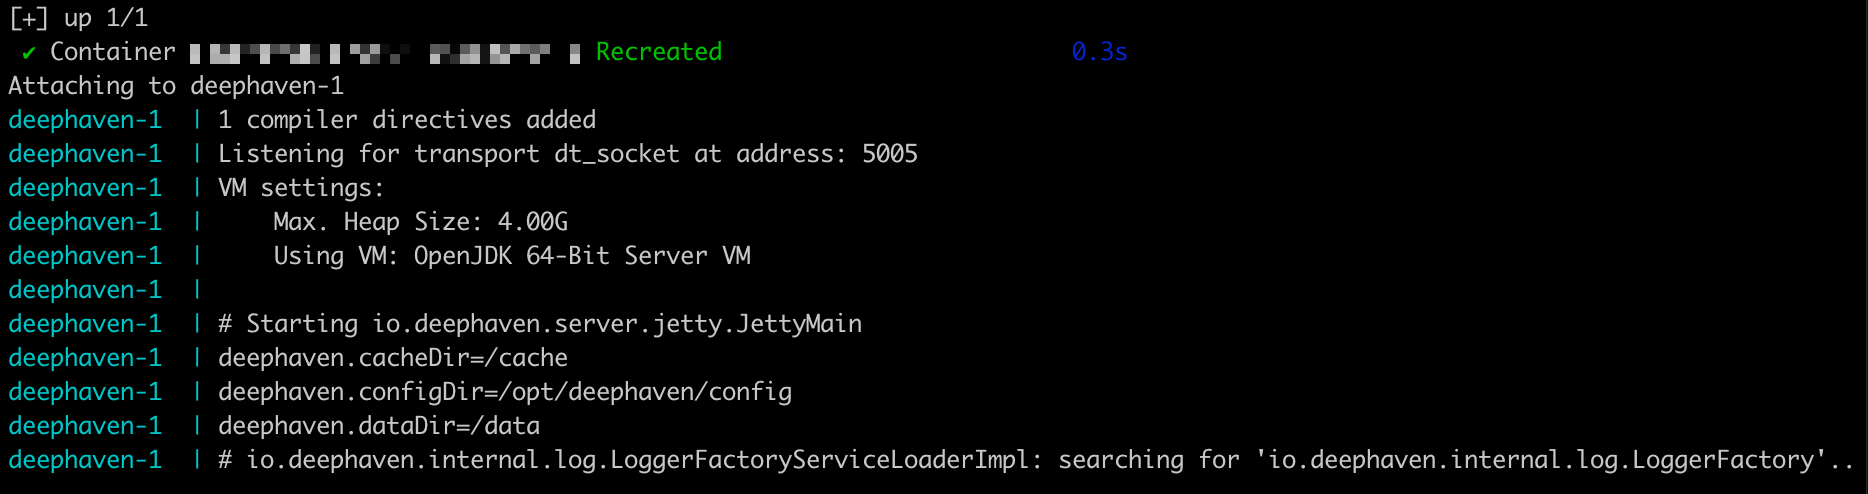
Early in the startup output, you should see:
This confirms the JVM is ready for a debugger connection. You can attach before the server finishes starting.
4. Attach the debugger
In IntelliJ IDEA, start the debug configuration by selecting Run > Debug 'docker-debug' or by clicking the bug icon in the toolbar.
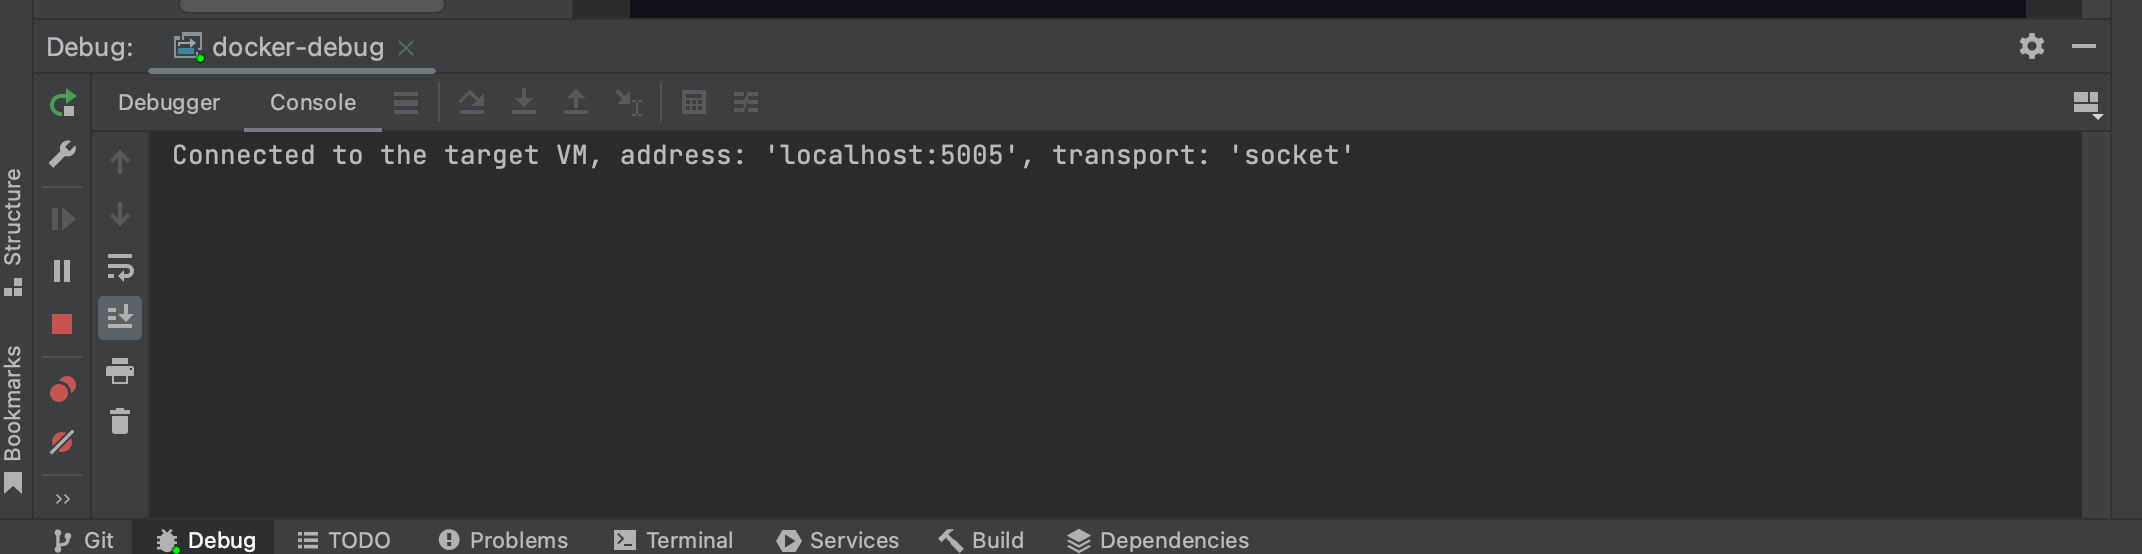
IntelliJ connects to port 5005, and the Debug tool window's console shows:
5. Use the IntelliJ debugger
Once connected, IntelliJ has access to the running JVM. You can inspect thread dumps and heap state, and set breakpoints in Deephaven's own compiled Java code. Breakpoints in Deephaven's Java code need the matching sources you opened as the project in step 2.
When a breakpoint in Deephaven's Java code fires, IntelliJ IDEA's debugger can step through the code and inspect variables. JetBrains' debugging guide is a good reference for general debugger usage.
Note
Breakpoints in user-defined Groovy scripts do not work, whether Deephaven runs in Docker or from source. Deephaven compiles Application Mode scripts and console code dynamically, and the compiled code doesn't match your source file in two ways:
- Deephaven prepends a
package io.deephaven.dynamic;declaration, which shifts every line number by one. - The compiled class gets a generated name. An Application Mode script's class name comes from its file path, and console code compiles to a numbered class such as
Script_1.
IntelliJ cannot map the compiled code back to your .groovy files, so breakpoints set in them are never hit.
For the generated class names in detail and a worked example, see Breakpoints in Groovy scripts are not hit.
Trace your Groovy scripts with println
IntelliJ can't stop at breakpoints in your own Groovy scripts, as the note in step 5 explains, so trace their logic with println statements instead. This needs only the running container from step 3, not the IntelliJ debugger.
The println output appears in the container logs and in the Log panel of the Deephaven IDE.
Here is an example that traces calls through a function. Run it in the console of the Deephaven IDE at http://localhost:10000/ide/ (replace 10000 with your DEEPHAVEN_PORT value if you set one):
select calls addOne right away for every row, so the trace appears as soon as the code runs. updateView would defer the calls. See Lazy evaluation of some table operations.
Follow the output while the container runs:
The log shows each call:
Troubleshooting
Debugger won't connect
Problem: IntelliJ reports a connection error when starting the debug configuration.
Solutions:
- Verify the Deephaven container is running and shows the
Listening for transport dt_socketmessage. - Check that your
docker-compose.ymlexposes port5005and that no firewall blocks it. - Ensure the port in the IntelliJ configuration matches the port in
START_OPTS.
Breakpoints are not hit
Problem: Execution runs through a breakpoint without pausing.
Cause: The breakpoint is in one of two places:
- A user-defined Groovy script, either an Application Mode script or console code. These breakpoints never fire. The note in step 5 explains why, and Breakpoints in Groovy scripts are not hit has more detail.
- Deephaven's Java code, when the sources IntelliJ has open don't match the server version.
Solutions:
- Use
printlnstatements to trace execution, as shown in Trace your Groovy scripts withprintln. Output appears indocker compose logs -fand in the IDE's Log panel. - If you set breakpoints in Deephaven's own Java code, open a deephaven-core clone checked out at the tag for your image version (for example,
v42.7forserver-slim:42.7), as described in step 2. IntelliJ needs these sources to match the server version.
Debugger disconnects after attaching
Problem: The debugger connects but the connection immediately drops.
Solutions:
- Check the IntelliJ debug console for error messages indicating the cause.
- Try increasing JVM memory if you see out-of-memory errors. The
-Xmx4goption in theSTART_OPTSenvironment variable ofdocker-compose.ymlsets the maximum heap size. See Add more memory.