Navigate the GUI
The Deephaven graphical user interface (GUI) runs in your web browser. It lets you explore, filter, sort, and plot your tables without writing more code. Real-time tables update on screen as new data arrives. This guide shows where to find the GUI's main panels, menus, and tools. Let's take a tour.
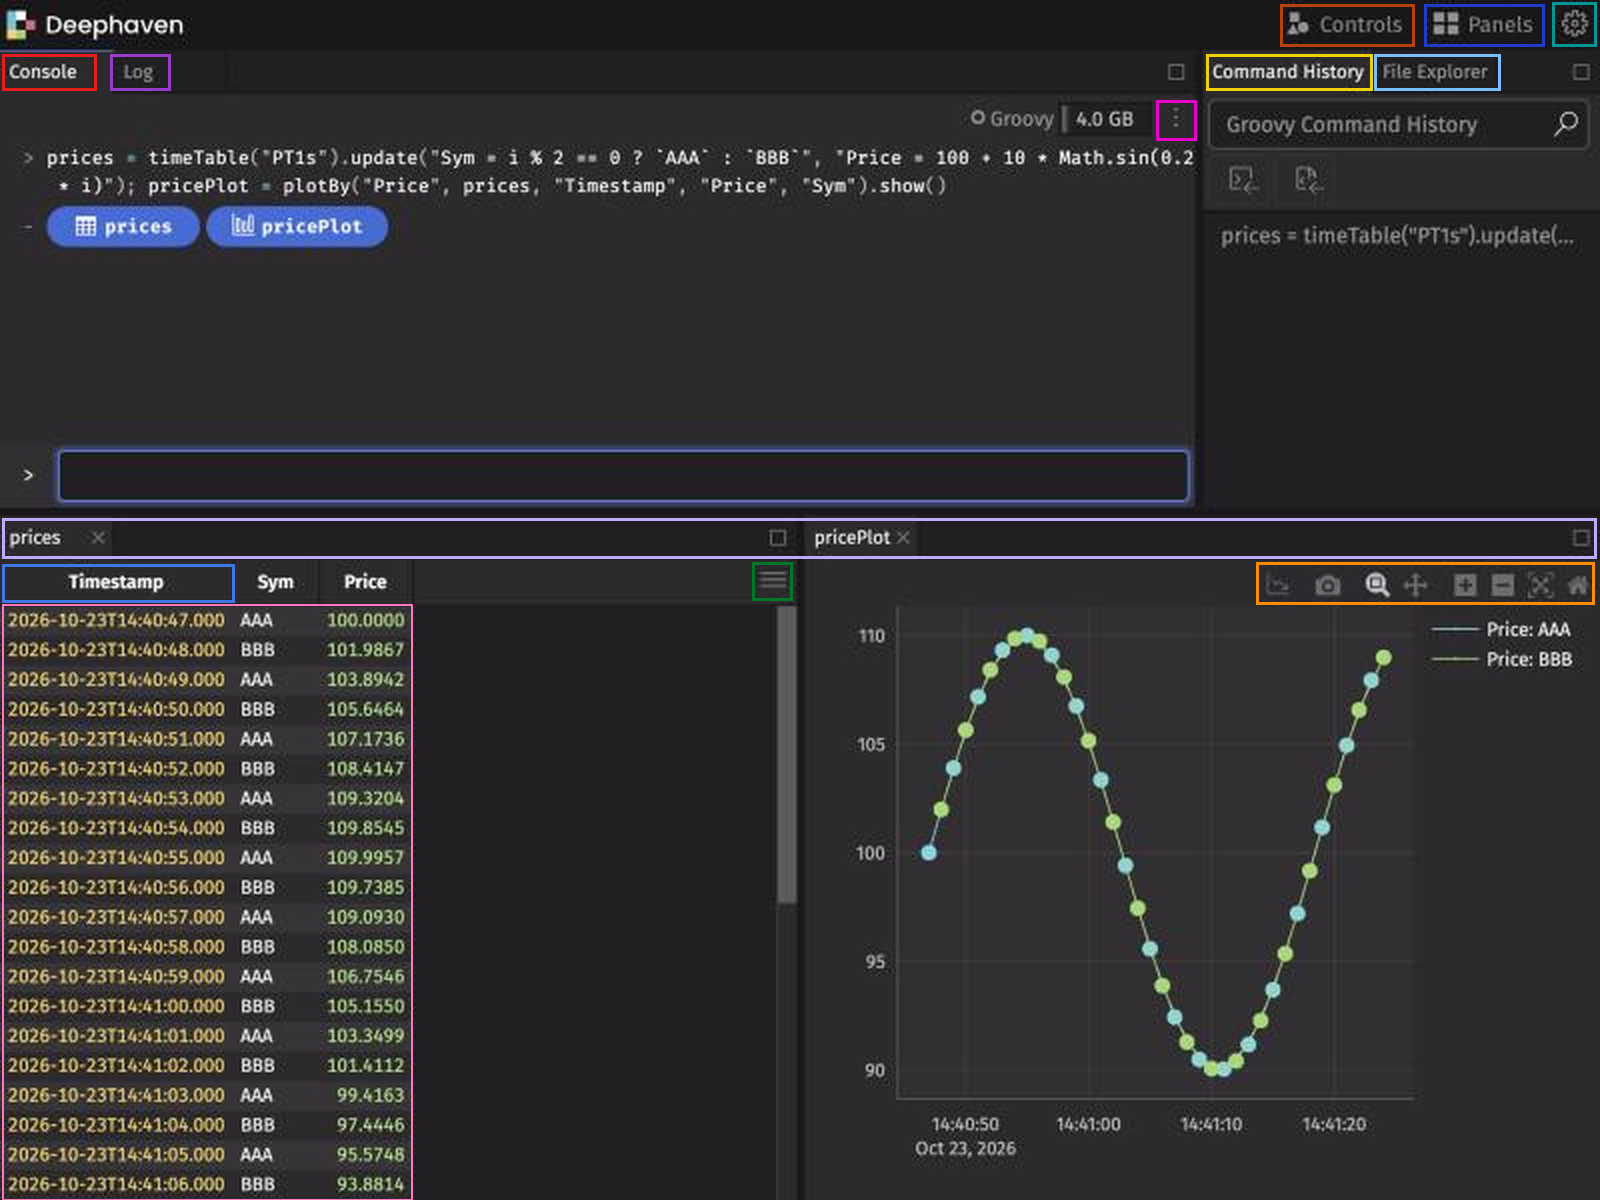
The screenshot below outlines most of the items, each in a different color. The legend after it follows the screen layout: the top bar, the console pane, the right-hand pane, and the viewing area. Each entry says where to find the item and gives its outline color when the screenshot outlines it.
Legend
Top bar
- Controls menu (rust outline, top right): Add and remove filters, create widgets such as Markdown widgets, and open the Linker tool.
- Panels menu (dark blue outline, right of Controls): Search for and open the tables, plots, and widgets in your session, and import, export, or reset your layout.
- Settings menu (teal outline, gear icon at the far right, tooltip User Settings): Change your settings, such as the time zone, number formats, how tables display empty and null strings, table density, and the theme. Your browser stores these settings.
Console pane
- Console (red outline, first tab on the left): Type and run code here. You do most of your work in this panel.
- Log (purple outline, tab next to Console): View recent server log output. The panel shows the most recent log messages when you open it, then new messages as they arrive.
- Console Options menu (magenta outline, ⋮ icon at the right end of the console toolbar, tooltip More Actions...): Change the console's behavior or upload a table from a file. Behavior options include whether panels open automatically and whether they close when the connection drops.
Right-hand pane
- File Explorer (light blue outline, a tab in the right-hand pane): Create, open, copy, rename, move, and delete the notebooks and folders stored on your Deephaven server. See Create and organize notebooks.
- Command History (yellow outline, the other tab in the right-hand pane): View a history of the commands you've run in the console.
Viewing area
The viewing area, also called the workspace, sits below the console and right-hand panes in the default layout. It shows the notebooks, tables, plots, and widgets you open.
You can rearrange any panel, not just the ones in the viewing area. Drag a panel's tab to move it. Drop it beside another panel to split the space, or on another panel's row of tabs to stack the two.
- Panel tabs (lavender outline, the row of tabs at the top of the viewing area): Switch between the notebooks, tables, plots, and other widgets open in the viewing area.
- Cell context menu (pink outline, around the table cells): Right-click a cell in a table to open the cell context menu, which has options to copy data, filter, and more.
- Column header menu (medium blue outline, around a column header): Right-click a column header to open the column header menu, which has options to freeze, filter, sort, and more.
- Table Options menu (dark green outline, hamburger icon at the top right of a table, tooltip Table Options): Click the hamburger icon to open the Table Options menu. Use it to organize columns, apply conditional formatting, or aggregate columns. The menu also lets you download a CSV of the table data, among other tools.
- Plot hover menu (orange outline, across the top of a plot): Hover over a plot to reveal the plot hover menu, which has options to save the plot as an image, zoom in and out, and more.