Unexpected results
Unexpected results occur when Deephaven queries execute successfully but produce output that differs from what you anticipated. These issues can manifest as missing data, incorrect calculations, unexpected null values, or filtered results that don't match your intended criteria.
Debugging data issues is critical for ensuring the accuracy and reliability of your analytics. Even when queries don't throw errors, incorrect results can lead to flawed analysis and decision-making if not properly investigated and resolved.
Debugging strategies
Breaking down complex queries
The Deephaven query engine's composable nature provides an effective approach for troubleshooting unexpected results. By breaking complex queries into smaller operations and assigning intermediate results to variables, you can systematically identify exactly where your data transforms in unexpected ways.
Visualizing intermediate results
After breaking down a complex query into smaller operations, examine each intermediate result to pinpoint where the data diverges from your expectations. This isolation technique helps you identify the specific operation causing the issue.
Verifying data assumptions
Many unexpected results stem from incorrect assumptions about the underlying data. Always verify your expectations about data completeness, column types, and value ranges when troubleshooting results.
Common types of unexpected results
Missing or null values
Unexpected null values often appear when joined tables don't contain matching records or when data sources are incomplete. Consider this example that attempts to show the in-use heap for each Persistent Query (PQ) at a specific timestamp:
Step 1: Initial query that produces unexpected null values
This produces the following table in a Code Studio:
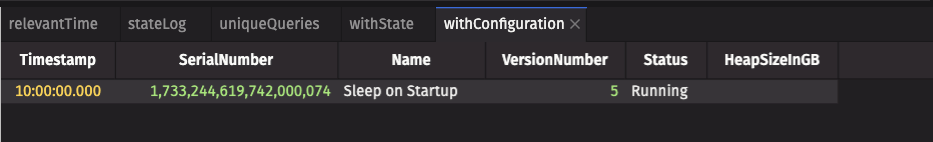
Step 2: Identifying the problem
Notice that the HeapSizeInGB column contains a null value for a running query. We expect that every running query has a heap size.
Step 3: Breaking down the query
To debug this issue, we break the query into constituent operations to find the first operation that does not contain our expected data. Here is an equivalent query that splits out the PersistentQueryConfigurationLogV2 into a separately named variable called config_log:
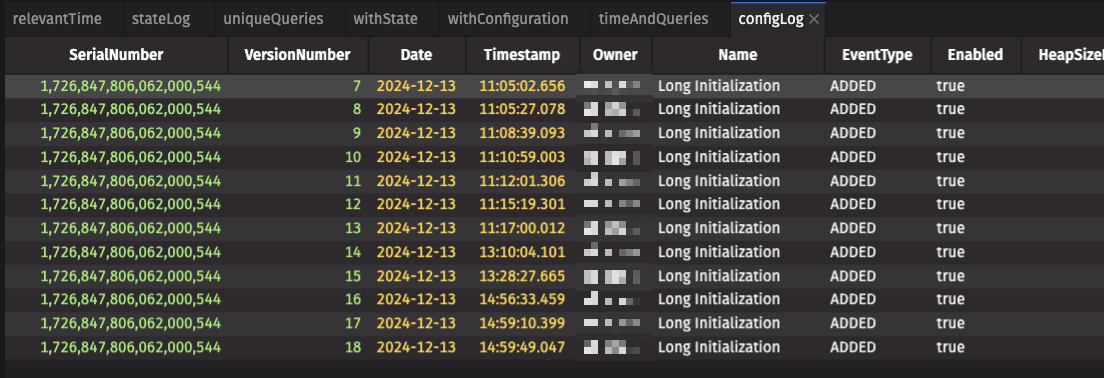
Step 4: Analyzing intermediate results
From this table, we can see that "Sleep on Startup" is not present, so the error is that config_log does not have the desired data. There is no filter for the table, but only data for today's date is present.
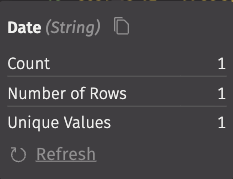
Step 5: Using UI tools to verify data assumptions
The easiest way to see that there is only one value is to hover over the Date column header in the UI to display the statistics, which confirms there is only one unique value:
Step 6: Understanding the root cause
The live_table method we used for retrieving the DbInternal.PersistentQueryConfigurationLogV2 table only contains data served by the Data Import Server, not data that has been merged to historical storage.
Step 7: Implementing the solution
If we combine the historical configuration data with live data, then we achieve the desired result:
Step 8: Verifying the solution
Rerunning the query with the historical data included results in a value for our heap size.

Summary
When debugging unexpected results in Deephaven:
- Break complex queries into smaller components with assigned variables.
- Examine intermediate results at each step.
- Verify data types, formats, and completeness.
- Consider whether the issue is with your expectations rather than the data.
- Check for historical data when working with time-based tables.