Query Monitor
The Query Monitor manages and creates Persistent Queries (PQs) on the web. PQs operate just like console-based queries. However, PQs are created, saved, and run on regular schedules, thereby enabling the automation of repetitive and/or timed operations. Also, PQs can be shared with other individuals or teams.
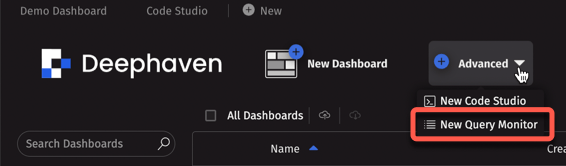
To open a Query Monitor, click the New button to access the Advanced menu, then select New Query Monitor:
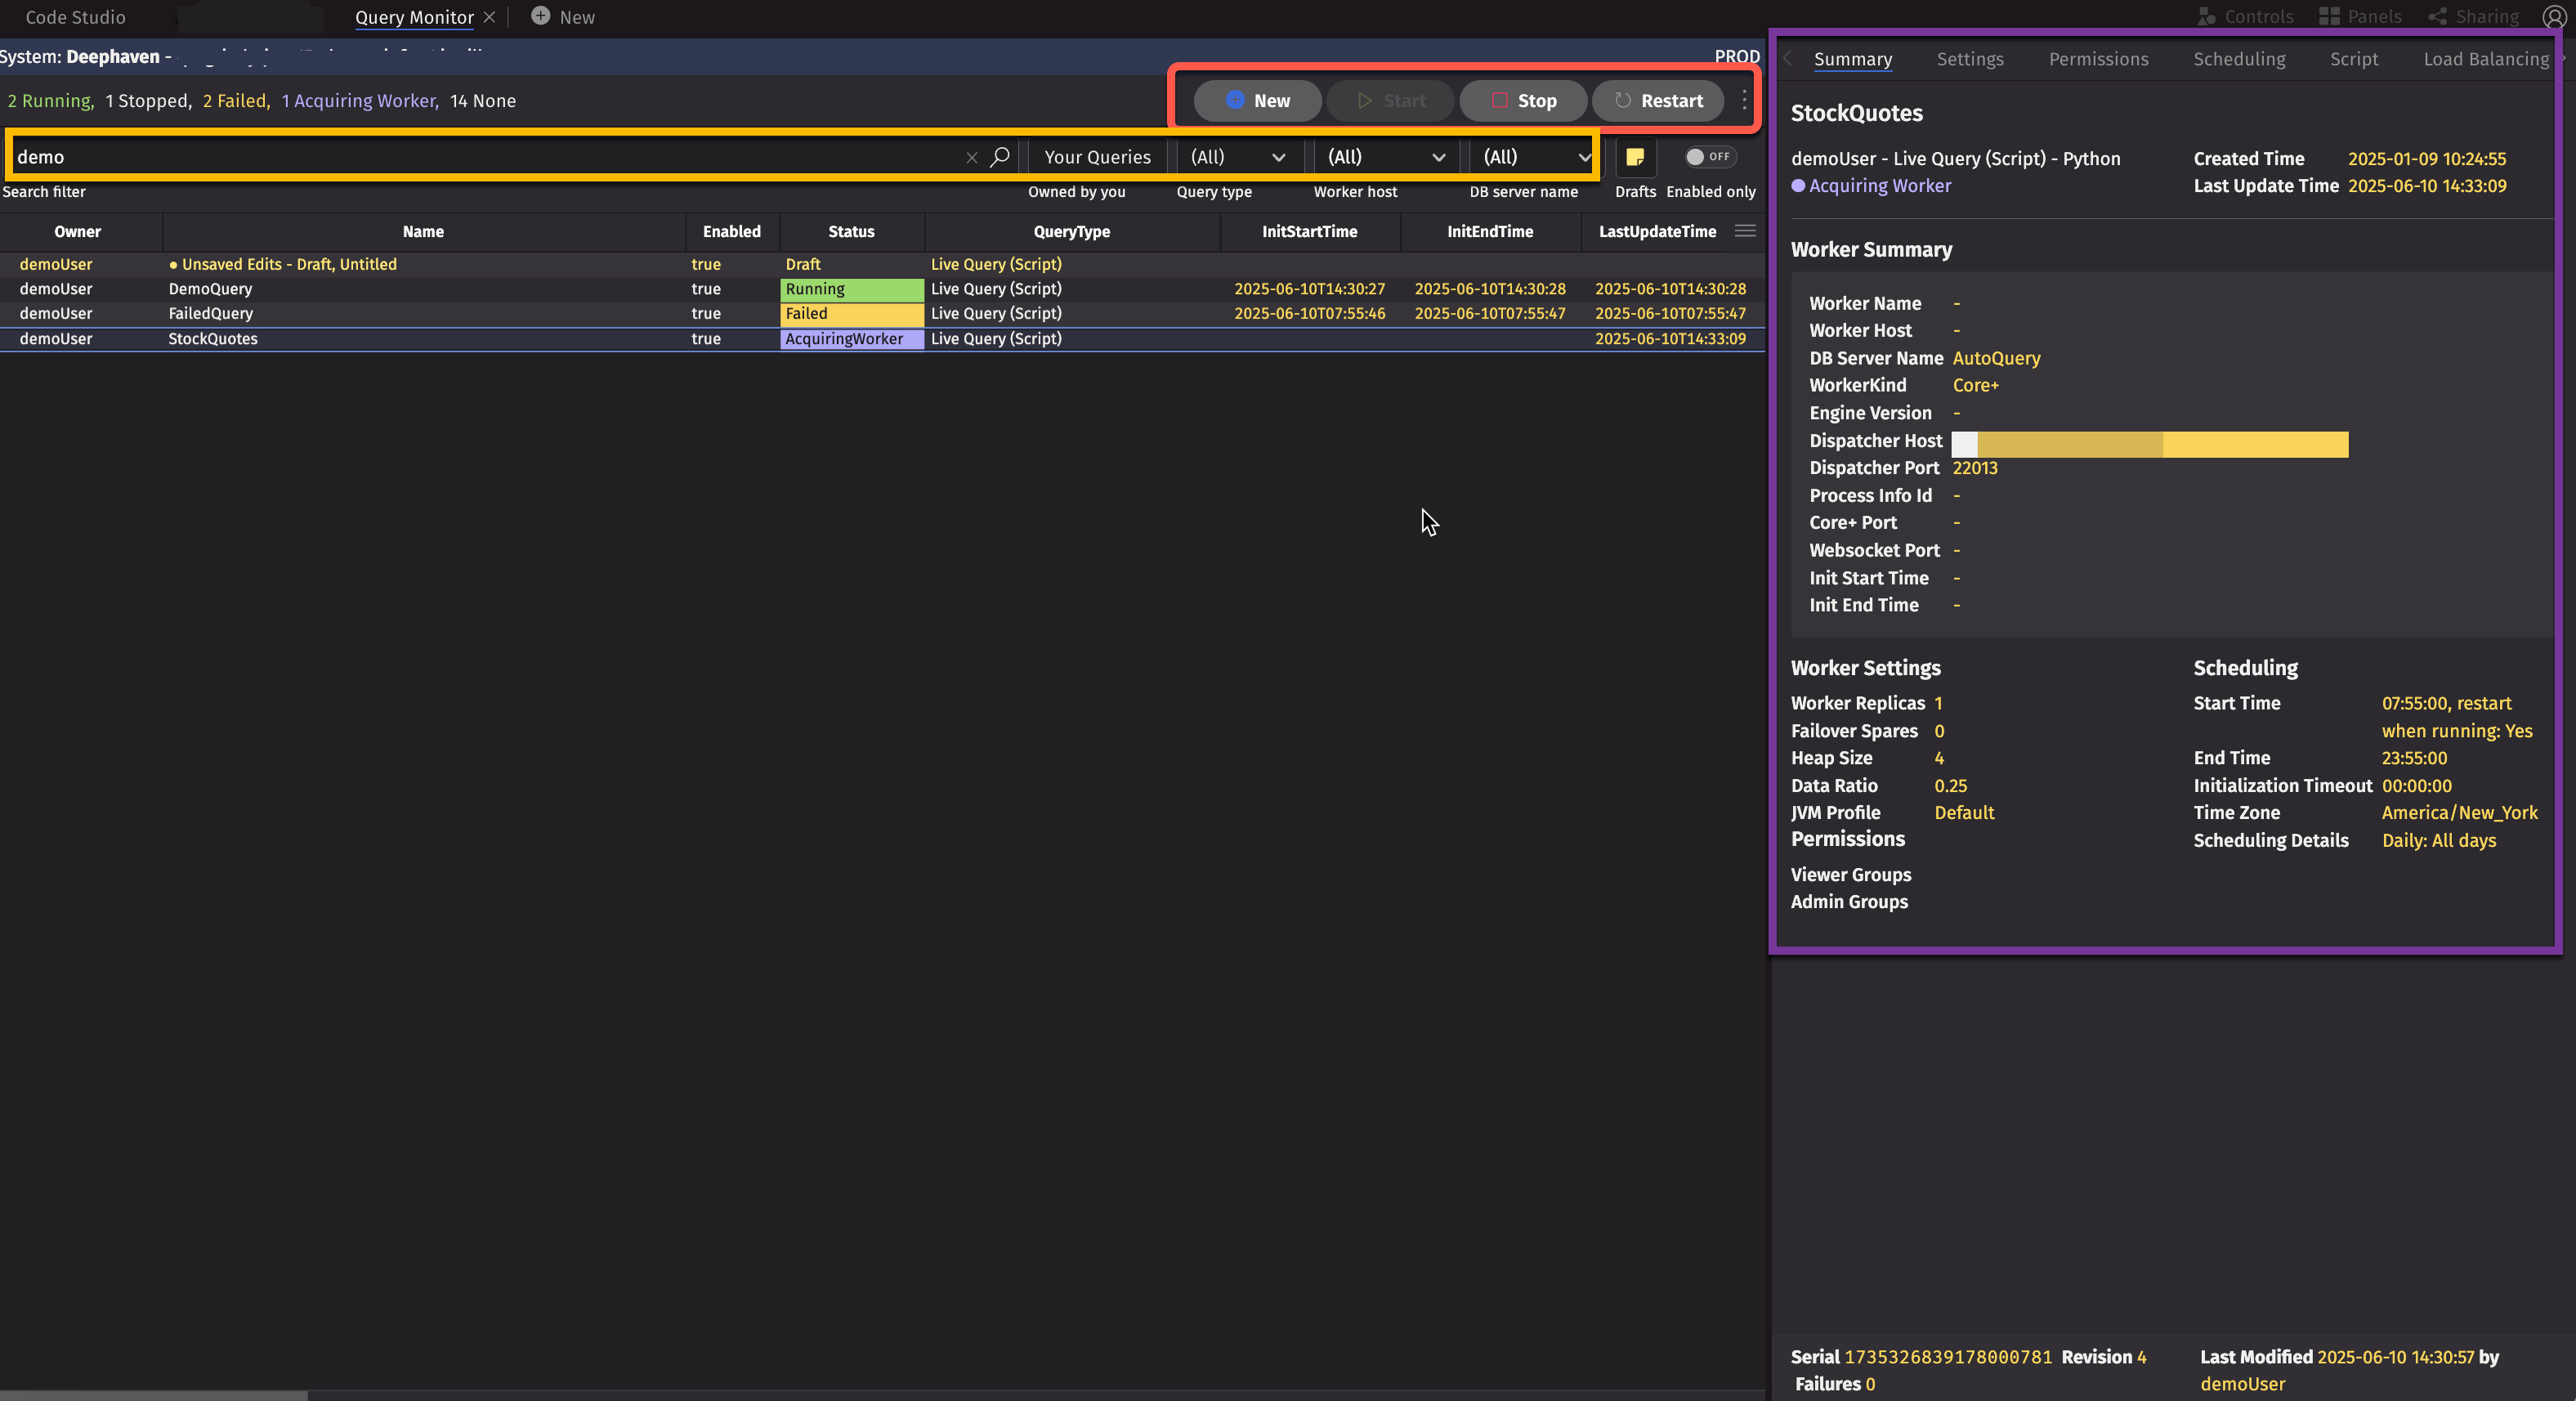
- The main feature of the Query Monitor is its central table. This table lists key details for each Persistent Query (PQ) you're authorized to view, such as its name, owner, and status.
- You can efficiently navigate this list using built-in search and filtering capabilities, highlighted in yellow in the image below.
- Above the table, control buttons, shown in red, allow you to create new PQs, or start, stop, and restart existing ones.
- When you select a query from the table, a dedicated panel, outlined in purple on the right, appears. This panel shows a summary of the selected query and provides tabs to view its underlying script and adjust various configuration settings.
For more information on creating and managing PQs, see UI Query Management.
Attach a Code Studio
Right-click a running Core+ query and select Attach Code Studio... to open a console on that query's existing worker. The console runs in the query's own scope, so its tables, plots, and widgets are available immediately.
The option only appears for running Core+ queries that you have permission to attach to, and an attached console shares the query's scope. See Attach to a Persistent Query for requirements, permissions, and the risks of working in a shared scope.
Table columns
Column descriptions
The central table shows the following columns by default. Right-click a column header to show additional columns.
| Column | Description |
|---|---|
Owner | The owner of the Persistent Query. |
Name | The name of the Persistent Query. |
Enabled | Whether the query is allowed to run at all. A disabled query does not start on its schedule, and cannot be started or restarted manually. |
Status | The query's current state, such as Running, Stopped, or Failed. See Query states for the full list of possible values. A new query that hasn't been saved yet shows Draft. |
QueryType | The type of the Persistent Query, such as Live Query (Script) or Batch Query (RunAndDone). See Types of PQs for details. |
InitStartTime | The timestamp at which the worker began initializing. |
InitEndTime | The timestamp at which the worker finished initializing. |
LastUpdateTime | The timestamp of the most recent update the controller processed for the worker. This isn't limited to Status transitions — progress and exported-object updates refresh it too — and it corresponds to the timestamp of the most recent entry for the worker in the PersistentQueryStateLog internal table. |
InitStartTime, InitEndTime, and LastUpdateTime are per-worker values. For a query with more than one replica or spare, these are blank on the query's own row; expand the row to see each replica's or spare's values. Status still shows a summary on the query's own row: the shared status if all replicas and spares agree, or a comma-separated list of each one's status if they differ.
Additional columns, including WorkerHost, EngineVersion, HeapSize, and SchedulingDetails, are hidden by default but can be added to the table by right-clicking a column header. The detail panel that appears when you select a query, as well as its Settings and Scheduling tabs, surface the same information without needing to customize the table's columns.