Create new tabs
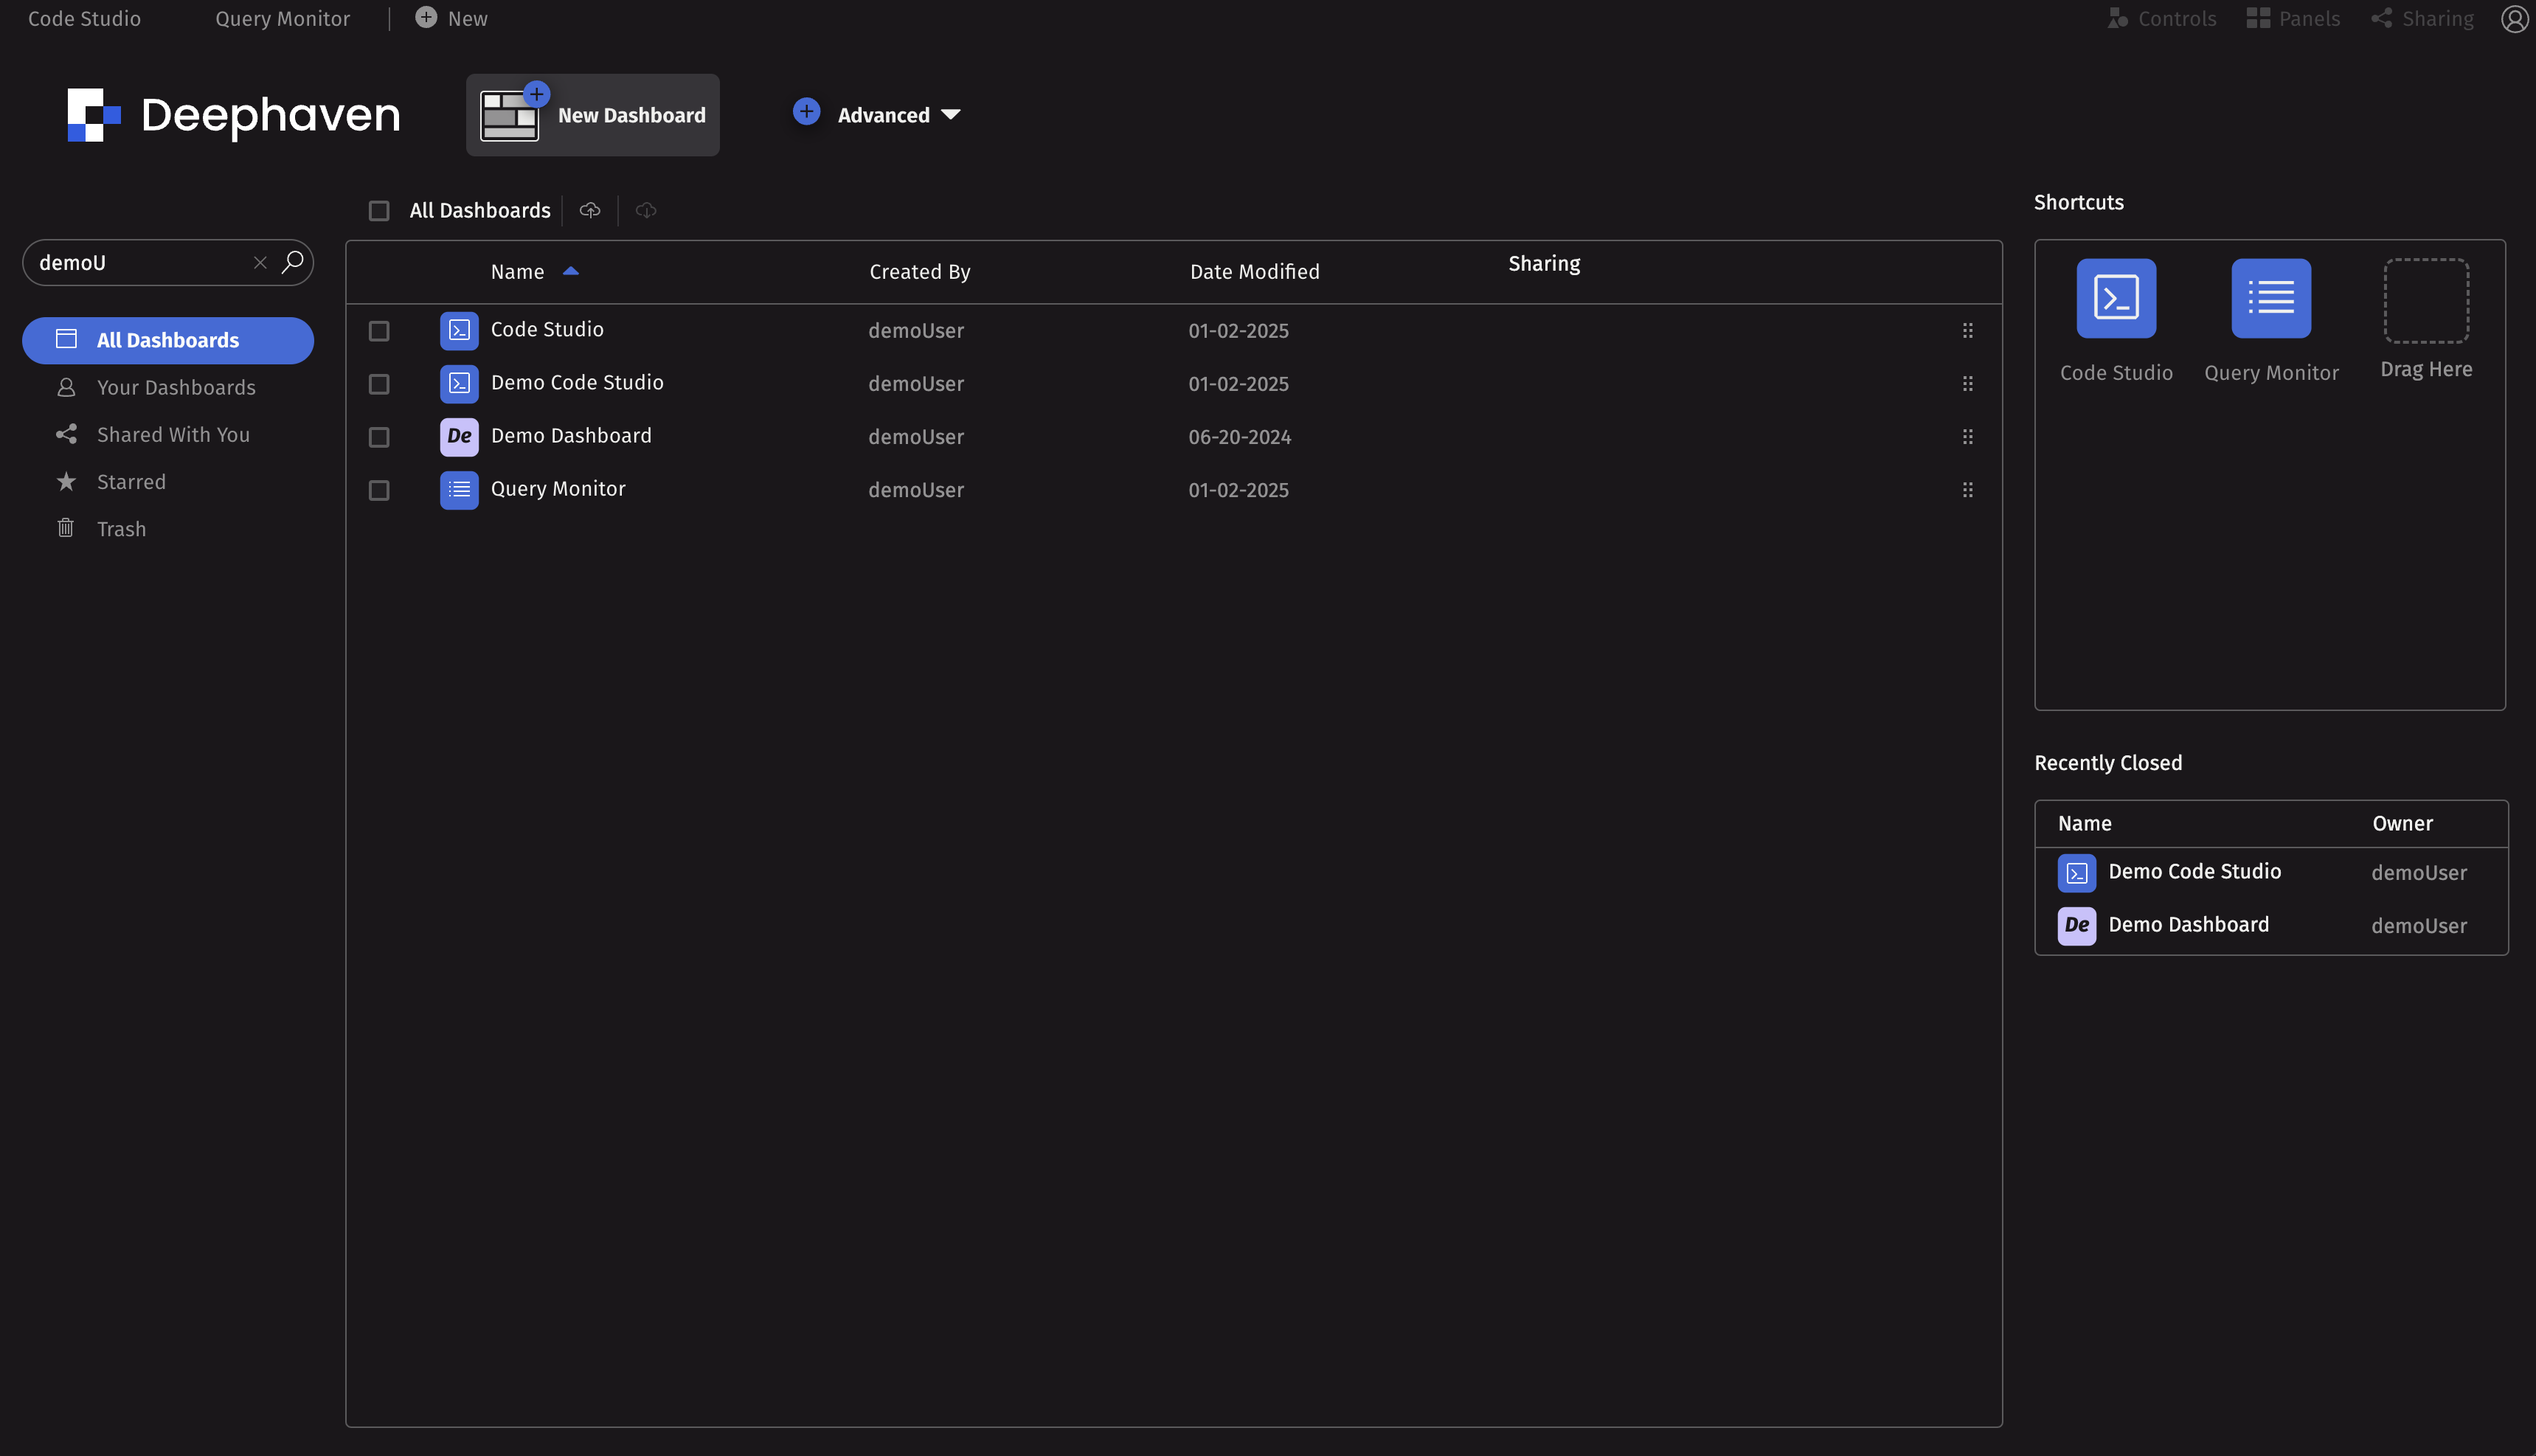
Click the New+ button in the navigation bar to open the new tab screen. Here, you'll find options to create new Dashboards, and under Advanced, new Code Studios and Query Monitors. You can also access any saved workspaces or Query Monitors from here.
Search
Use the field on the left to search for existing workspaces or Query Monitors, and the following options to alter your primary view:
- Search Dashboards - To search for an existing Dashboard, Code Studio or Query Monitor, or the name of the owner, simply type the characters into the Search Dashboard field. As you type, a list of matching results will appear in the center portion of the window. (Note: Only dashboards that you are authorized to view will appear in the list.)
- All Dashboards is the default value. When it is selected, all of the workspaces you are allowed to see will appear in the center part of that panel.
- My Dashboards - Selecting this option displays a list of all the workspaces you created.
- Shared with Me - Selecting this option displays a list of all the Dashboards others have created and shared with you.
- Starred - Selecting this option displays a list of all the workspaces to which you have applied a "star" (for quick access).
- Trash - Selecting this option displays a list of all of the workspaces you have discarded. The list also provides options for restoring deleted workspaces. See Delete below for additional information and features.
In the center of the window is a section that lists the workspace names (as selected by the buttons on the left side). Because All Dashboards is the default value on the left, the list will show all of the names of dashboards for which you have access. In the example below, five dashboards are shown. To open any of the dashboards listed, click on the dashboard's name.
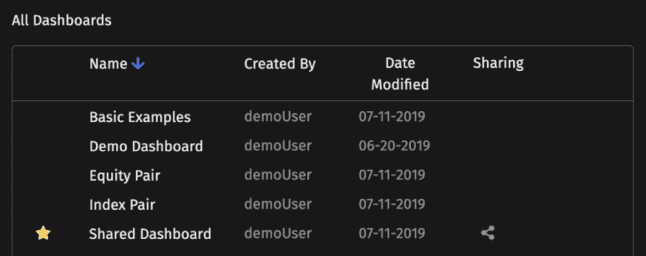
The blue, downward pointing arrow by the Name heading at the top of the list means this list is sorted in descending order based on the value in the Name column. Clicking the heading a second time will sort the list in ascending order. You can click any heading to sort the list.
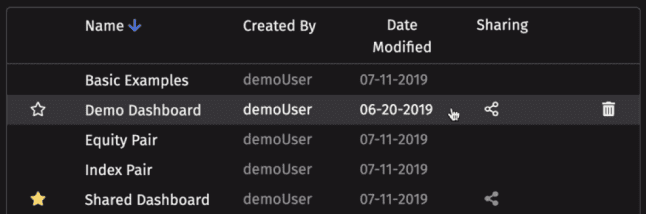
When you hover your cursor over a dashboard name, additional features are presented in the row for that dashboard, as shown below.
Star
If you select the star to the left of the dashboard name, it will become yellow, as shown below.
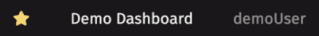
Selecting the Starred button on the left of the panel shows all dashboards that have been assigned a star. This feature enables you to make certain dashboards more readily visible/findable, especially if there are many dashboards in their list.
Created By
This heading shows the username of the person/group who created this dashboard.
Date Modified
This heading shows the date of the last time the dashboard has been modified.
Sharing
This column allows you to see if the dashboard is shared with another user. If so, the "Share" icon appears in the row, as shown below. If you are not the owner or do not have admin permissions on a dashboard, the icon will not appear. Selecting the icon opens the Share modal.

Copy
When a workspace is selected, the copy icon will become available if you have the appropriate permissions. Select the copy button to create an identical copy of the workspace or Query Monitors, which will be added to the All Dashboards list.

Delete
If the selected dashboard can be deleted, a trash can icon appears in the row, as shown below. You can only delete dashboards that you own, not dashboards shared with you by others. Deleting a dashboard makes it inaccessible for all users with whom that dashboard was shared.
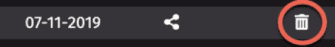
Selecting the icon will generate a confirmation dialog: choose Cancel to return to the previous panel or Delete to delete the selected dashboard.
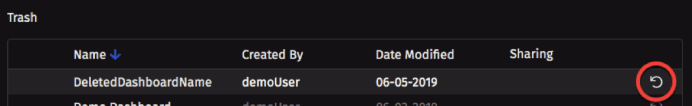
Once a dashboard is deleted in this manner, it will appear when the Trash button is selected from the left side of the panel. Deleted dashboards can be restored by selecting the counter-clockwise round arrow icon on the right, as shown below.
Shortcuts
The Shortcuts grid provides quick access to content. Populate this menu by dragging any item from the Dashboards list into the grid.
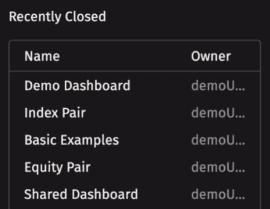
Recently Closed
On the right side of the window is a list of Recently Closed dashboards. To access a recently closed dashboard, simply click on the dashboard name.
Superuser mode
When the Superuser Mode button at the top of the screen is enabled, the dashboards list includes all dashboards - even the ones that belong to other users and are not shared with the current user. When this mode is disabled, the user will only see the dashboards that are owned by them or shared with them. This button is only visible to superusers.
Export dashboards
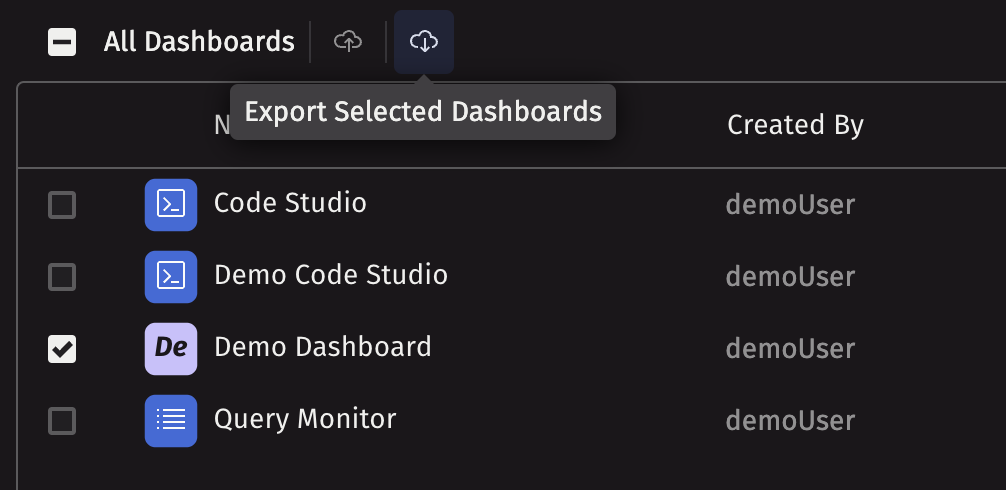
Select one or more dashboards in the list and click the Export Selected Dashboards button.
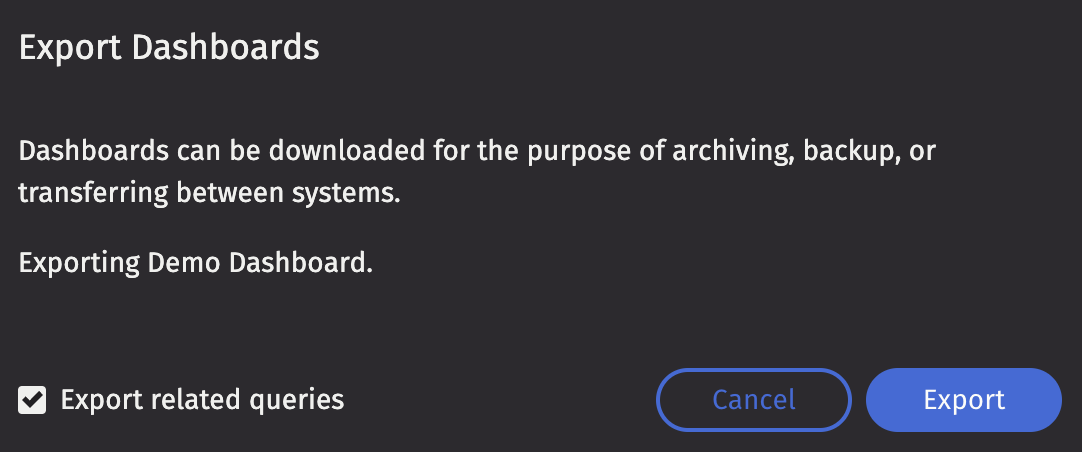
Choose whether to include all queries used in the selected dashboard, and click Export. The selected dashboards will be exported as a JSON file, or a ZIP file if queries were included.
Import dashboards
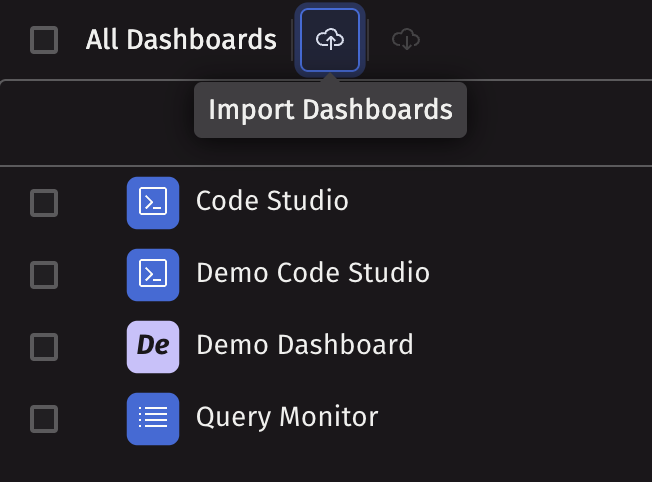
Click the Import Dashboards button.
Choose a JSON or ZIP file to import. The dashboards for import will be displayed. If you are importing queries as part of the ZIP file as well, they will be displayed. See the Importing queries section for more information on importing queries.