UI Pivot Tables
UI Pivot Tables are designed for displaying information that is aggregated in two or more dimensions, like a rollup across both rows and columns. Pivot Tables transform your data to show relationships between different dimensions, making complex data easier to analyze and interpret.
Pivot Tables are particularly useful when:
- You need to analyze data across multiple dimensions simultaneously.
- You want to summarize large datasets into manageable insights.
- You need to perform comparative analysis between different categories.
- You want to create cross-tabulations for reporting purposes.
To create a Pivot Table, you must specify three core components:
- Row by columns: Defines the grouping for rows (vertical organization).
- Column by columns: Defines the grouping for columns (horizontal organization).
- Aggregations: Defines the calculations performed on data points.
Create Pivot Tables
To create a Pivot Table, use these API methods:
- Python:
make_pivot. - Java/Groovy:
PivotTable.make.
Data visualization
Pivot Tables display data in a grid where row by columns form a hierarchical structure on the left, column by columns become headers across the top, and aggregated values fill the cells. Each level of the row hierarchy can expand or collapse to show more or less detail. Totals are computed at each level, with grand totals shown at the root.
Example: Log message analysis
In this example, we create a pivot from the ProcessEventLog table showing the count of log messages. The rows are aggregated by Date, EffectiveUser, and ProcessInfoId. The columns are pivoted by log level (e.g., ERROR or INFO).
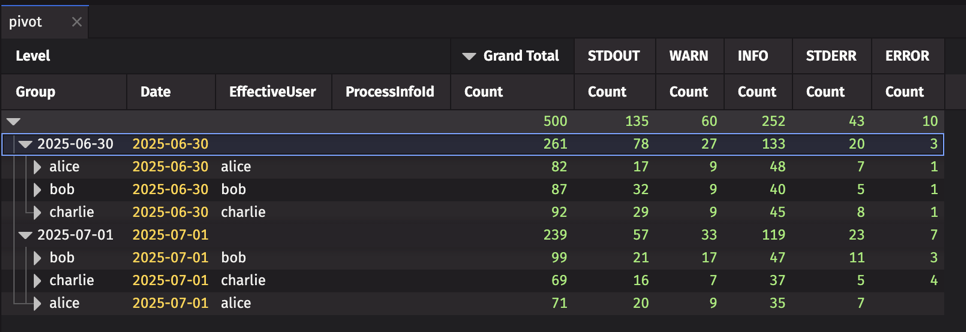
The Pivot Table displays aggregated counts organized by the row hierarchy (Date → EffectiveUser → ProcessInfoId) and pivoted across log levels as columns. In the example above, there are 500 total log messages: 252 INFO, 135 STDOUT, 60 WARN, 43 STDERR, and 10 ERROR. On 2025-06-30 there were 261 messages, with alice generating 82, bob generating 87, and charlie generating 92. Expanding a user row reveals the individual process breakdowns.
Interactive features
Pivot Tables in the Web UI support interactive exploration.
You can sort a Pivot Table along either the rows or columns dimension using either the column by columns or the total aggregations for that dimension. Pivot sorts work identically to rollup sorts in each dimension — each node is sorted independently, maintaining the pivot's hierarchical structure.
A Pivot Table may be filtered by row or column keys, but cannot be filtered by aggregated values. After filtering, aggregations are recomputed so that totals only include the values accepted by the filter.
Expand and collapse
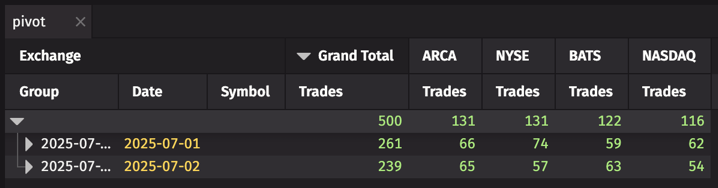
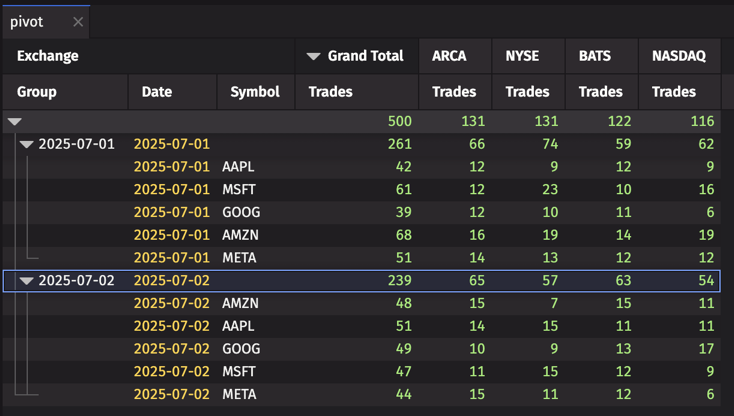
Click the expand/collapse icons next to row or column headers to drill into or roll up the hierarchy. This allows you to focus on specific subsets of your data while maintaining the overall aggregation context.
Context menus
Right-click to access context menus with options specific to the clicked area:
- Column header: Access sorting, filtering, column visibility, and alignment options. The tooltip also displays column metadata:
- Column name and type: The column's name and data type.
- Aggregation: The aggregation function applied (e.g.,
count,sum). - Sortable/Not sortable: Only the row by columns and column by columns can be sorted; aggregated value columns cannot be sorted.
- Movable/Not movable: Pivot Table columns cannot be reordered. This indicator is inherited from regular tables, where columns may be movable.
- Expanded Rows: The number of currently expanded rows in the viewport.
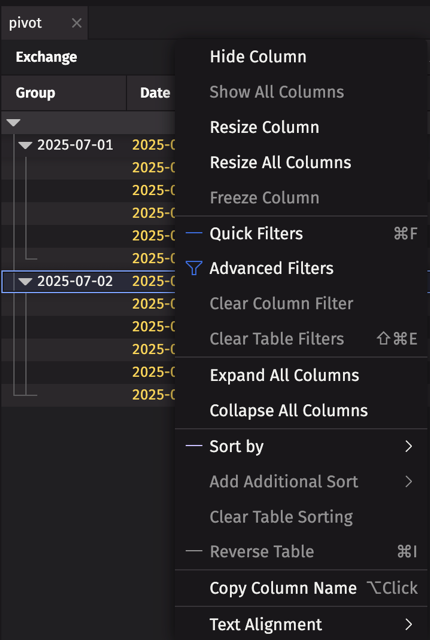
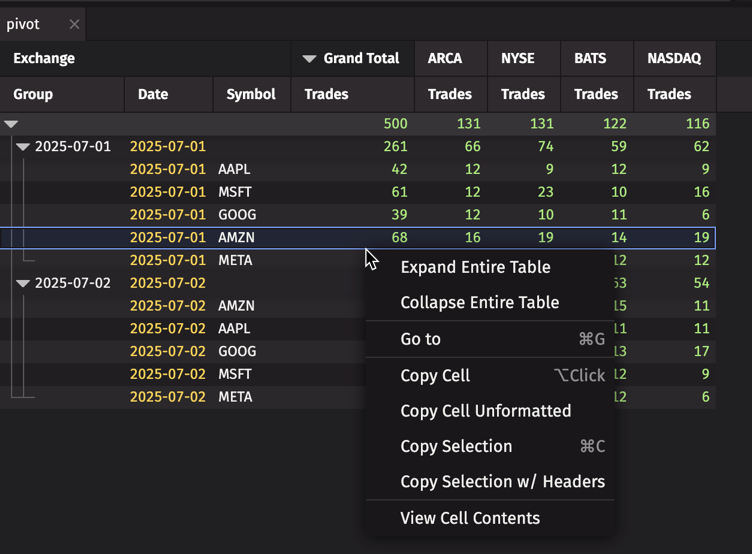
- Table data: Expand or collapse the entire table, navigate with "Go to", and copy cell contents.
Filters and sorts
If you want to filter by input columns other than the keys, you must filter the source table and re-apply the pivot.
In Groovy, sorts and filters are added to the Pivot Table with the apply method. The method takes two collections of SortColumns, one for the rows and another for the columns, and a list of Filters.
Rebase
The rebase method creates a new Pivot Table with a different source table while preserving the pivot's configuration — aggregations, row-by/column-by columns, and any applied filters or sorts.
This is useful when you need to apply transformations to the source table (such as ACLs or additional filters) without recreating the entire pivot configuration.
Security considerations
Access Control Lists
When an ACL (Access Control List) is applied to a Pivot Table, it is applied when a user fetches the Pivot Table from the server. The ACL is applied to the source of the pivot, thus allowing the user to see the aggregated values across the permitted rows.
Example: User-specific data filtering
Extending the previous example, we add a group filter to the EffectiveUser column. This filter permits users to view only rows that have an EffectiveUser value that matches one of the groups they are a member of. Because each user is a member of a group that matches their user name, and the EffectiveUser column contains the username that a worker is running as, the effect is to display a pivot that includes only that user's processes.