Pivot Widget examples
Warning
Legacy documentation: This documentation applies to Legacy Deephaven Enterprise only and does not apply to Core+.
Example heat maps
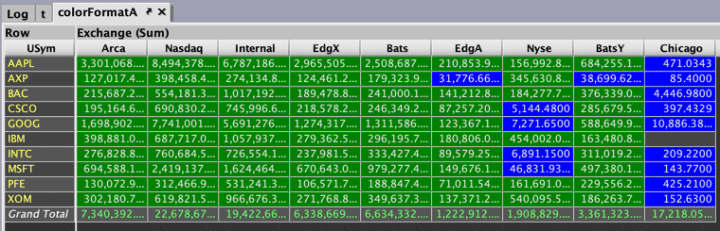
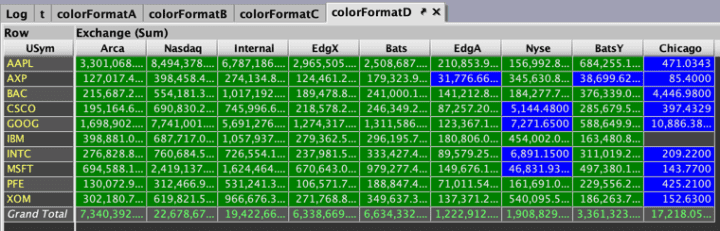
The following examples, scripted in Groovy, demonstrate the .setColorFormat method and its various implementations.
Each example modifies the same pivot widget created from the StockTrades table:
Example 1
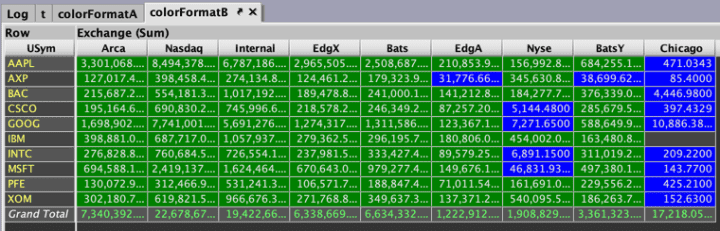
Example 2
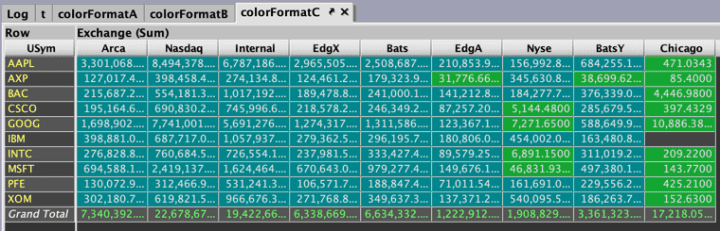
Example 3
Example 4
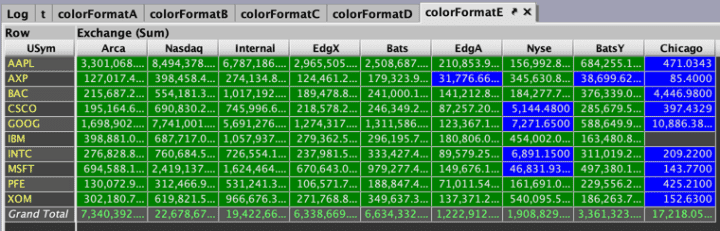
Example 5
Example 6
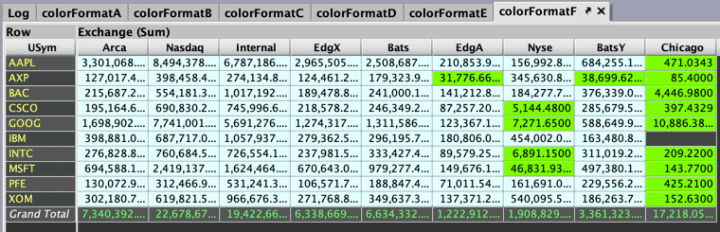
Example 7
By default, the minimum and maximum values will apply to all the columns in the Pivot Widget. It is also possible to set the min/max coloring ranges dynamically per column by including multiple setColorFormat arguments within your query.
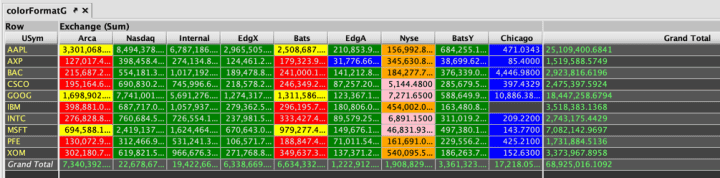
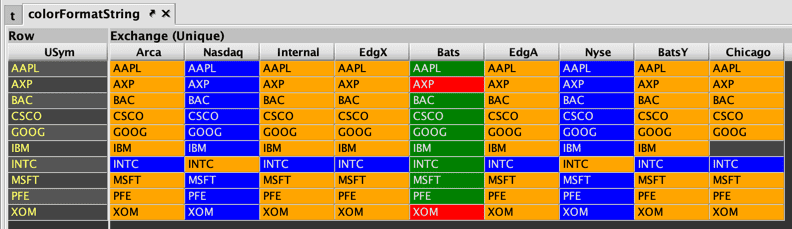
Example 8
To allow heat maps for String data, include the unique() aggregator in your query.