Saving Plots
Warning
Legacy documentation: This documentation applies to Legacy Deephaven Enterprise only and does not apply to Core+.
Charts created in Deephaven can be saved as PNG files, either using the Plot Hover menu or by query, using the figureSave method discussed here.
Tip
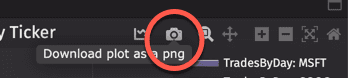
Download any chart as a PNG file from the Plot Hover menu, as shown:
figureSave
There are two options for the arguments in the save method:
save("StringName.png")- Saves a PNG file with the size 2480px x 2160px (width x height).save("StringName.png", int width, int height)- Saves a PNG file with your specified width and height (in pixels).
By default, the resulting PNG file is saved into the following directory on the server: /db/TempFiles/dbquery/db_query_server/