Create dashboards by hand
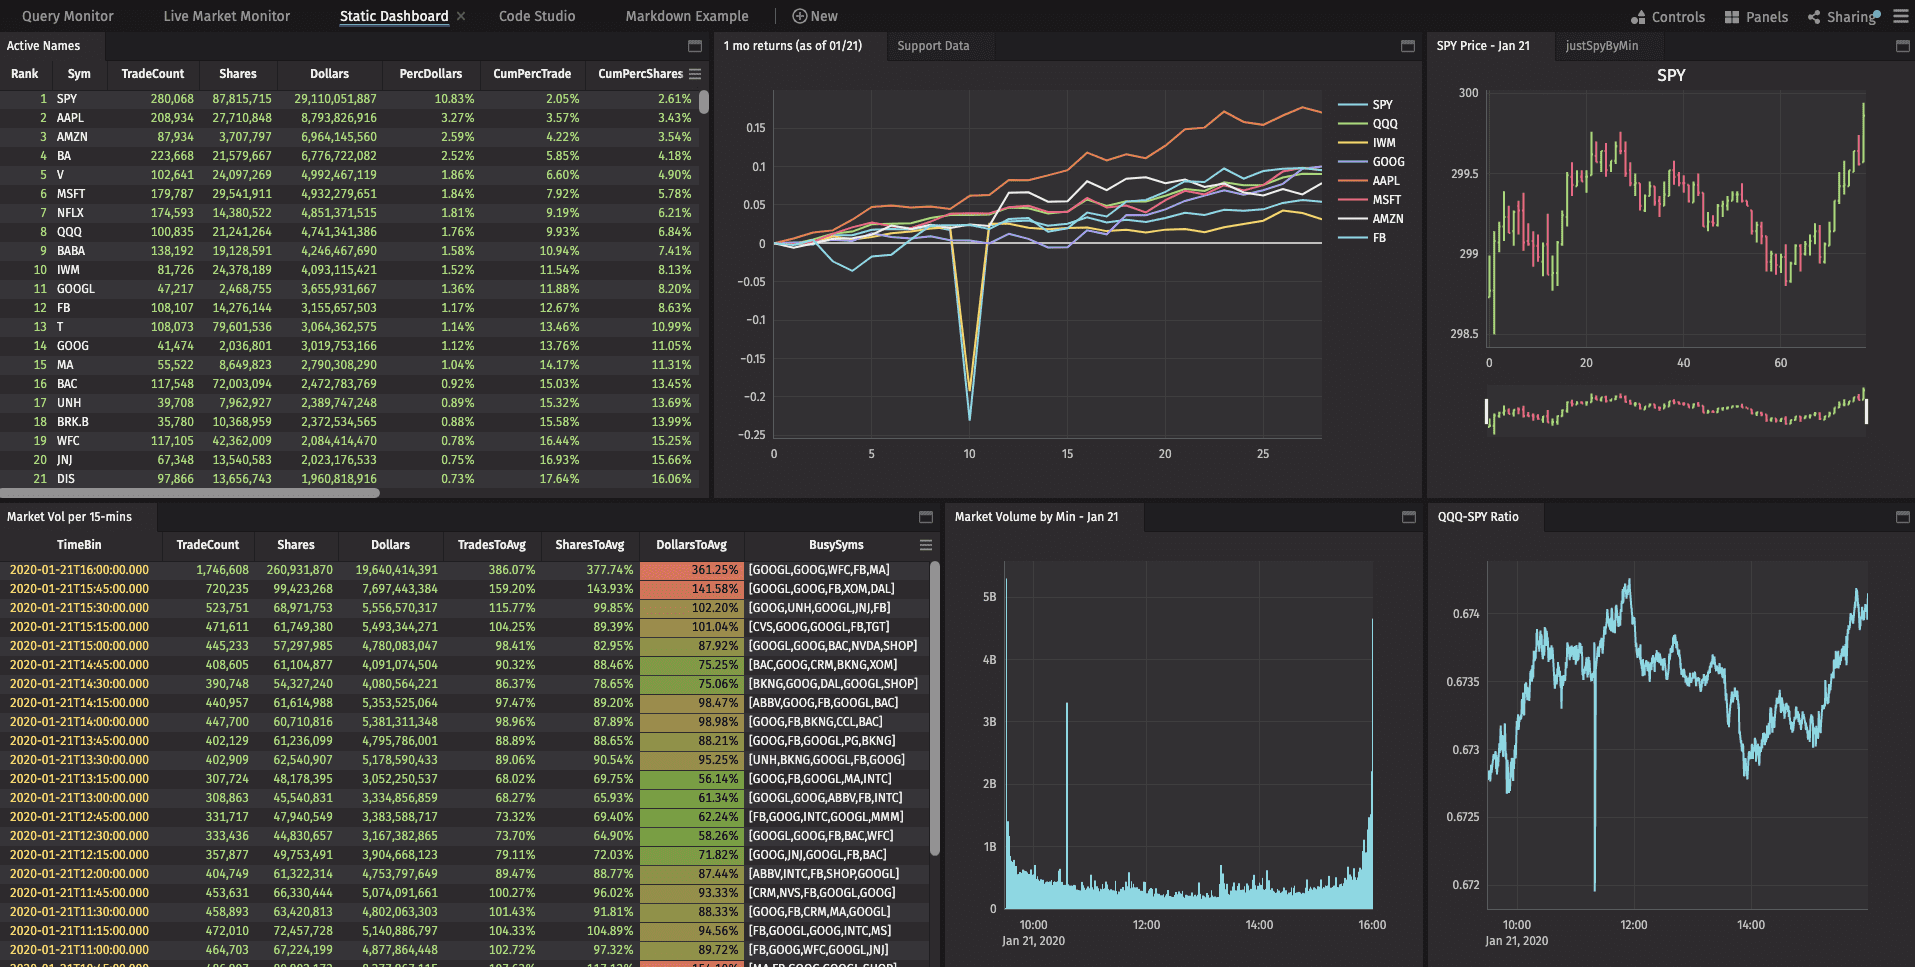
Dashboards are customized collections of content that include tables, plots, and/or sets of nested panels. You can create dashboards by hand in the UI by dragging and dropping different components to your preferred locations for a customized layout.
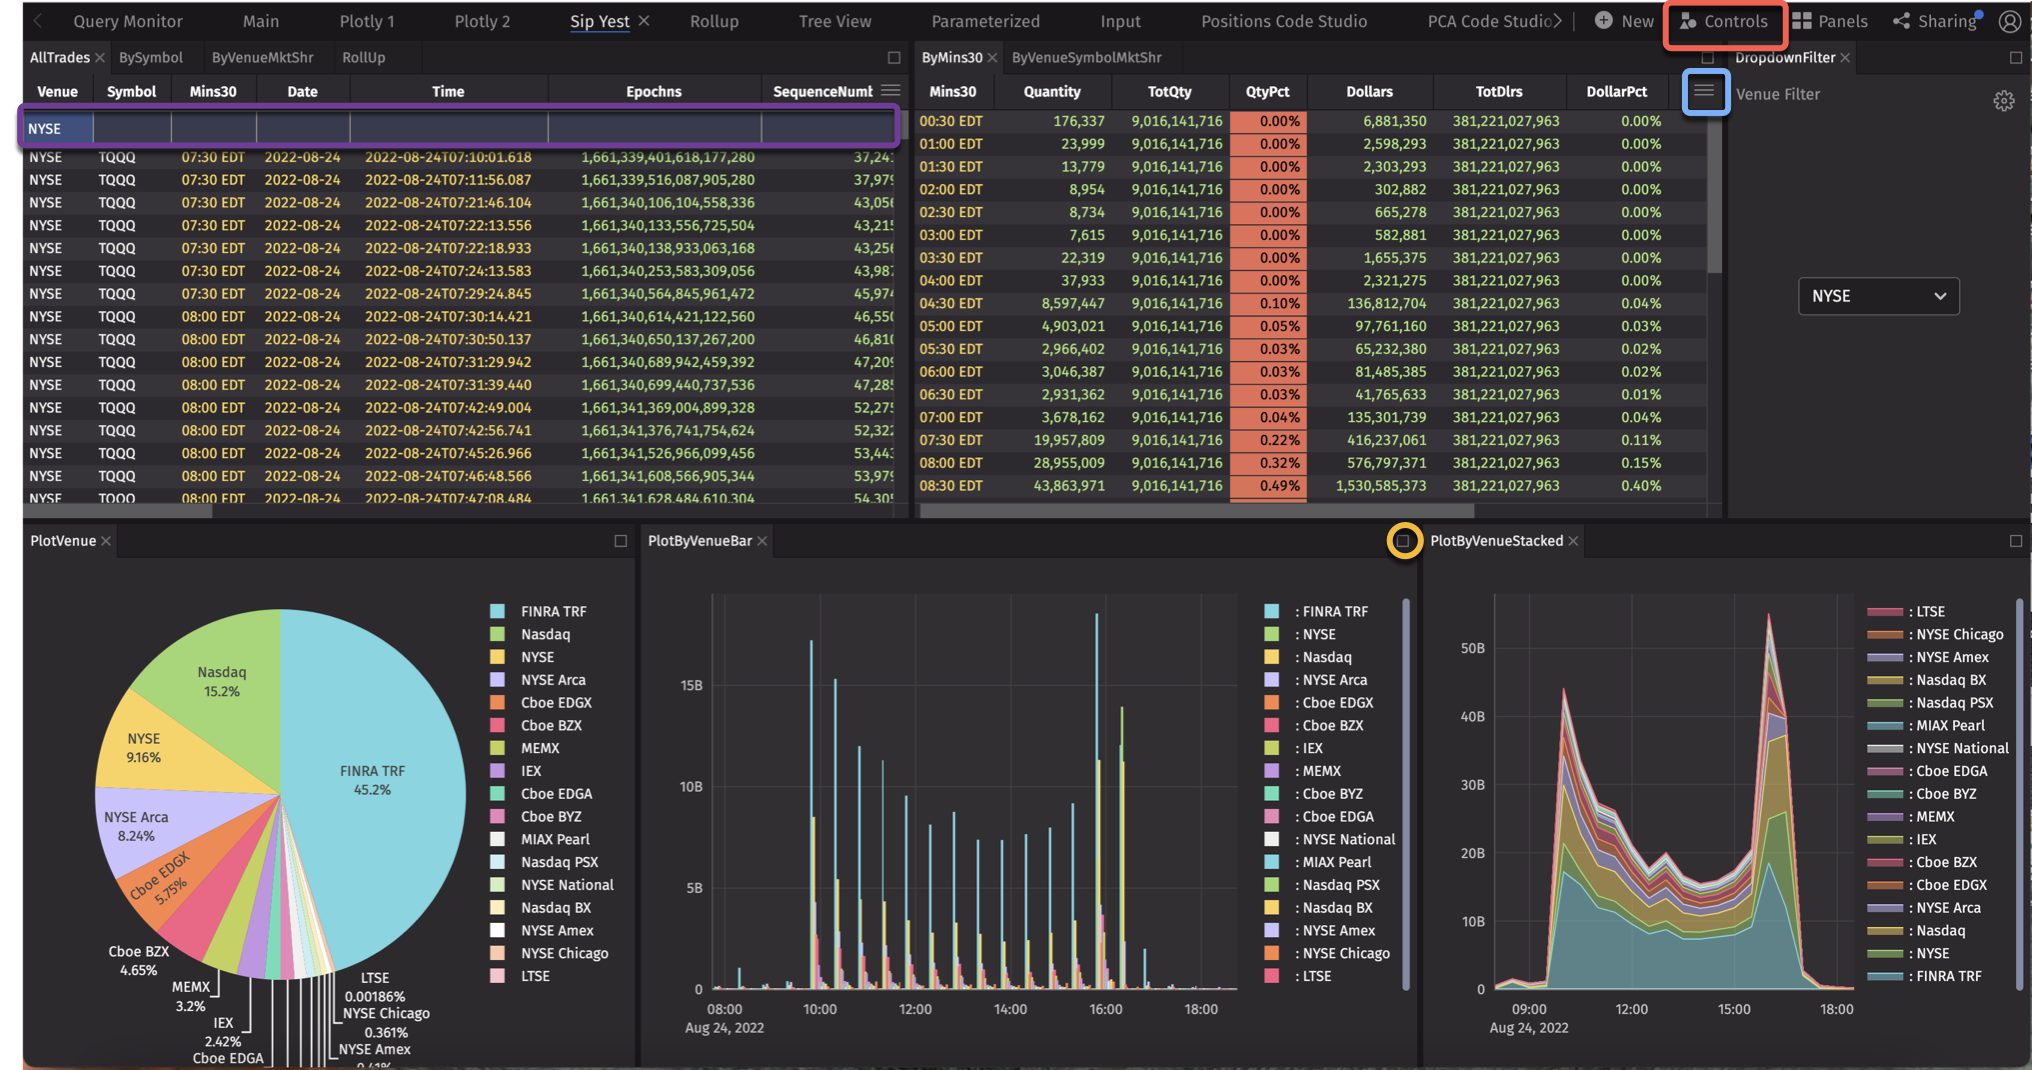
Some key features:
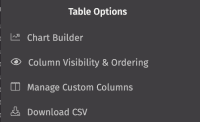
- The Table Options menu is available on all tables and provides access to the Chart Builder, Custom Columns, filtering and search options, etc.
- A Quick Filters bar is already present on the AllTrades table.
- Access the Controls menu to open the Dropdown Filter, Input Filter, and Linker tools (covered in the Manipulate tables in the UI section). A Dropdown Filter is applied to the Venue columns in this dashboard.
- You can maximize any panel , resize, move, and nest any panel in the workspace.
Create a new dashboard
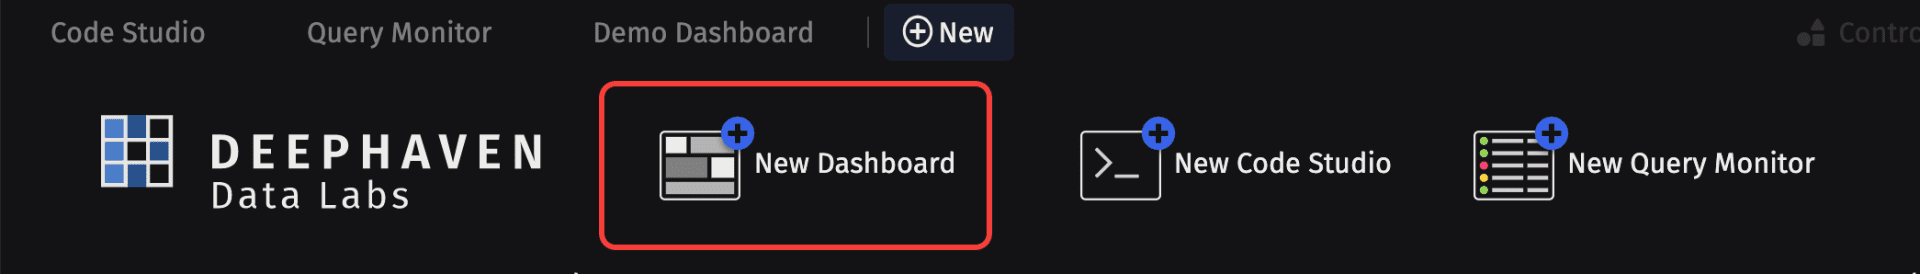
To create a new dashboard, click the +New button at the top of the Deephaven interface, and then select New Dashboard:
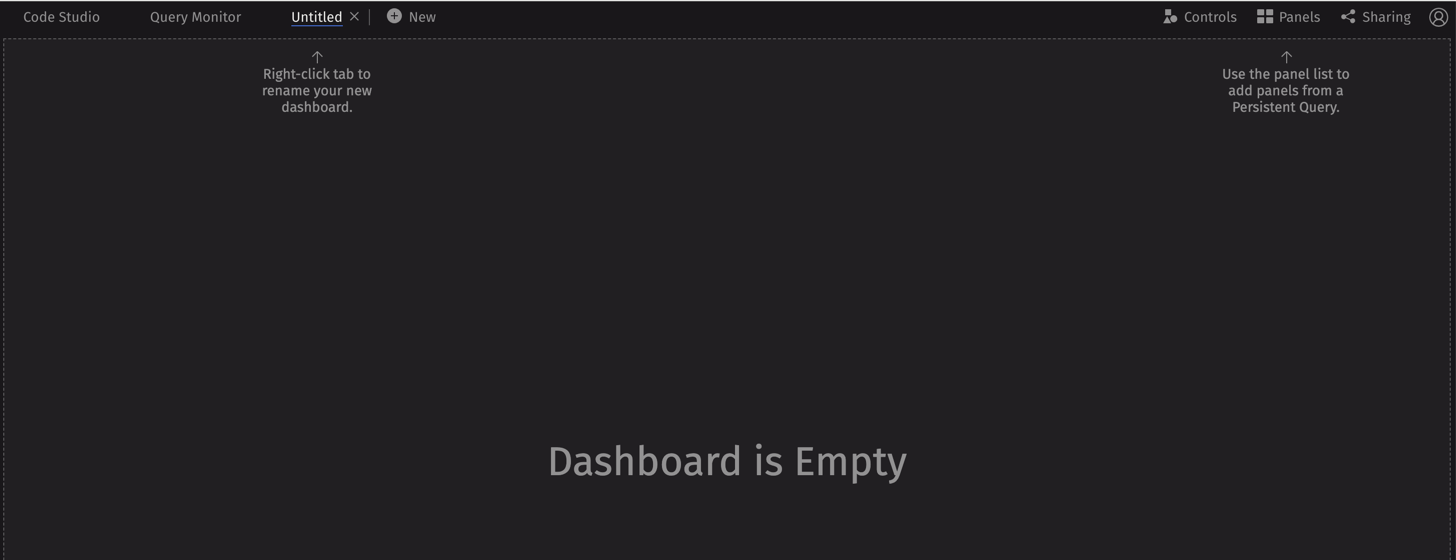
This opens an empty dashboard window.
Note
You must name a dashboard before you can share it. Right-click the Untitled tab to rename it.
Start to add content using the Panels menu, which provides a list of Persistent Queries (PQs) available to you. PQs are essentially applications and analytics running on the platform. These queries generate tables and/or plots you can add to your dashboard(s) or consume via APIs.
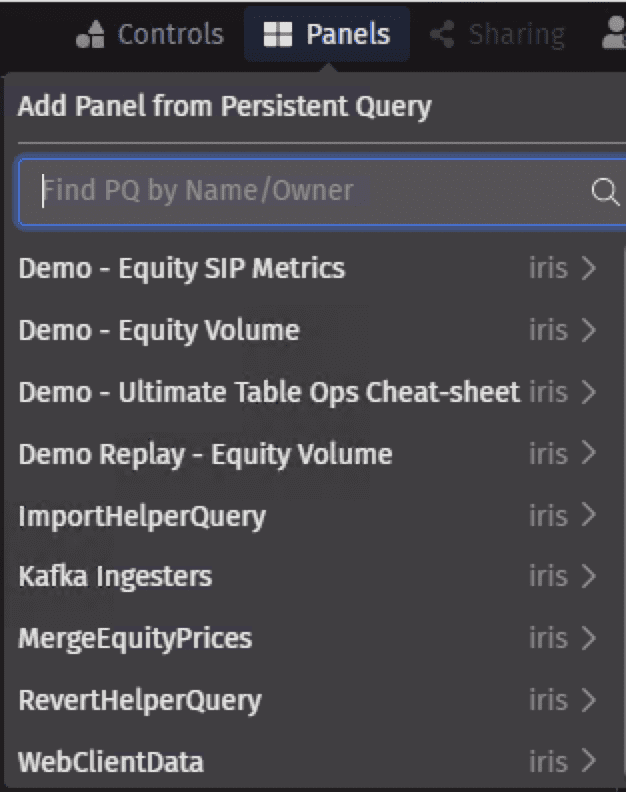
Click on any PQ to see the associated tables and plots and add them to your dashboard. You can also use the search field to filter your options.
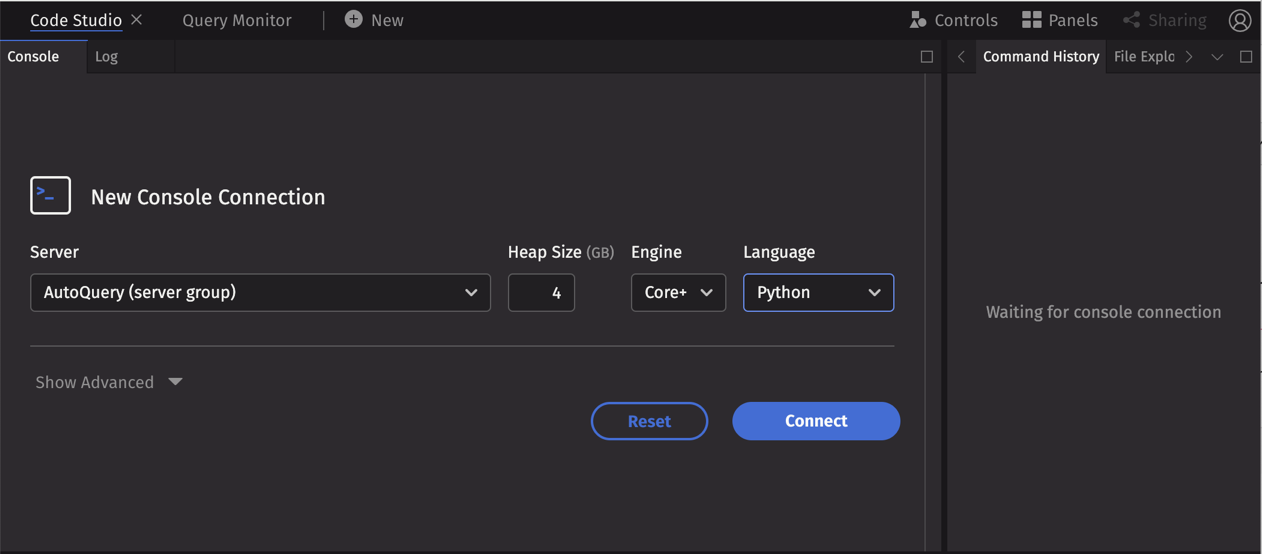
Code Studios
The other primary interface is the Code Studio, a workspace for writing queries and code to interrogate and manipulate data. It can serve as an ad hoc console or REPL (Read-Eval-Print Loop).
Multiple Code Studios may be open simultaneously, including those using different programming languages. This is especially beneficial if you have a variety of independent, ad hoc analyses or development projects underway at the same time.
Console / Log
Atop the code studio sit the console and log, each with their own tab. In the console, all of your previously run code appears, along with clickable blue icons representing the panels that have been created for tables, plots, and other widgets. By default, these panels automatically render below the console when they're created.
If there is an error during execution, details can be found in the console and the log. The log presents varying logging levels for additional information on errors, warnings, or runtime details.
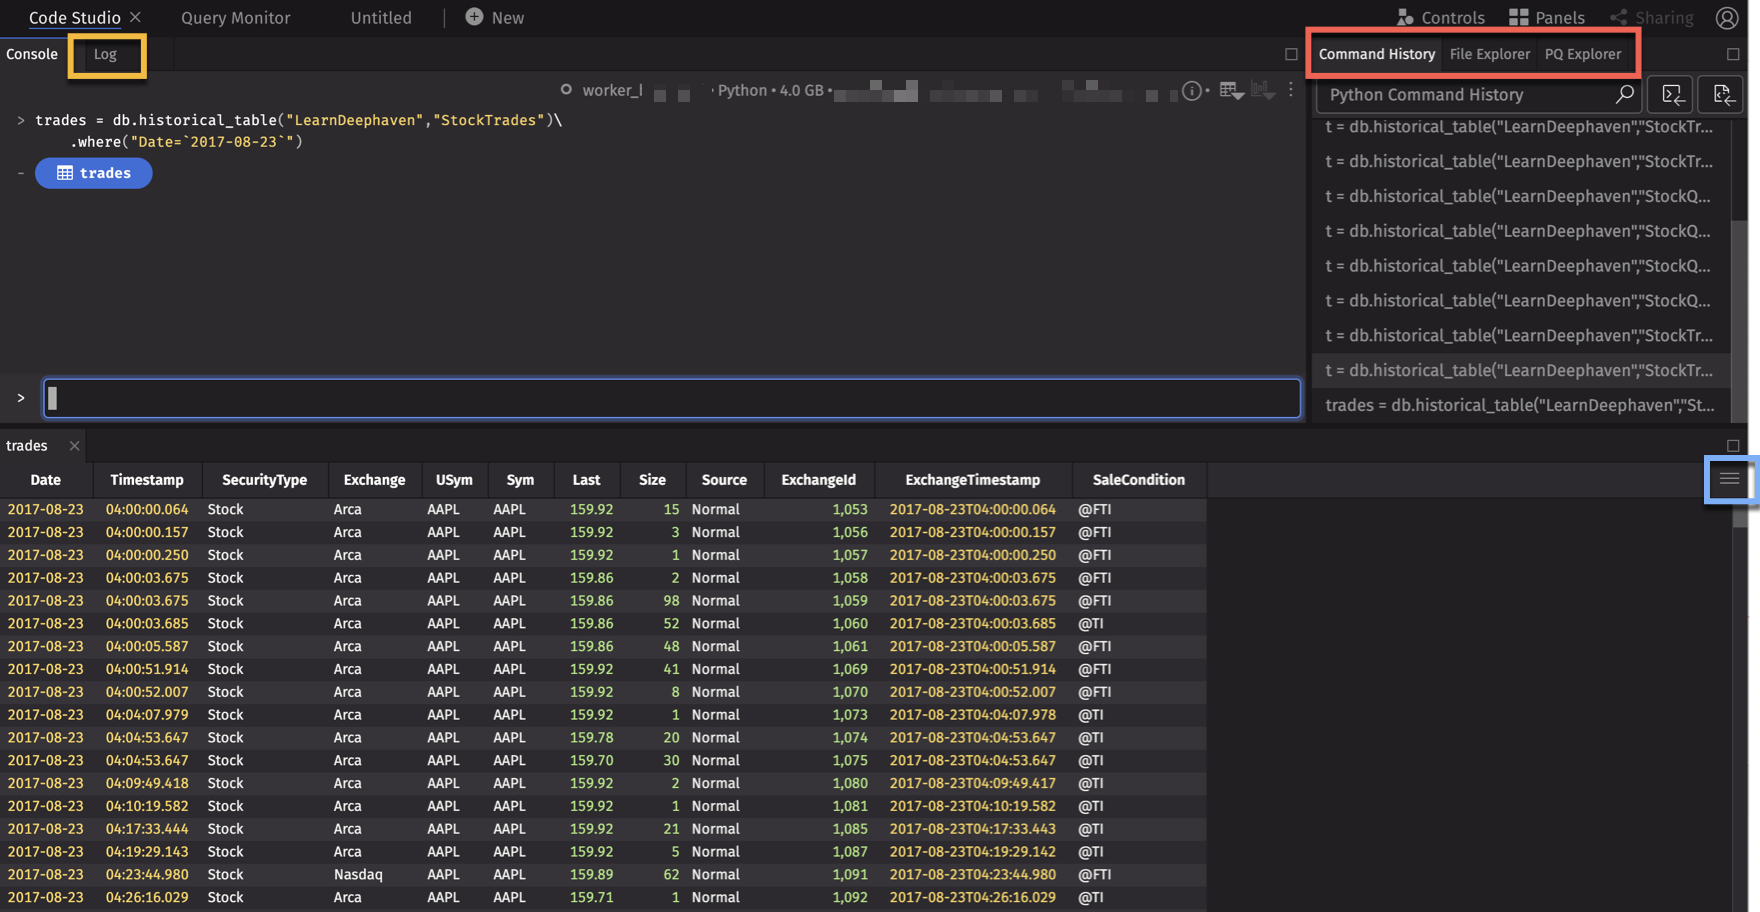
Let's see how the Code Studio works by writing a simple query. Run the following query in the text box at the bottom of the console:
The Deephaven Query Language tells Deephaven to:
- open a historical table (
db.historical_table) - named "StockTrades" stored in the "LearnDeephaven" namespace,
- filter the data only to trades on August 23, 2017.
Writing queries is covered in more detail in this crash course's develop a query section.
As before, you'll see the Table Options menu on the "trades" table we opened.
To the right of the Console tab is the Log tab , which records what your query/code is doing, including data input/output and processing. This is primarily intended for advanced programmers, but the Log will record errors that may occur to help find and resolve problems when query writing.
On the right of the workspace are the Command History, File Explorer, and PQ Explorer tabs . These tabs provide access to your query history, notebooks, and PQs.
Query Monitor
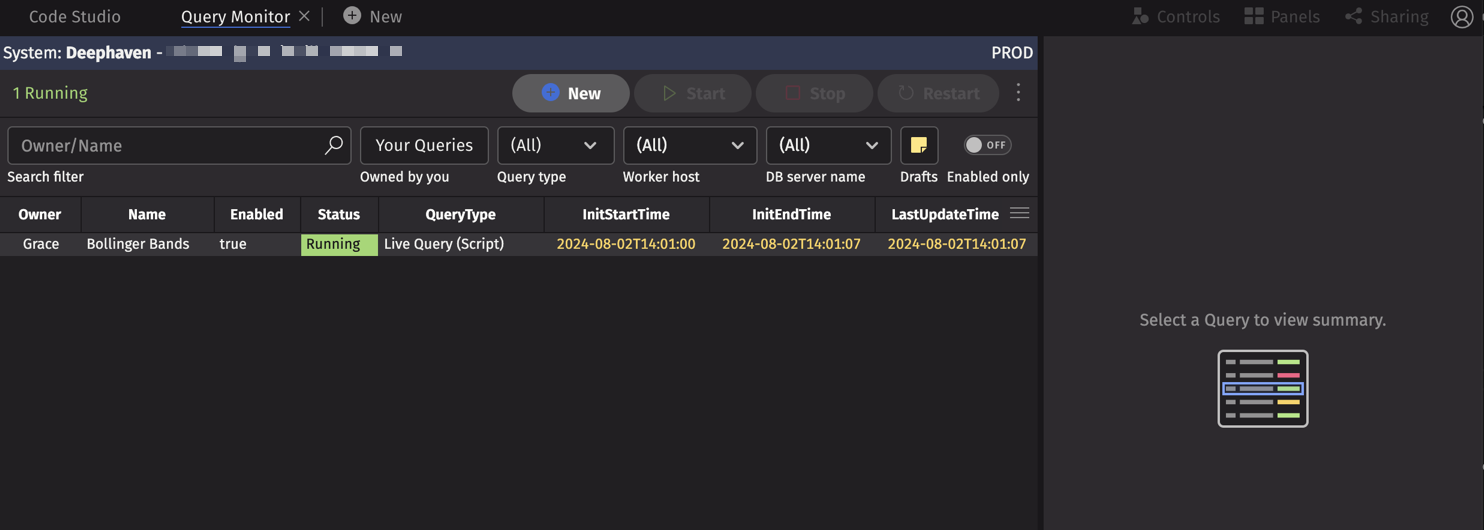
The Query Monitor is used to manage and create PQs on the web. PQs operate just like console-based queries. However, PQs are created and saved, thereby enabling the automation of repetitive and/or timed operations. Also, PQs can be shared with other individuals or teams.
The Query Monitor Table stores information about each query you are authorized to view, and the the panel on the right displays summary information about the highlighted query, as well as tabs for configuration options and the query's script.
Tables and plots generated by PQs are available in Code Studios and Dashboards from the Panels menu.
Manipulate tables in the UI
Whether you're working in a Dashboard or Code Studio, Deephaven makes it easy to customize your workspace and perform data analysis within the UI.
Though writing scripts is valuable and important, users want to be able to manipulate results directly in the tables they see. There are several ways to manipulate your data. Right-click any column header to open the following context menu:
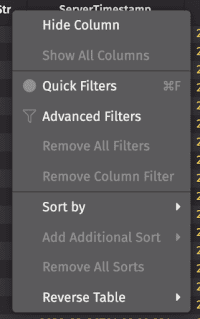
Some basic options are itemized below.
Sort
To sort a column, choose Sort by options from the column header menu, or simply click the column header once to sort in ascending order, a second time to sort in descending order, and a third time to return the column to its original order.
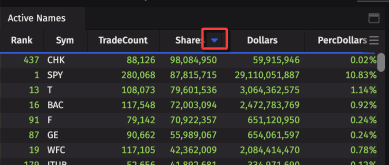
Once a table has been sorted in this fashion, an "up" arrow or "down" arrow will appear to the right of the column name to indicate the sort and the order (as shown below). A blue underline also displays across the bottom of the column header row anytime a table is sorted.
Filter
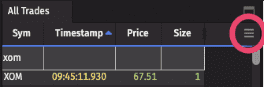
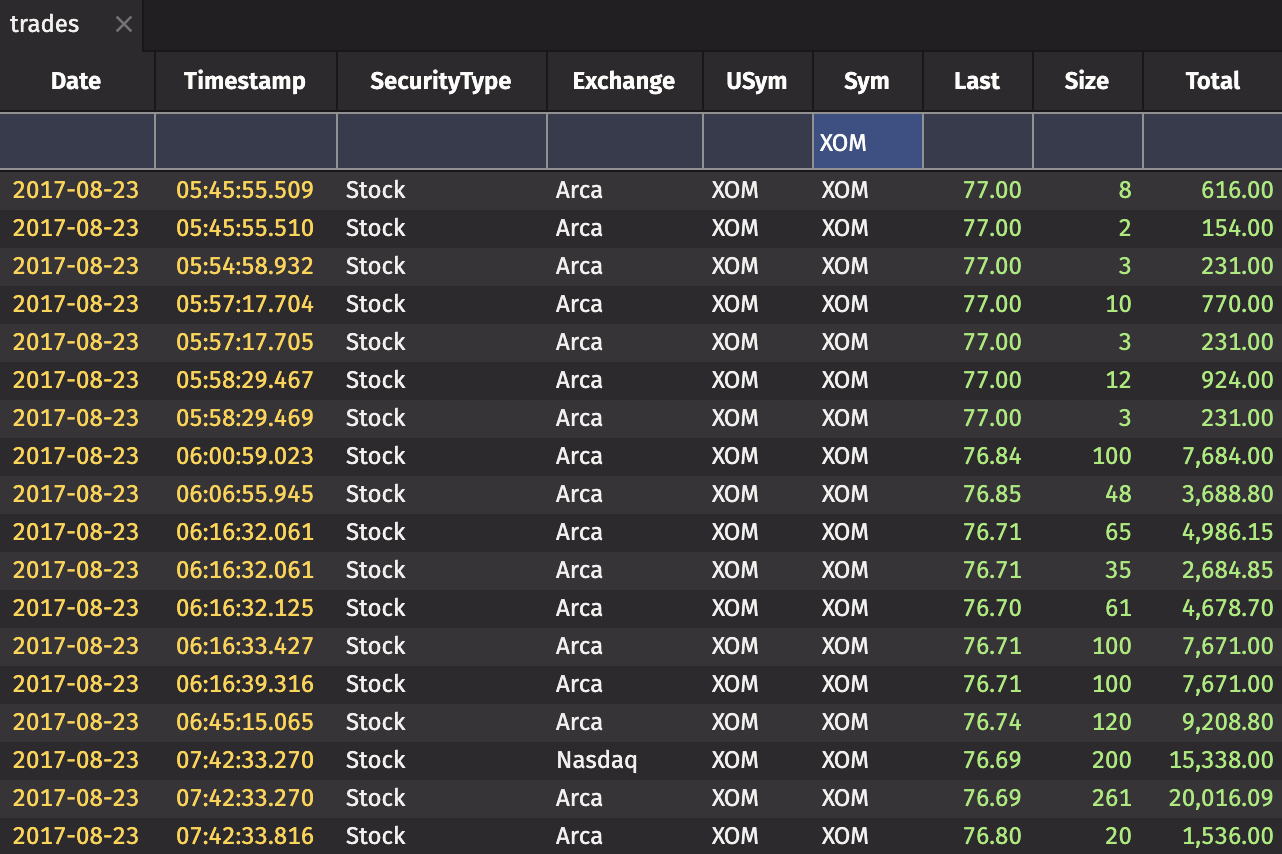
There are several ways to filter your data. Choose Quick Filters from the column header menu to add a filter bar across the header rows of your table. Type in your desired value (e.g., XOM) to immediately apply that filter to the table, as shown below.
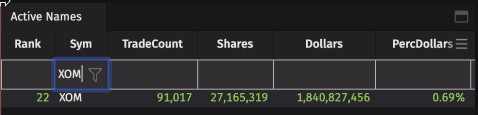
In addition to matching exact values, there are other options you can use to filter the data. For example, entering ">=50" in a number field will show table rows containing values greater than or equal to 50. To see all options, please review the Quick Filter Statement Options.
The funnel icon (in the highlight above) opens the Advanced Filters dialog, which include AutoFilters.
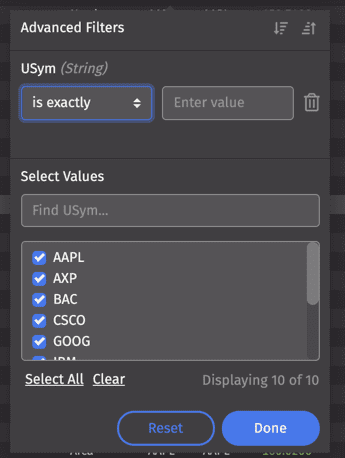
To learn more, see Advanced Filters.
Plot
A comprehensive set of plotting methods is available when scripting in the Deephaven Query Language. However, you can also create a simple chart directly from the table. In the table containing the data you want to plot, click the Table Options menu.
Then select Chart Builder.
The Chart Builder interface allows you to choose one of the four available chart types and configure the applicable axis values, as shown below.
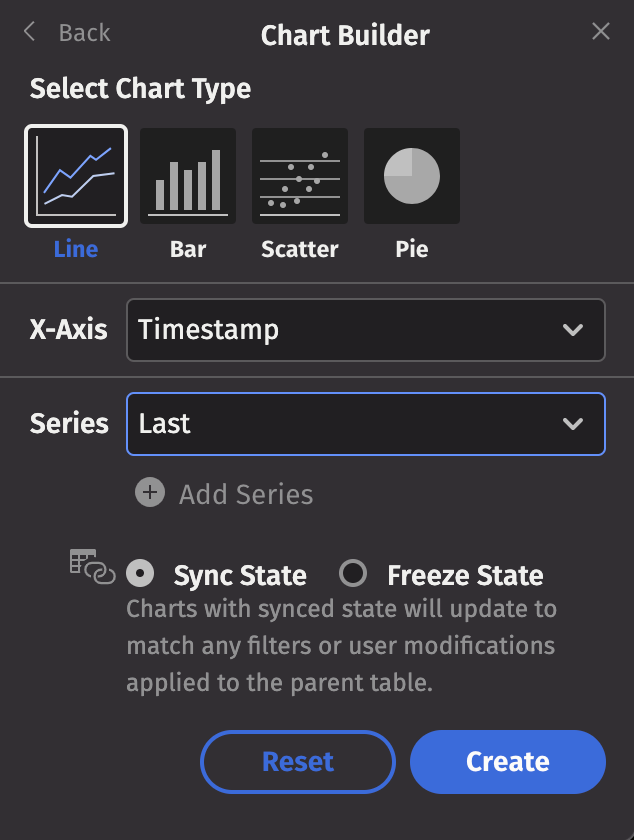
Make your selections and click Create. Note: The resulting plot will reflect any filters applied to the table.
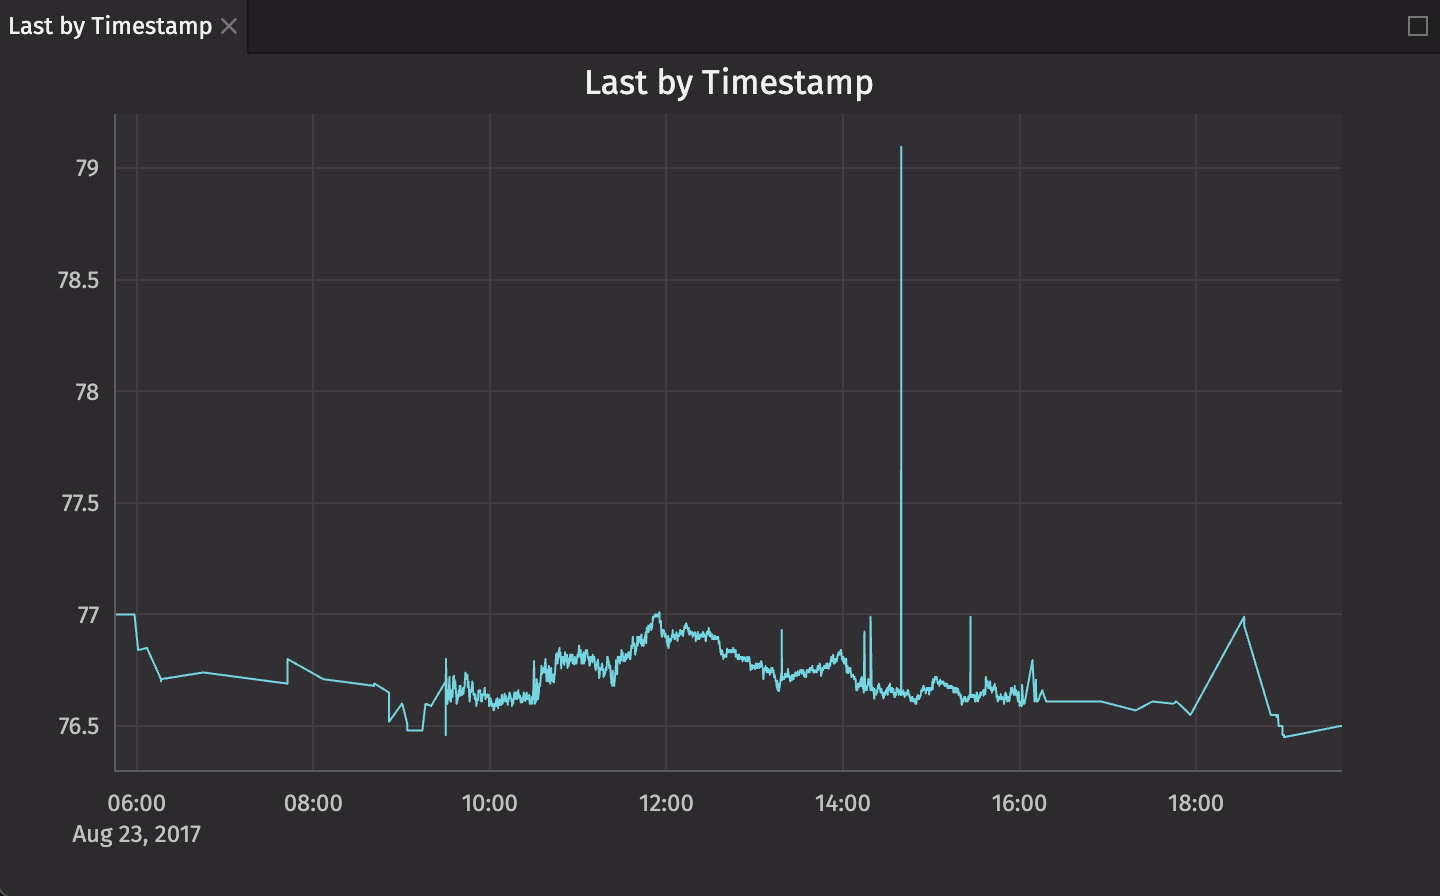
The following line chart shows the prices for XOM over time:
Hide or reorder columns
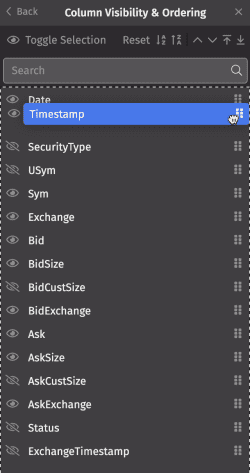
The Column Visibility & Ordering feature allows you to quickly hide/show, rearrange, and sort columns in one place. Open the Table Options menu, and then select Organize Columns. A list of column names will appear. The eye icon indicates which columns are visible in the table.
As shown below, drag and drop any selected column to rearrange the order in which they appear in the table.
Manage Custom Columns
Manage Custom Columns is a feature that enables you to quickly add new columns to store custom calculations directly in the Deephaven interface, rather than updating a table's query. (See Custom Columns to learn more.)
To create a custom column, open the Table Options menu, and then select Custom Columns.
In the Manage Custom Columns dialog (shown below), enter the name of the new column, then write the formula below. For example, you could add a new column called "Total" that multiplies the last price and size for each row in the table:
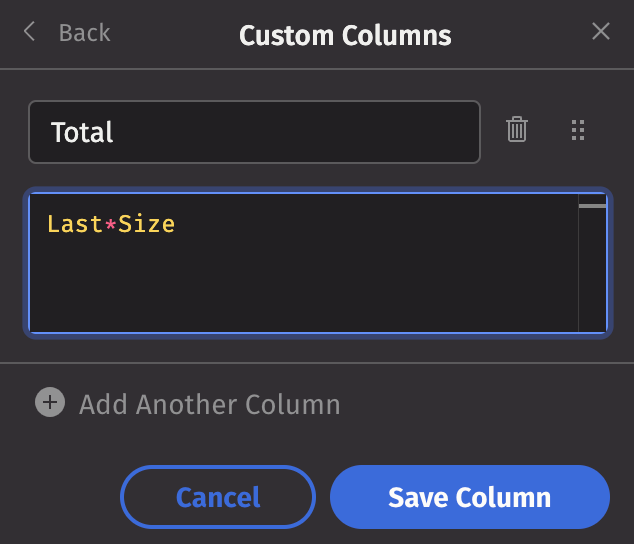
You can open the Custom Columns dialog again to edit your selections if you like. You can also add additional custom columns by clicking the + Add Another Column button.
Tip
If you have created multiple custom columns, it may be necessary to arrange the order of your custom columns for calculations to work correctly. For example, columns may depend on each other, or especially if your calculations create new columns that override old columns, with the same name. Deephaven evaluates columns from left-to-right.
To change the order of the new custom columns prior to showing them in the table, click the drag icon ( ) in the dialog and drop the column information to the desired position. To remove a custom column, click the trash can button (
 ) to the left of the column name, and select Save Column.
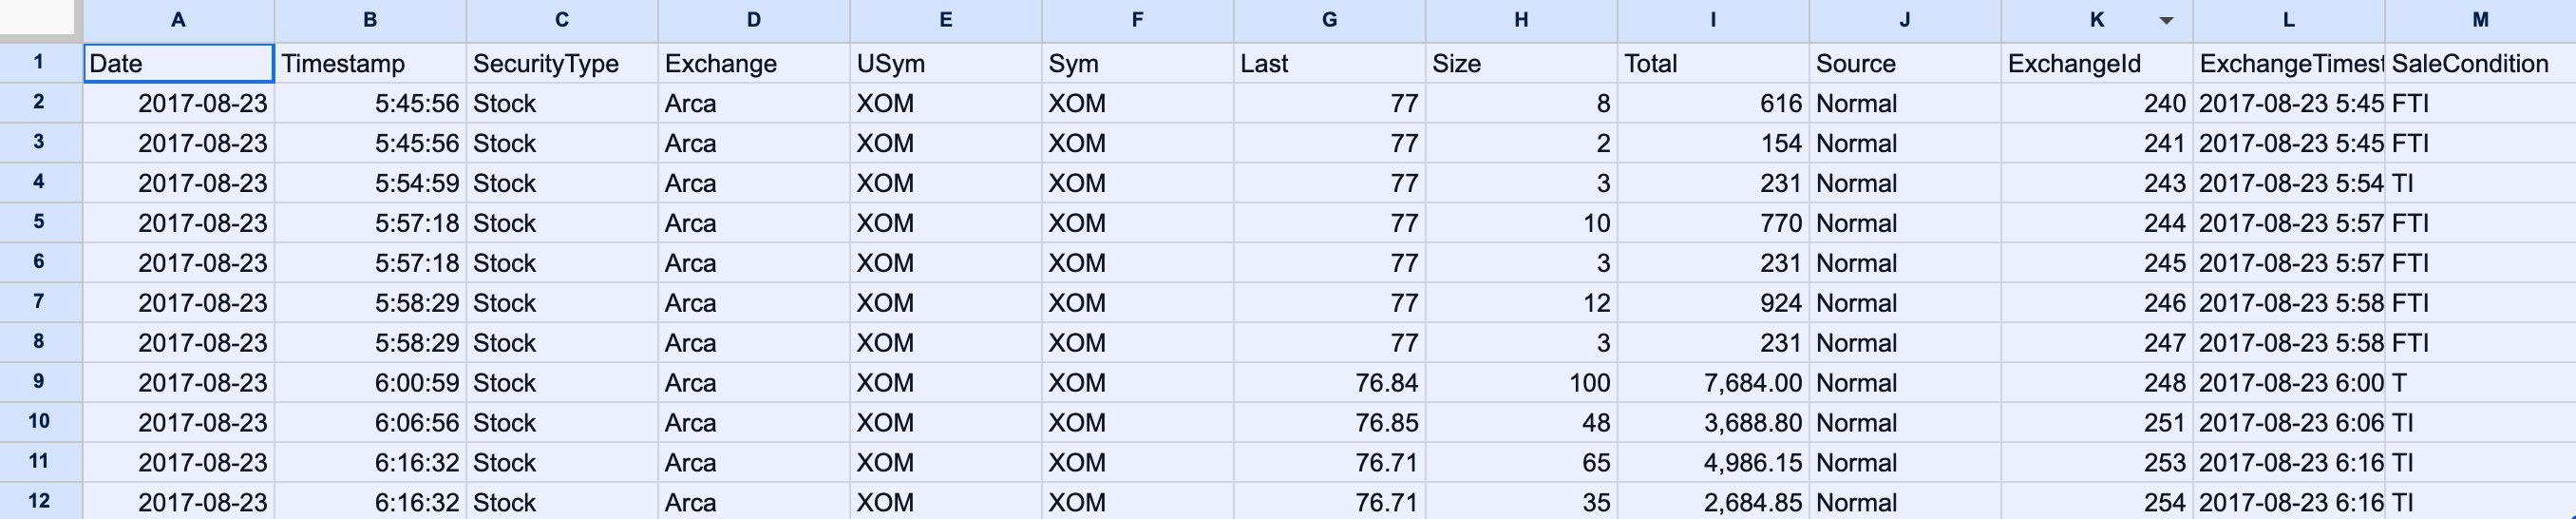
Copy data to the clipboard
To copy data from a table to the clipboard, use the mouse to highlight the rows of data you want to copy. Then use the context (right-click) menu to select one of the copy options, as shown below.
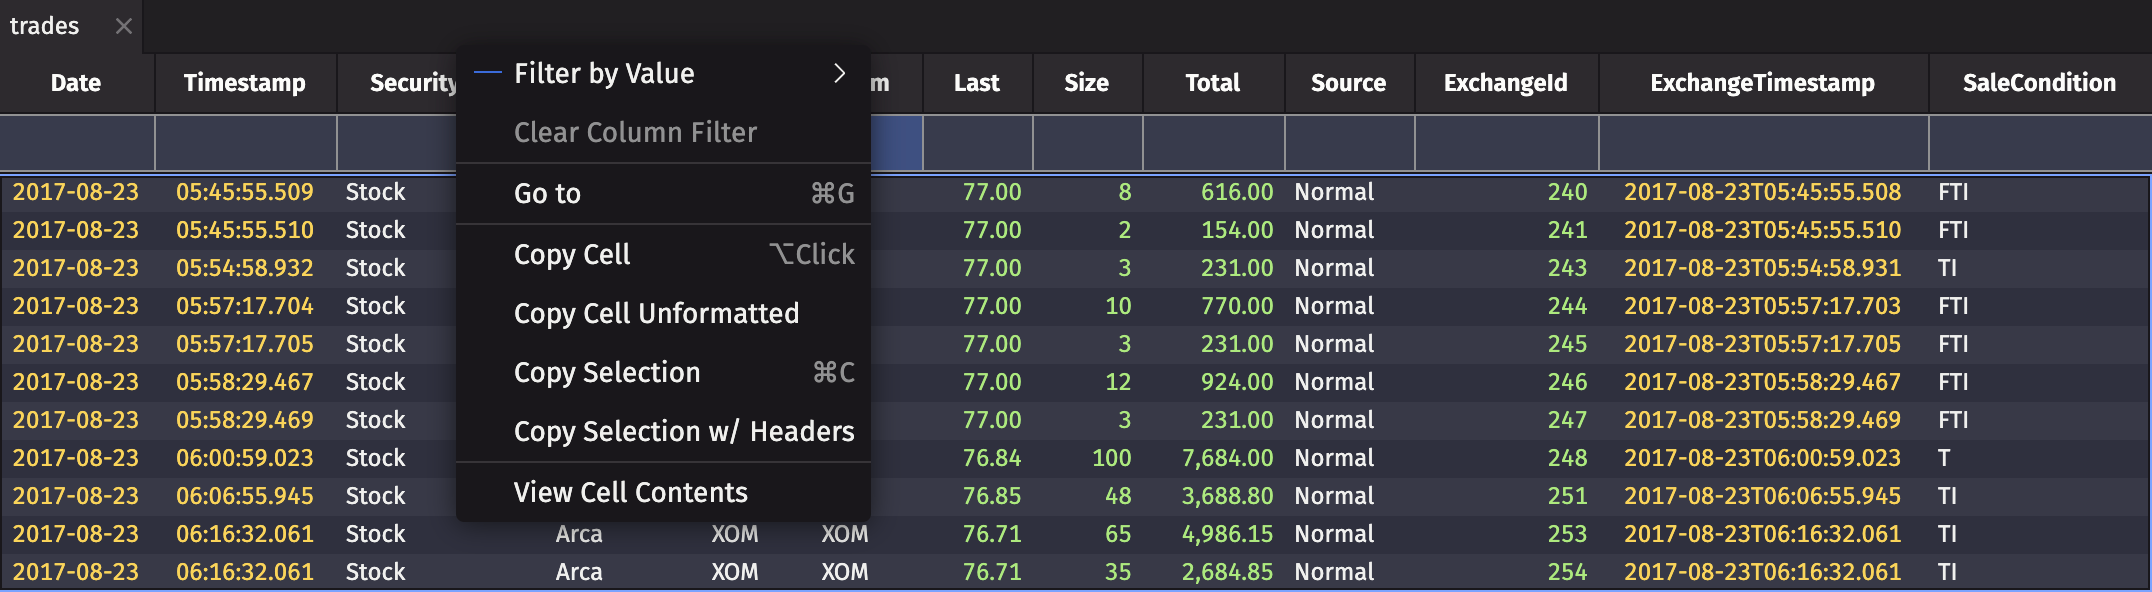
The copied data can then be pasted into a spreadsheet (or text editor):
Link tables and use input filters
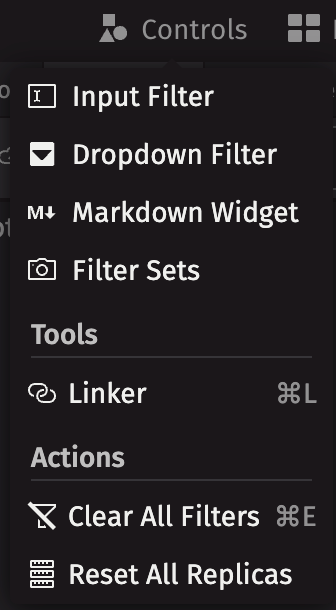
The Controls menu houses some of Deephaven's most powerful tools including Input Filter and Linker. (To learn more about the Markdown Widget, refer to our full User Guide.)
Input Filters
Input Filters accept direct user input and are applied to all the tables and plots in that workspace. They provide a quick way to cycle through values. As shown below, the USym Input Filter reduces the data in the two tables and one plot to AAPL only. OneClick plots require a filter to render, and the UI will prompt you to add a filtering method on the appropriate column.
Linker
To use the Linker, you'll need another table. Start by running this code in the text box at the bottom of the console:
The Linker tool is used to filter target tables or plots to the data selected in the source. As shown below, the instructions pop up in the UI. Click on a column, then click on additional column(s) and/or plots to link them, and click Done.
Once the source column (in this case, USym in quotes) is linked to the target column (in this case, Sym in trades), the target column will be filtered to a value selected in the source column. Double-clicking on values in the source column causes the target column to display only the selected value. Any other tables, plots, and widgets derived from either of these tables will also reflect this filter.
Share a dashboard
The previous steps in this guide created a custom layout with tables, plots, filters, and linked tables in a Code Studio. Components can only be added to a dashboard if they are sourced from a Persistent Query (PQ). Thus, in order to share a dashboard, you must first create a PQ.
Create a PQ by creating a new file, then copying the two queries presented above into the file:
When saving this file, click the PQ+ button to save it as a PQ. From there, you can import the tables from the PQ into your dashboard, as well as filter, link, and manipulate the data as you like.
Once the dashboard is complete, you can share it with other users. To share an open dashboard, click the Sharing button in the top navigation bar.

Add one or more users or groups the the Invited Users list. The example below shares a dashboard with allusers so that anyone with access to your Deephaven instance can see it in their dashboard list under both All Dashboards and Shared with Me.
Once a shared user opens the dashboard, they'll be notified if the owner has made changes to it. They can choose to update now or later.
The permissions and update-flows between the Owners and the Users of shared dashboards are detailed in the Sharing Dashboards section of the Deephaven documentation.
Next steps
For an in-depth guide on how to use dashboards, including importing and exporting dashboards, see Dashboards. See Customizing Your Layout for a full guide to reorganizing your dashboard.