Code Studio errors
Code Studio errors are issues that occur when executing commands in the Code Studio interactive environment. These errors typically appear as inline exceptions directly in your code execution results, allowing for immediate identification and troubleshooting during development.
Understanding Code Studio errors is essential for efficient data exploration and query development. Unlike Persistent Query failures, most Code Studio errors don't crash the process, making them easier to diagnose and fix as part of the natural development workflow. For help interpreting error messages, see the guide on reading and diagnosing stack traces.
Expand a stack trace
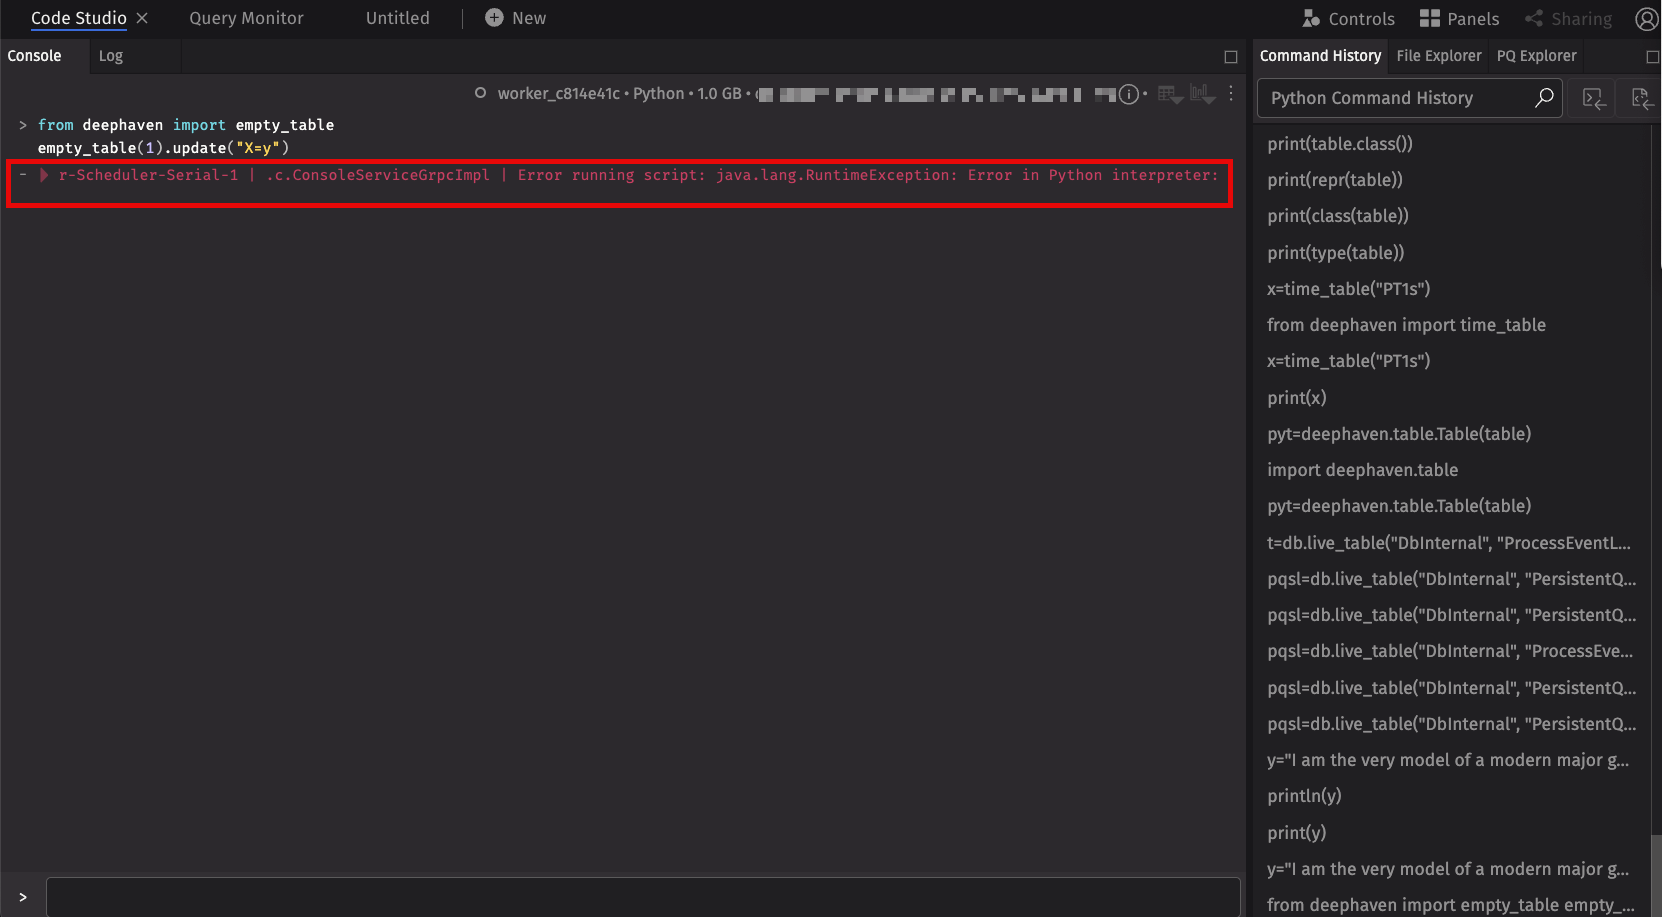
In this example, an update with an invalid column or variable name (y) fails.
From the console
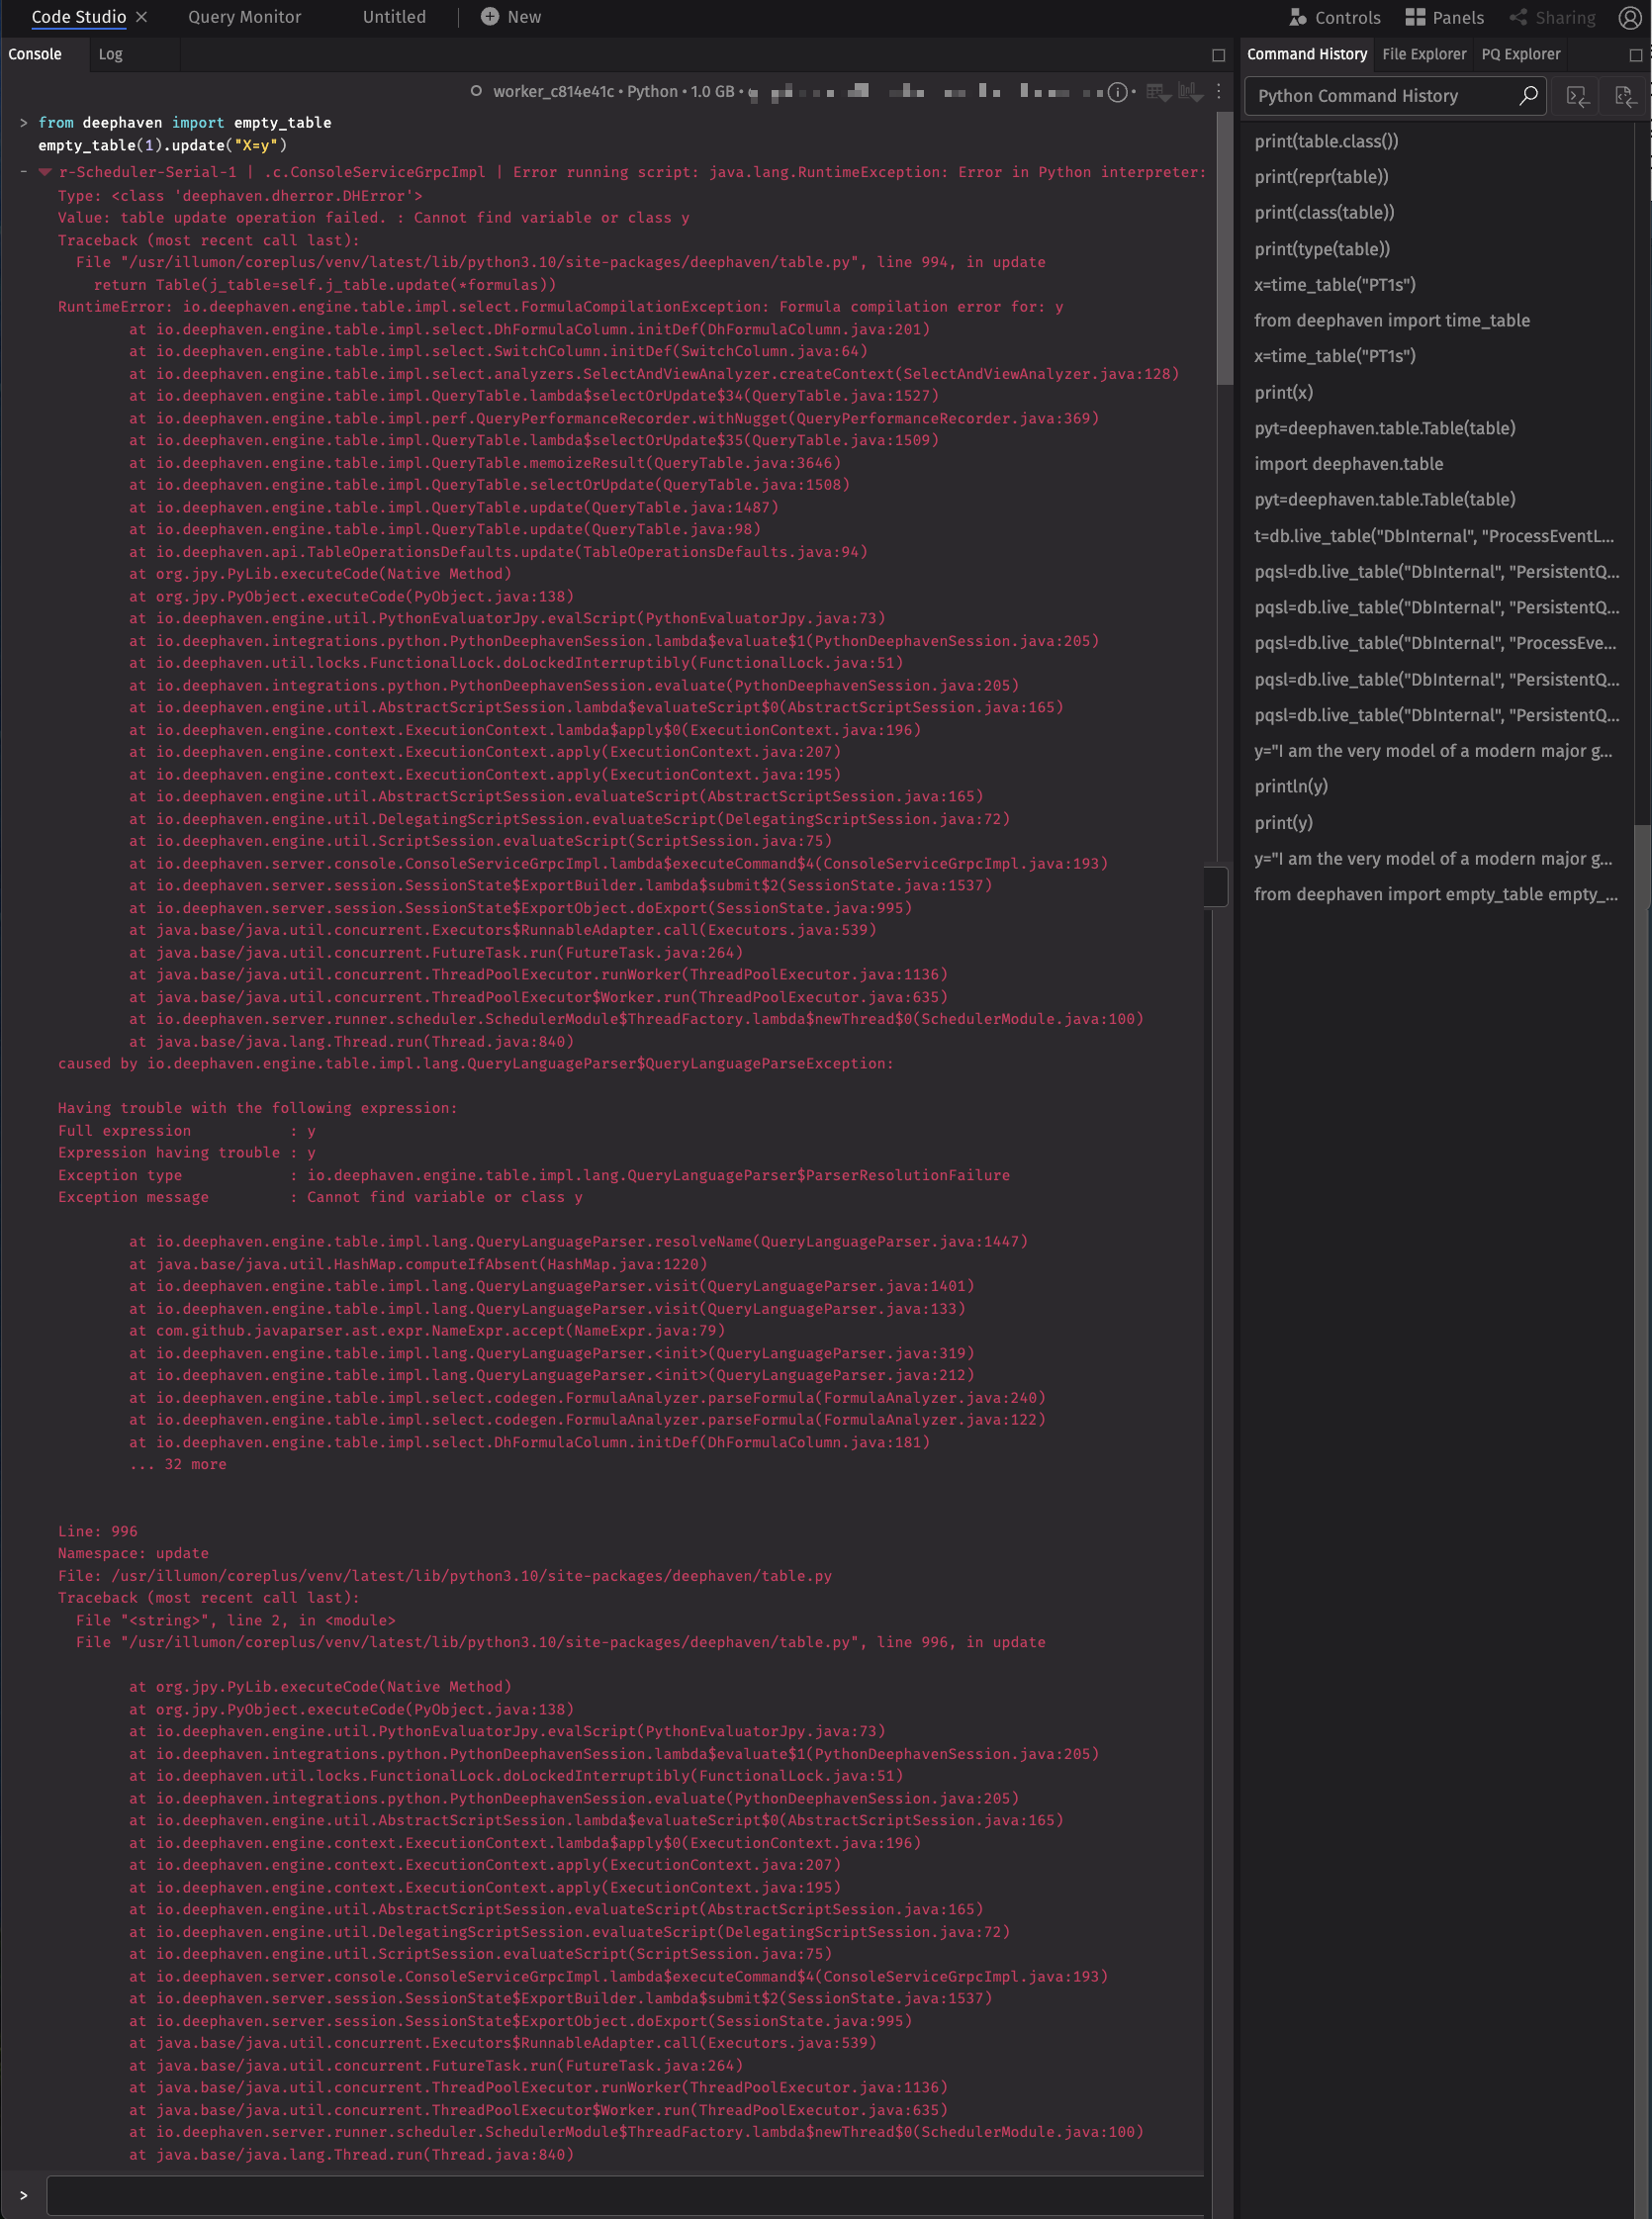
The Code Studio only displays the first line of the stack trace. You can click the red arrow next to the first line to expand it. In this case, we can see the message "table update operation failed: Cannot find variable or class y."
From the Process Event Log
The text of the stack trace also exists in the ProcessEventLog table and can be found by filtering the Process column using the worker name (highlighted in green).
From the Log panel
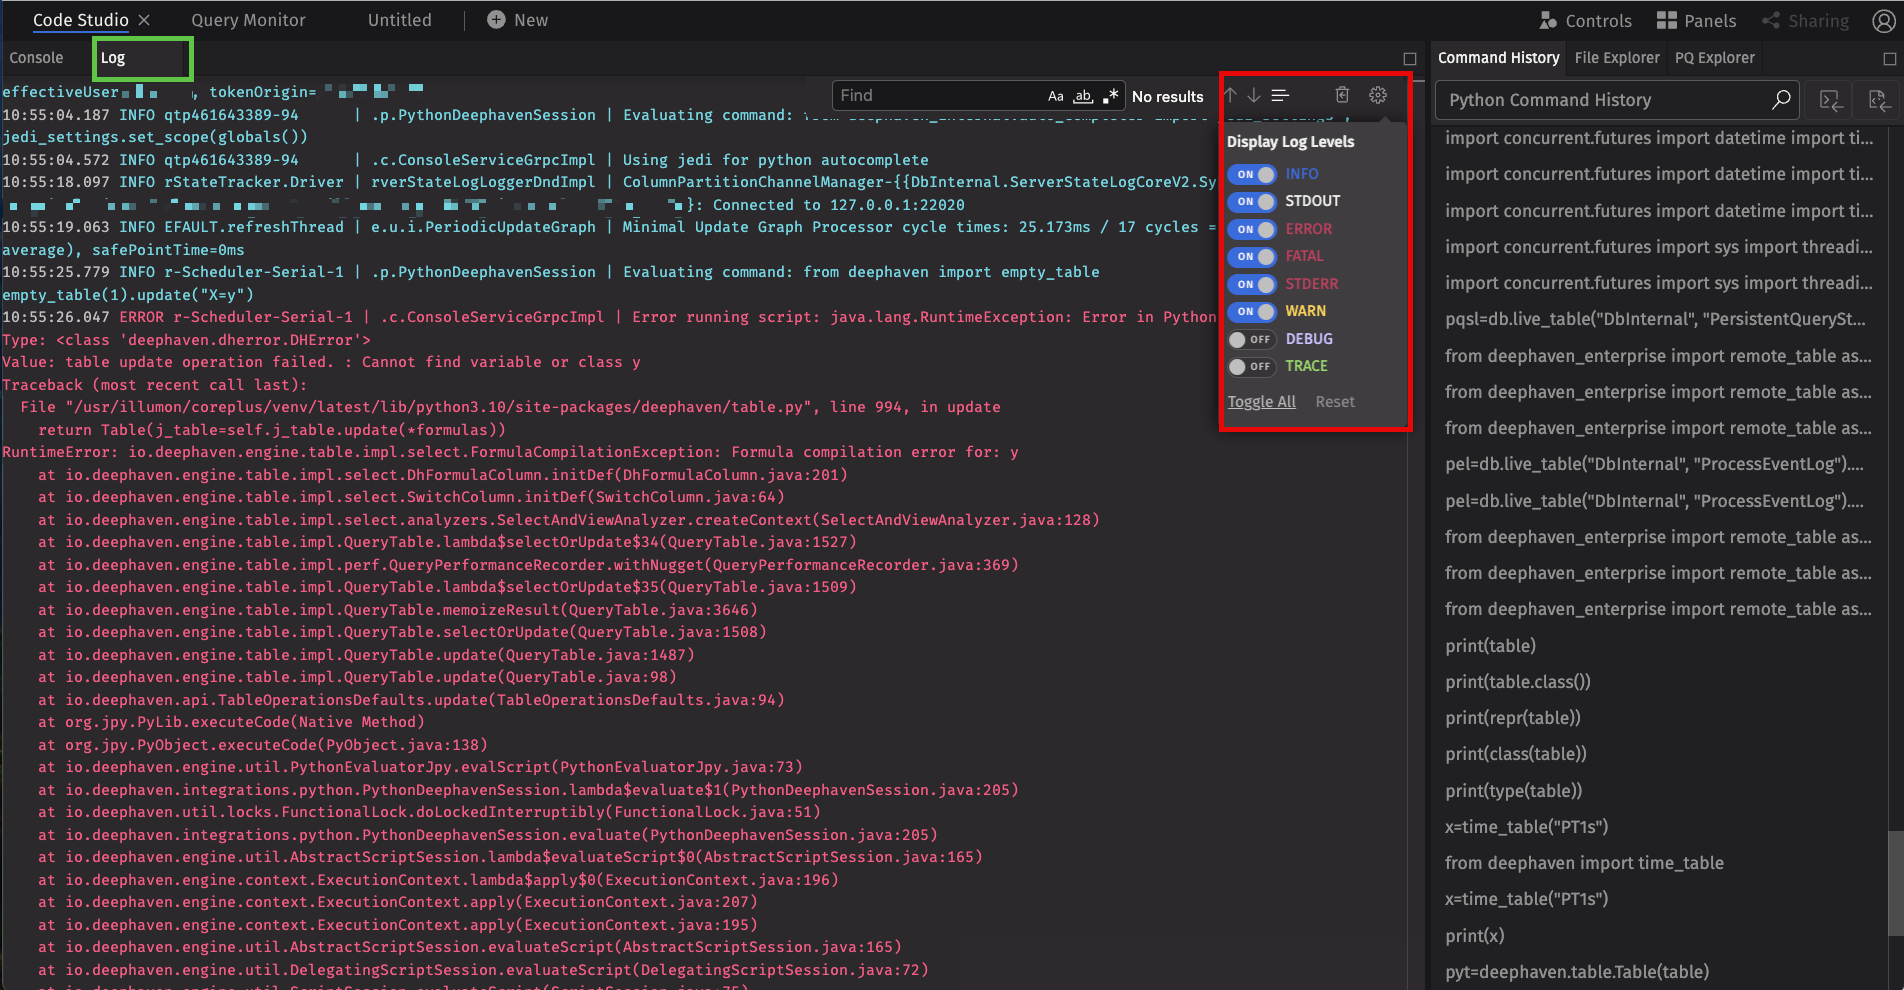
You can also click the Log tab (highlighted in green) to view stack traces logged within the worker. If more context is needed, it may be helpful to display the "INFO" log-level messages by clicking the gear at the top right of the log panel to turn on or off the display of various log levels (highlighted in red).
Locate an undisplayed stack trace
Tables created from Code Studios update in the background, and errors can occur after initialization while a table is being updated. In these cases, the stack trace is still printed to the Code Studio but is not displayed with the command that caused the error. Instead, it is displayed at the time the error occurred.
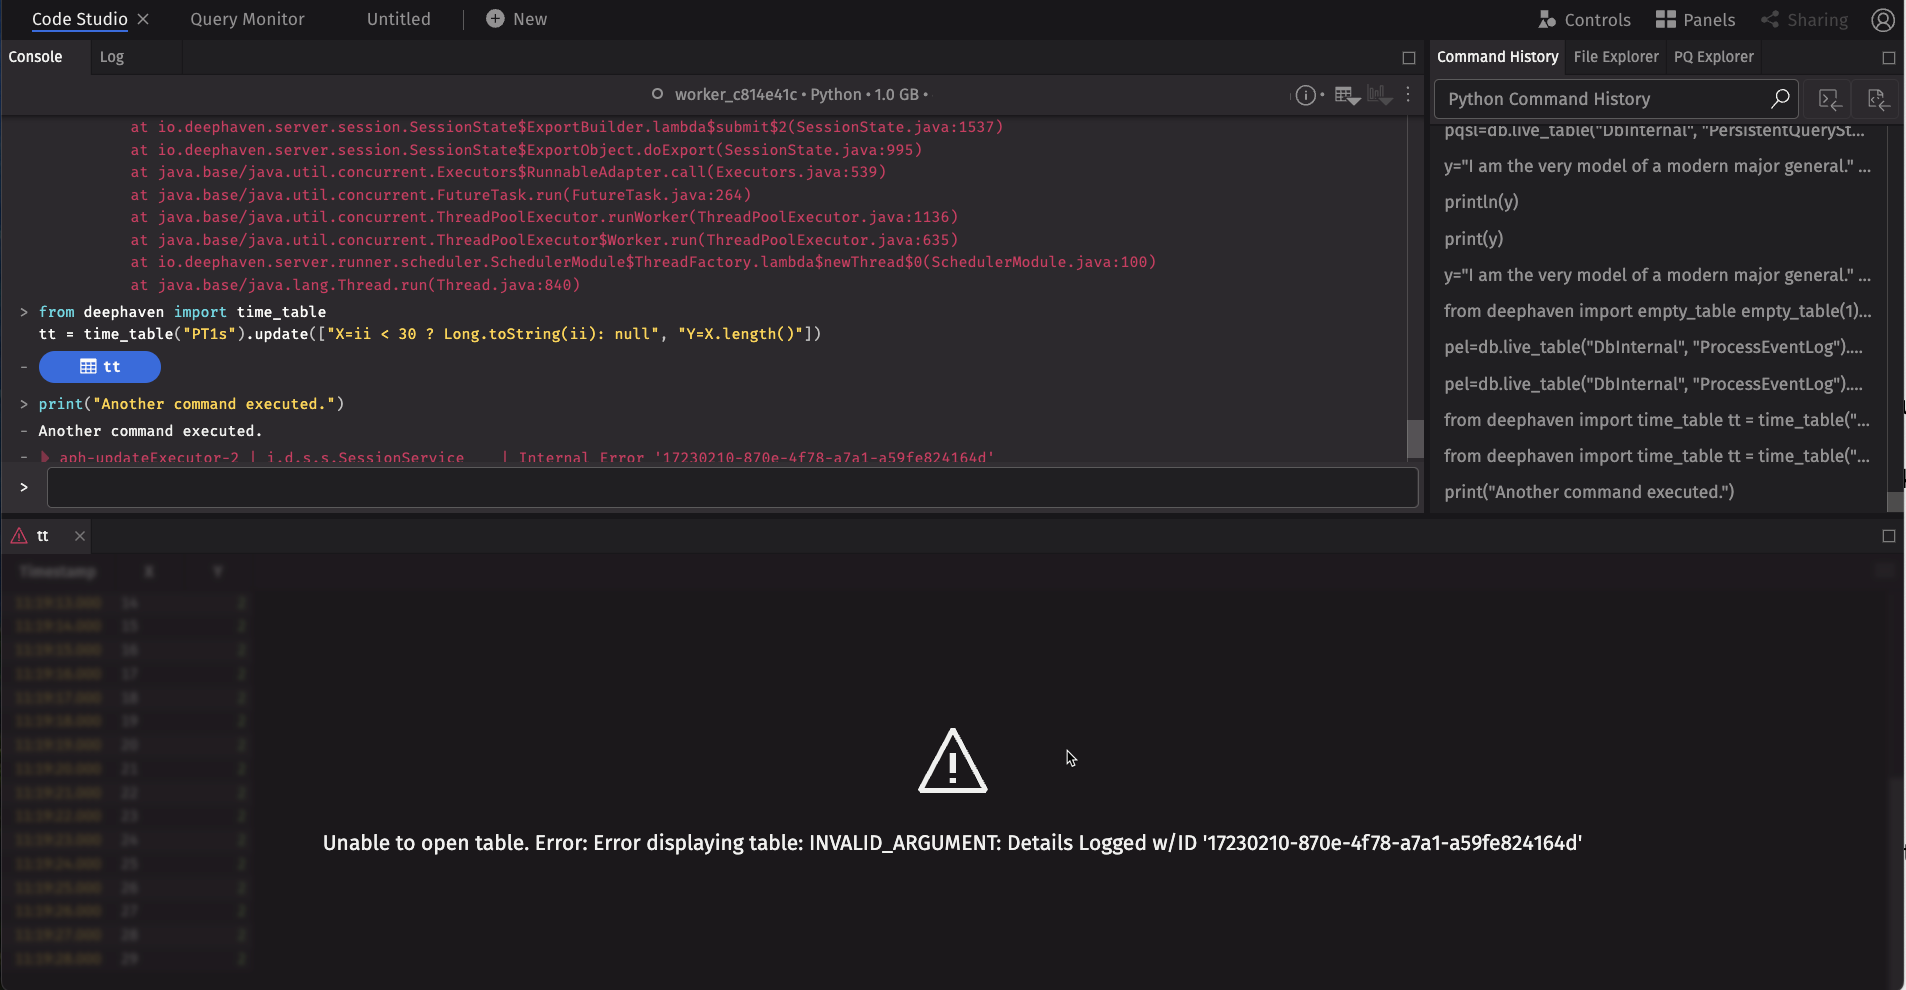
Any tables with an error have an exclamation point icon and are hidden behind a message containing a unique ID for that error. You can search the log panel or ProcessEventLog for these error IDs. In this case, the error can be found with:
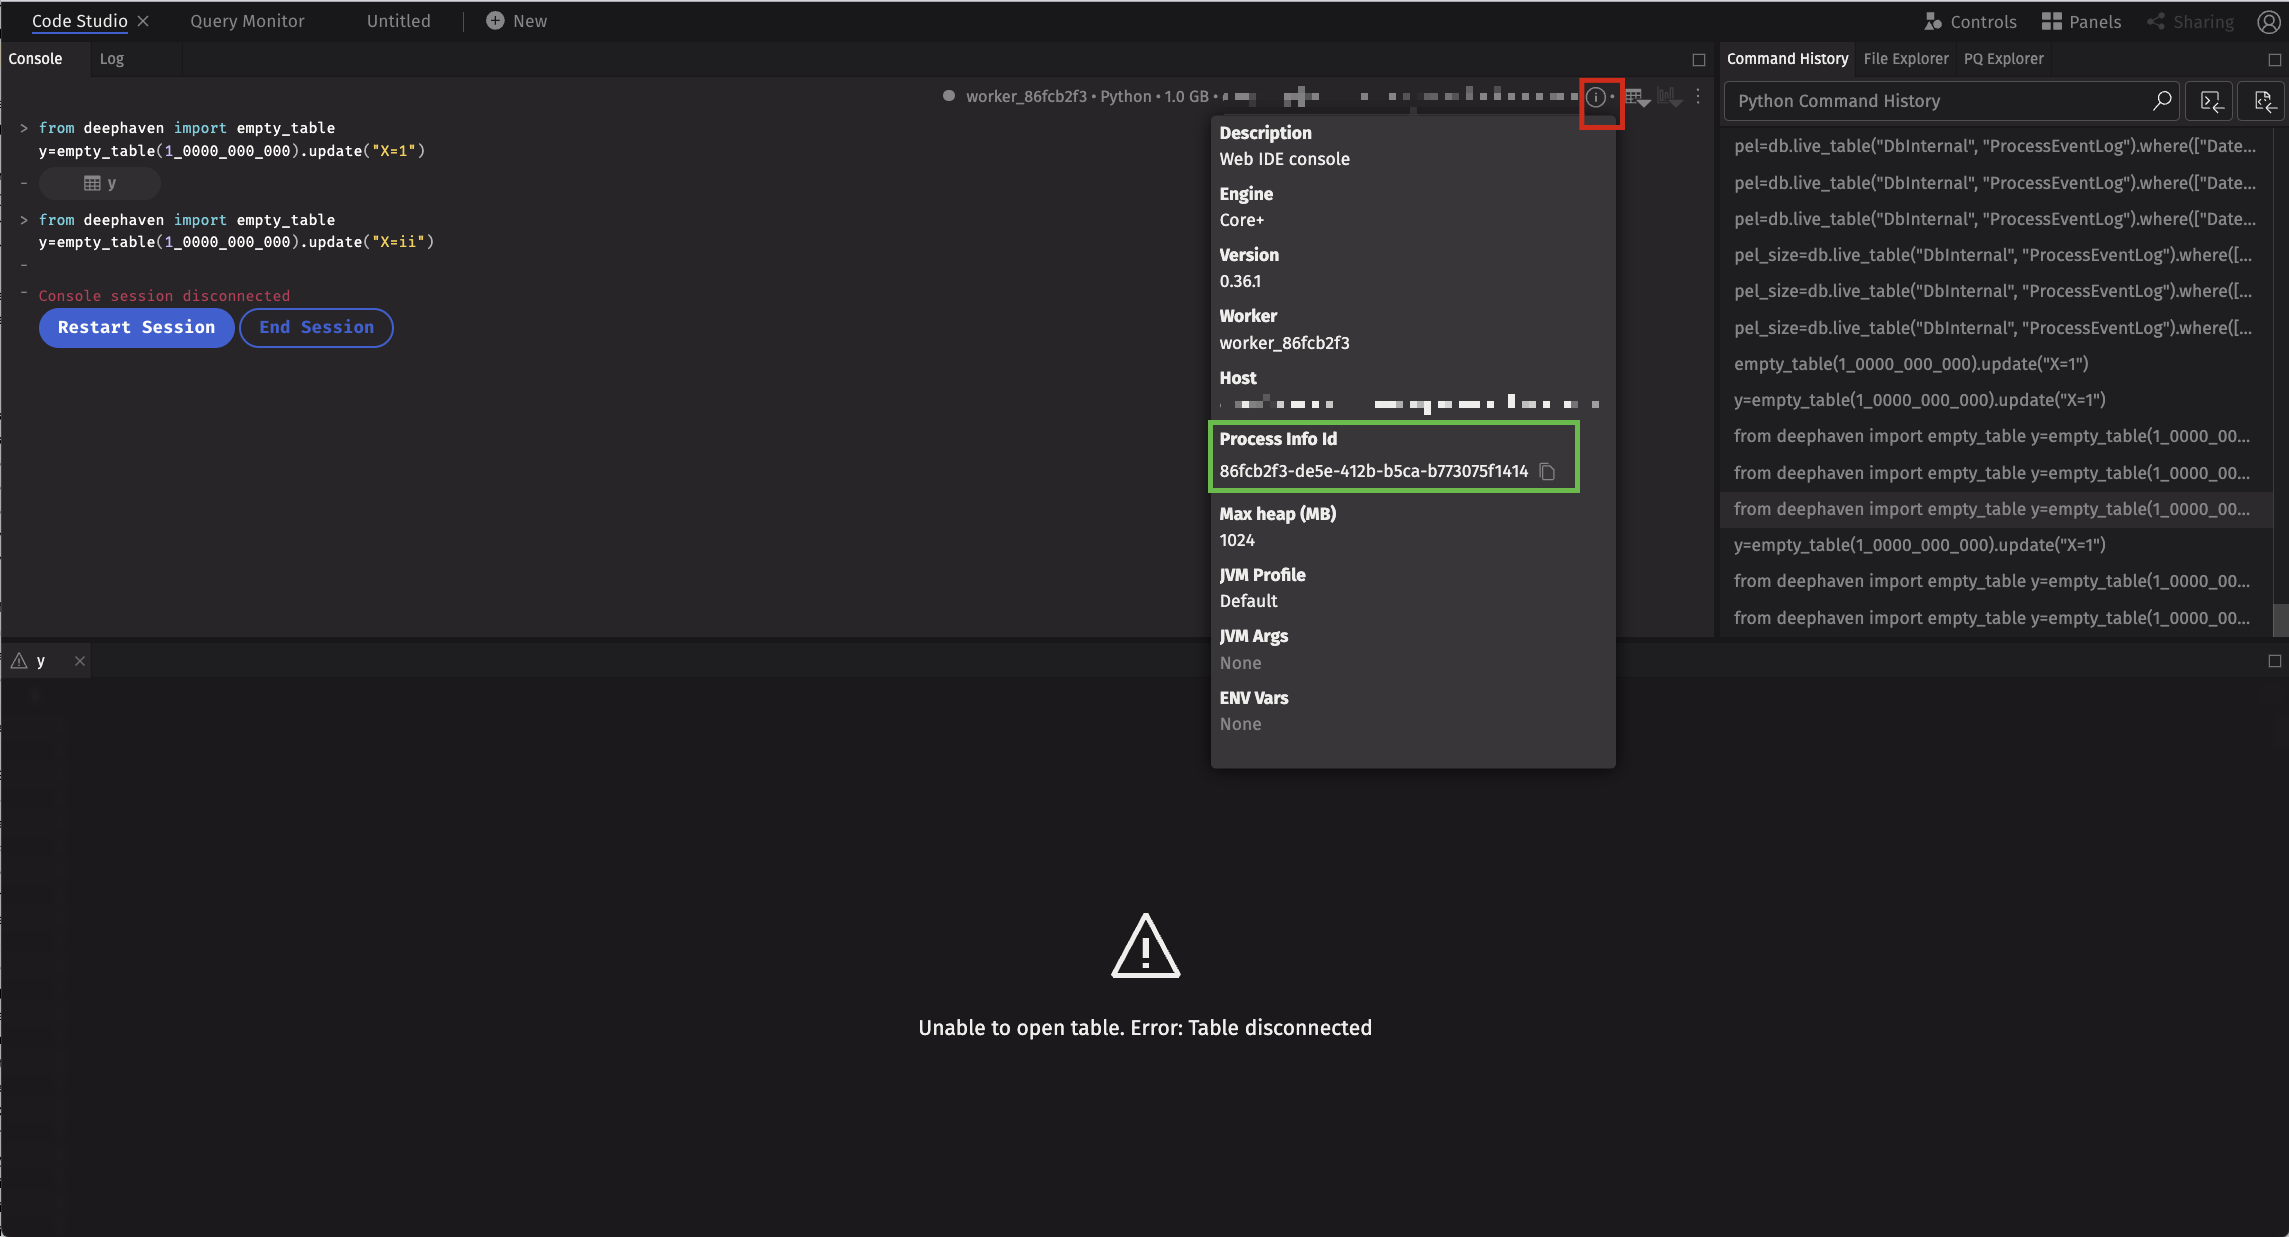
Each time you attempt to reopen the same table by clicking its name, a similar error is displayed. This is because the underlying Deephaven object can no longer be updated and no longer contains valid data.
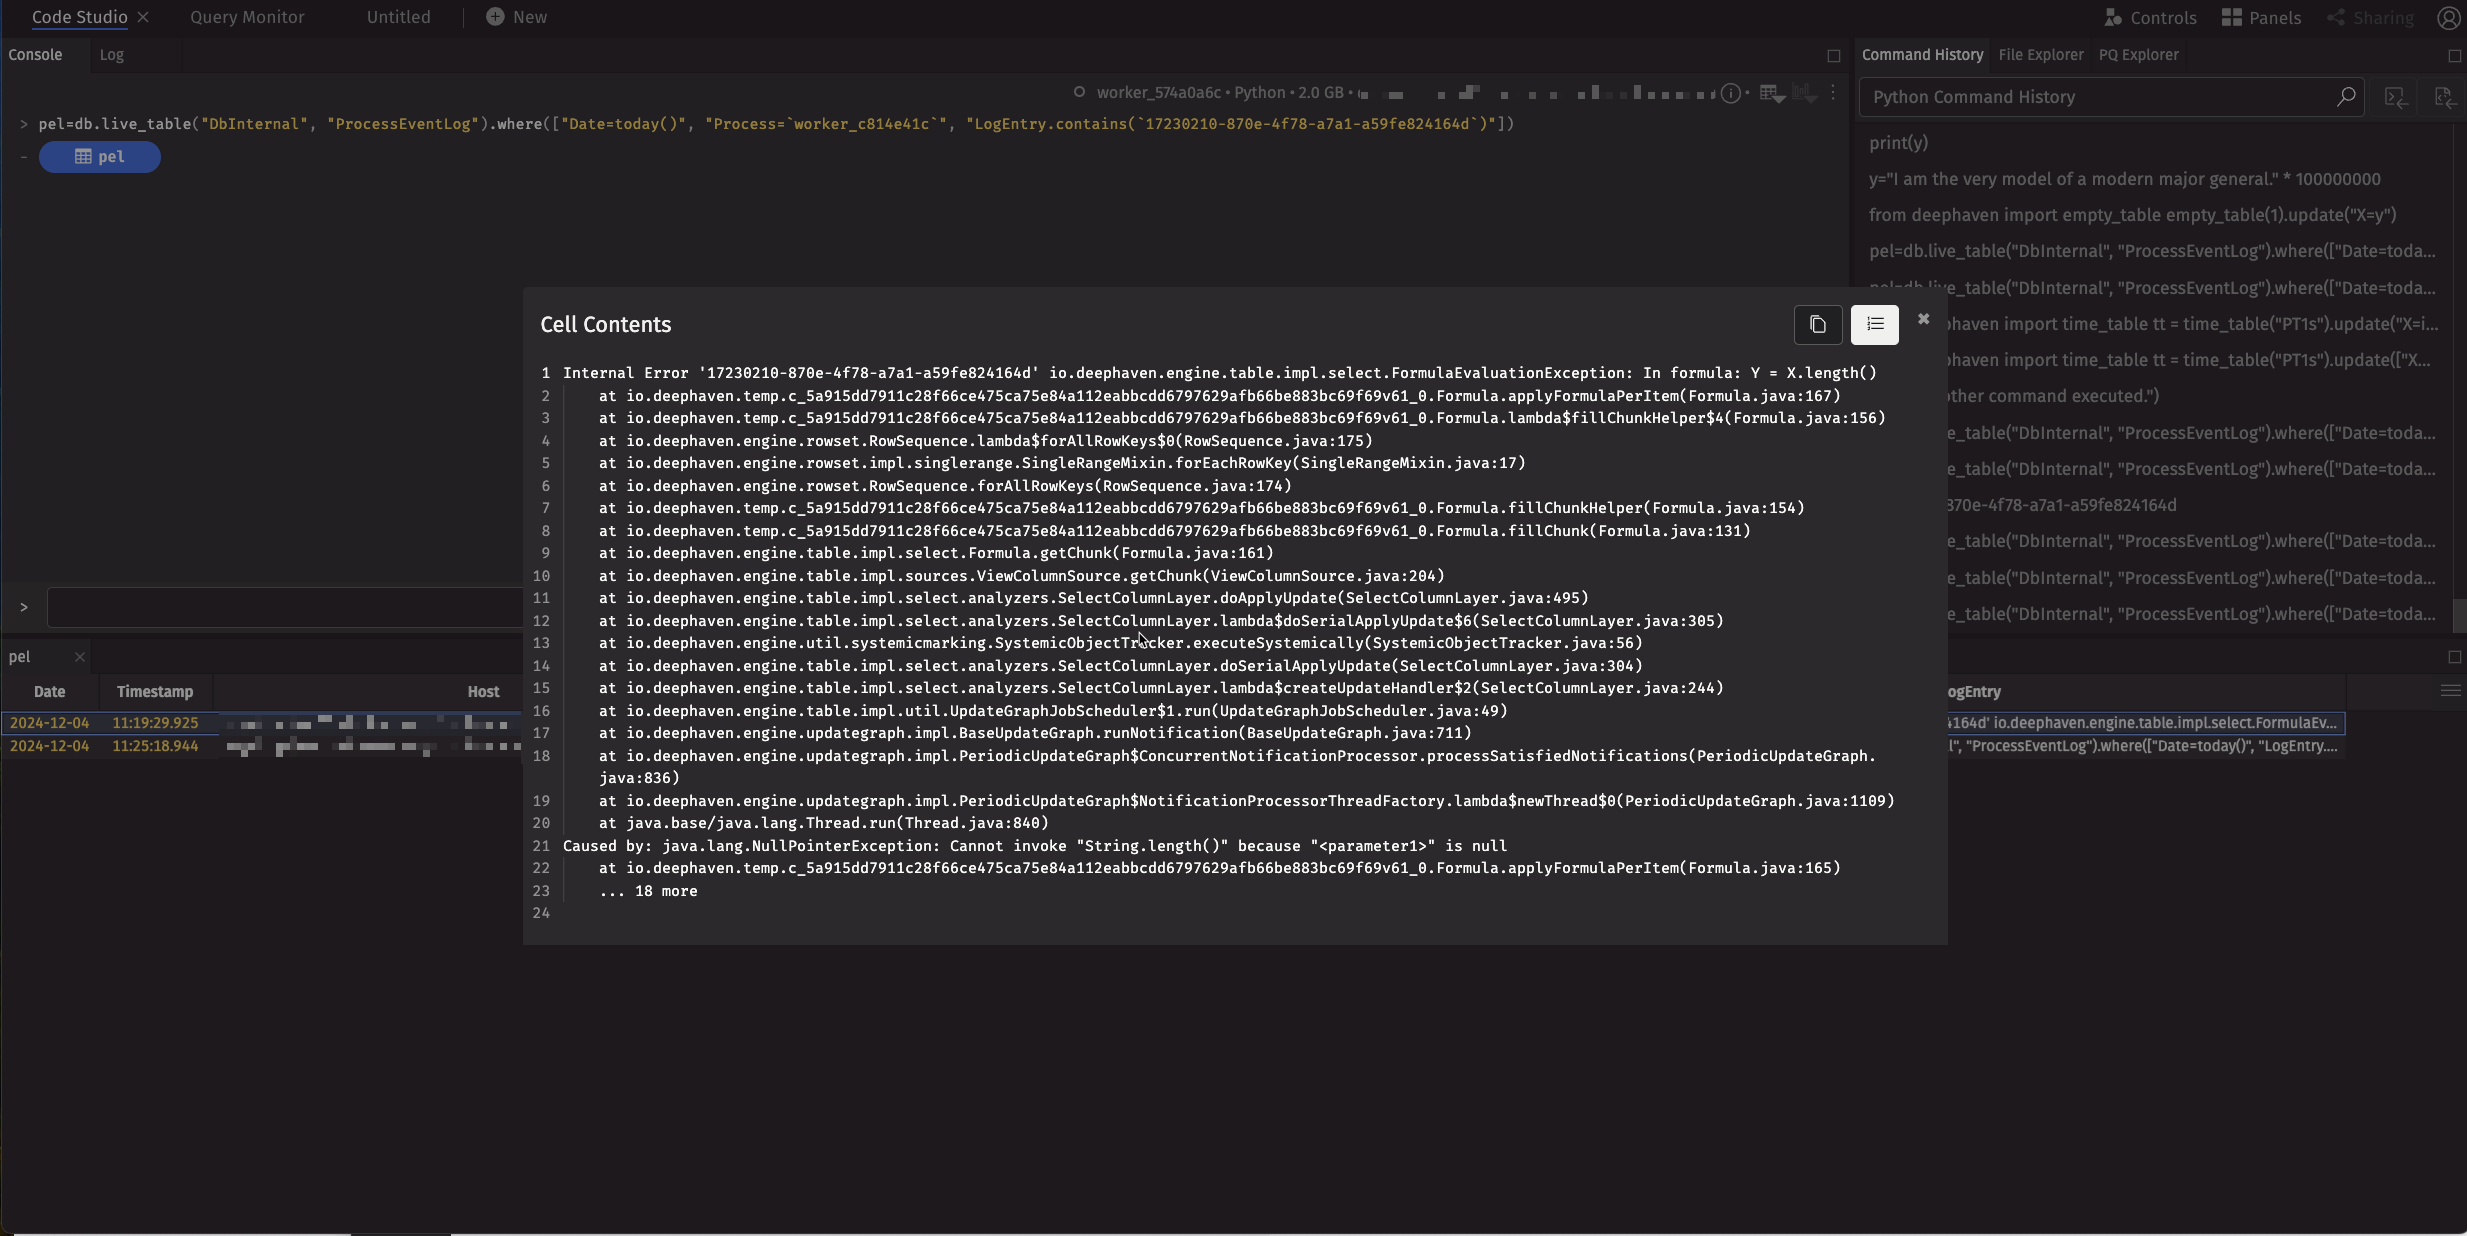
Errors can occur not only from the Update Graph, but due to a client interacting with the worker. For example, the previous example crashed after the table updated for 30 seconds. In this example, the table is static but uses lazy evaluation of the formula:
When a user scrolls past the first 1000 rows, X.length() is evaluated where X is null, causing an error. The error is printed to the console and the table is marked as failed. In this case, the table can be reopened because the underlying Deephaven object is still updating.
In some circumstances, the worker process backing a Code Studio may crash, in which case you will see an error that says "Console session disconnected". This happens for many of the same reasons a Persistent query can enter the Disconnected state. To gather more information, hover over the i icon (highlighted in red) and copy the worker's ProcessInfoId (highlighted in green). Use a new Code Studio to search for more information in the ProcessEventLog.