Excessive initialization time
Sometimes, a query does not crash but takes a very long time to initialize, possibly even exceeding its initialization timeout. If the query initialization completes, then you should use the Performance Overview query and follow the steps on troubleshooting query performance.
When the query fails to initialize with a timeout, the performance data is unavailable and alternative steps are necessary to gain insight into slow operations. The steps for improving performance remain the same as described in the article on troubleshooting query performance.
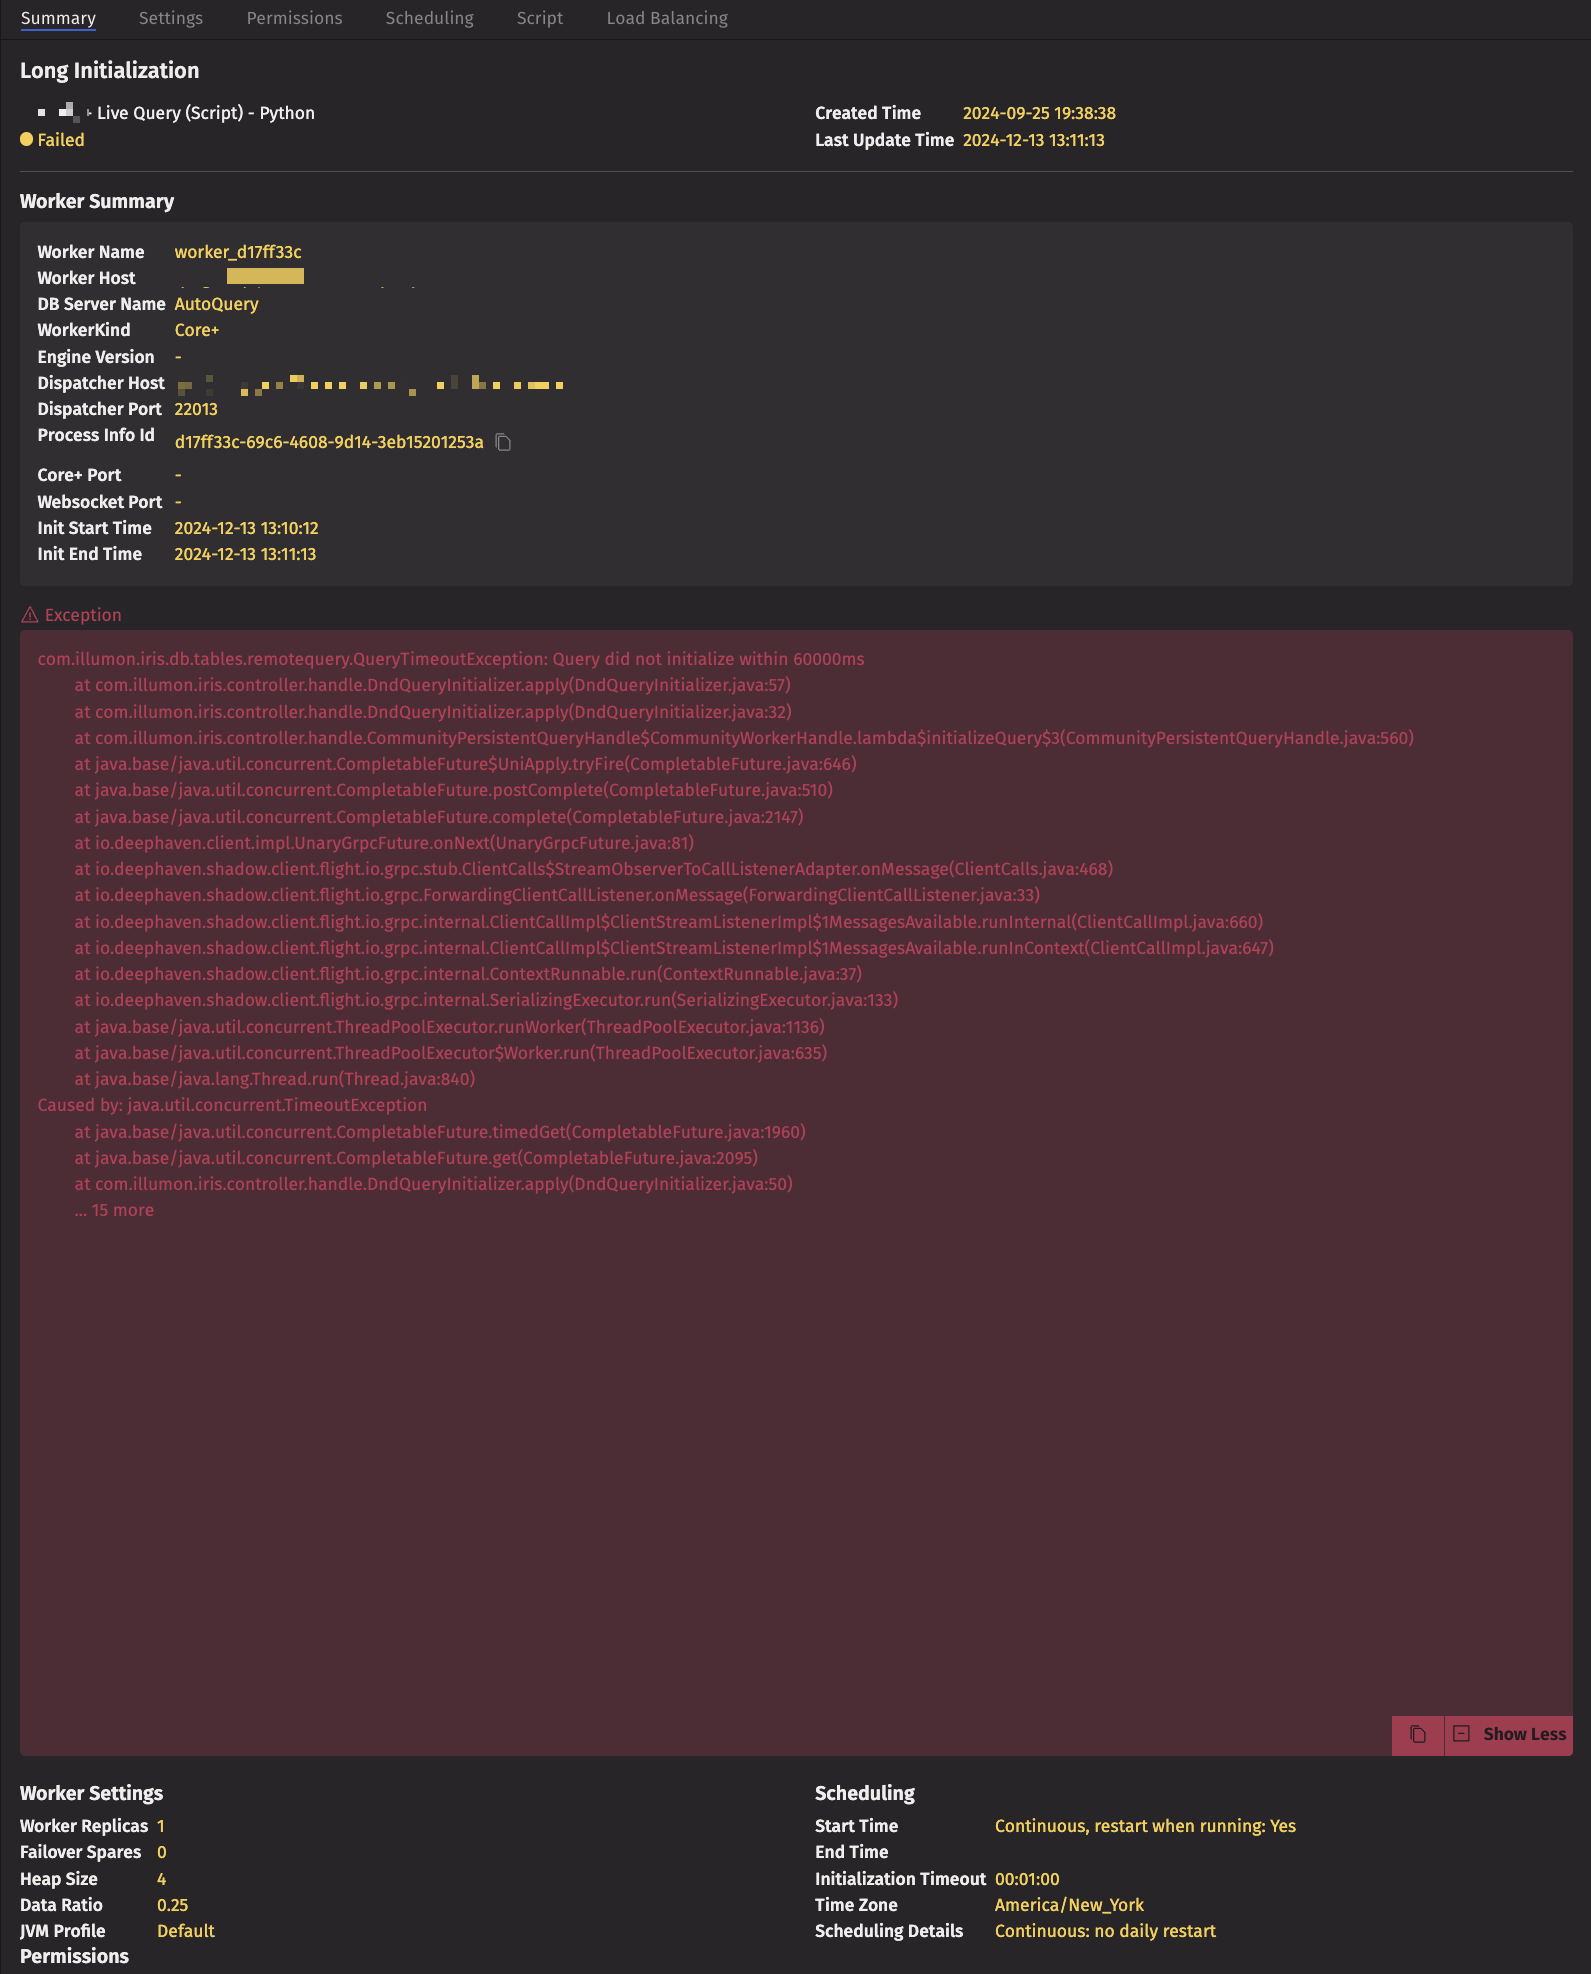
For example, the following screenshot from the Query Monitor shows a query that failed to initialize with a timeout:
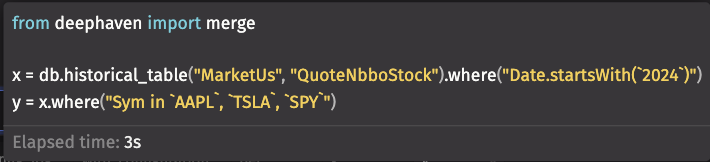
This query's script was the following:
x = db.historicalTable("MarketUs", "QuoteNbboStock").where("Date.startsWith(`2024`)")
y = x.where("Sym in `AAPL`, `TSLA`, `SPY`")
c = y.countBy("N", "Sym", "Date")
from deephaven import merge
x = db.historical_table("MarketUs", "QuoteNbboStock").where("Date.startsWith(`2024`)")
y = x.where("Sym in `AAPL`, `TSLA`, `SPY`")
c = y.count_by("N", ["Sym", "Date"])
From the error message on the Query Monitor, it is unclear what operation is causing the timeout. Even though this script is simple, there are several possibilities:
- Retrieving metadata about the table.
- The
where
filter onSym
. - The aggregation to count the number of rows for each
Sym
andDate
. - The time for any single operation does not overwhelm the others, but the combination takes longer than expected.
The first step in diagnosing a Persistent Query timeout is to view the ProcessEventLog
for that query. In this case, we can retrieve it as follows:
pel = db.liveTable("DbInternal", "ProcessEventLog").where("Date=today()", "ProcessInfoId=`d17ff33c-69c6-4608-9d14-3eb15201253a`")
.sort("Timestamp")
.dropColumns("Host", "Level", "Process", "ProcessInfoId", "AuthenticatedUser", "EffectiveUser")
pel = (
db.live_table("DbInternal", "ProcessEventLog")
.where(["Date=today()", "ProcessInfoId=`d17ff33c-69c6-4608-9d14-3eb15201253a`"])
.sort("Timestamp")
.drop_columns(
[
"Host",
"Level",
"Process",
"ProcessInfoId",
"AuthenticatedUser",
"EffectiveUser",
]
)
)
By scrolling the log, you can find a full thread dump that the controller initiated before terminating the query. Searching for the DeephavenApiServer-Scheduler-Serial
thread that is responsible for executing the query reveals the following stack trace (line numbers added for clarity):
1 "DeephavenApiServer-Scheduler-Serial-1" #92 daemon prio=5 os_prio=0 cpu=31817.47ms elapsed=60.03s tid=0x00007f8ce001d170 nid=0x394ce0 runnable [0x00007f8c403e4000]
2 java.lang.Thread.State: RUNNABLE
3 at sun.nio.ch.FileDispatcherImpl.pread0(java.base@17.0.10/Native Method)
4 at sun.nio.ch.FileDispatcherImpl.pread(java.base@17.0.10/FileDispatcherImpl.java:54)
5 at sun.nio.ch.IOUtil.readIntoNativeBuffer(java.base@17.0.10/IOUtil.java:328)
6 at sun.nio.ch.IOUtil.read(java.base@17.0.10/IOUtil.java:296)
7 at sun.nio.ch.IOUtil.read(java.base@17.0.10/IOUtil.java:273)
8 at sun.nio.ch.FileChannelImpl.readInternal(java.base@17.0.10/FileChannelImpl.java:839)
9 at sun.nio.ch.FileChannelImpl.read(java.base@17.0.10/FileChannelImpl.java:824)
10 at io.deephaven.shadow.enterprise.com.illumon.iris.db.util.file.FileHandle.read(FileHandle.java:144)
11 at io.deephaven.shadow.enterprise.com.illumon.iris.db.v2.locations.local.LocalFileAccessor.read(LocalFileAccessor.java:72)
12 at io.deephaven.shadow.enterprise.com.illumon.iris.db.v2.locations.OffsetFileAccessor.read(OffsetFileAccessor.java:36)
13 at io.deephaven.shadow.enterprise.com.illumon.iris.db.v2.locations.LazyFileAccessor.read(LazyFileAccessor.java:45)
14 at io.deephaven.shadow.enterprise.com.illumon.iris.db.v2.locations.LazyFileAccessor.read(LazyFileAccessor.java:45)
15 at io.deephaven.shadow.enterprise.com.illumon.iris.db.v2.locations.FileDataBufferStore.loadBuffer(FileDataBufferStore.java:633)
16 - locked <0x00000007459d09b0> (a io.deephaven.shadow.enterprise.com.illumon.iris.db.util.caching.redesign.DataBufferHolder)
17 at io.deephaven.shadow.enterprise.com.illumon.iris.db.v2.locations.FileDataBufferStore.maybeLoadBuffer(FileDataBufferStore.java:446)
18 at io.deephaven.shadow.enterprise.com.illumon.iris.db.v2.locations.FileDataBufferStore.provideBufferReferenceByIndex(FileDataBufferStore.java:385)
19 at io.deephaven.enterprise.sources.regioned.impl.ColumnRegionFillContext.getBuffer(ColumnRegionFillContext.java:43)
20 at io.deephaven.enterprise.sources.regioned.impl.BufferedPageIntAsLong.fillChunkAppend(BufferedPageIntAsLong.java:49)
21 at io.deephaven.engine.page.Page$WithDefaults.fillChunkAppend(Page.java:61)
22 at io.deephaven.engine.page.PageStore.fillChunkAppend(PageStore.java:101)
23 at io.deephaven.engine.page.PageStore.doFillChunkAppend(PageStore.java:121)
24 at io.deephaven.engine.page.PageStore.getChunk(PageStore.java:48)
25 at io.deephaven.enterprise.sources.regioned.impl.ColumnRegionObjectWithDictionary.readFromDictionaryAndApplyLookup(ColumnRegionObjectWithDictionary.java:99)
26 at io.deephaven.enterprise.sources.regioned.impl.ColumnRegionObjectWithDictionary.fillChunkAppend(ColumnRegionObjectWithDictionary.java:90)
27 at io.deephaven.engine.page.Page$WithDefaults.fillChunk(Page.java:70)
28 at io.deephaven.engine.table.impl.DefaultChunkSource.getChunkByFilling(DefaultChunkSource.java:44)
29 at io.deephaven.engine.table.impl.DefaultChunkSource.getChunk(DefaultChunkSource.java:31)
30 at io.deephaven.engine.page.PageStore.getChunk(PageStore.java:45)
31 at io.deephaven.engine.table.impl.util.TypedHasherUtil.getKeyChunks(TypedHasherUtil.java:33)
32 at io.deephaven.engine.table.impl.by.OperatorAggregationStateManagerOpenAddressedBase.buildTable(OperatorAggregationStateManagerOpenAddressedBase.java:78)
33 at io.deephaven.engine.table.impl.by.StaticChunkedOperatorAggregationStateManagerOpenAddressedBase.add(StaticChunkedOperatorAggregationStateManagerOpenAddressedBase.java:56)
34 at io.deephaven.engine.table.impl.by.ChunkedOperatorAggregationHelper.initialBucketedKeyAddition(ChunkedOperatorAggregationHelper.java:1877)
35 at io.deephaven.engine.table.impl.by.ChunkedOperatorAggregationHelper.aggregation(ChunkedOperatorAggregationHelper.java:200)
36 at io.deephaven.engine.table.impl.by.ChunkedOperatorAggregationHelper.lambda$aggregation$2(ChunkedOperatorAggregationHelper.java:130)
37 at io.deephaven.engine.table.impl.by.ChunkedOperatorAggregationHelper$$Lambda$1999/0x00007f8d58e12588.call(Unknown Source)
38 at io.deephaven.engine.table.impl.BaseTable.initializeWithSnapshot(BaseTable.java:1293)
39 at io.deephaven.engine.table.impl.by.ChunkedOperatorAggregationHelper.lambda$aggregation$3(ChunkedOperatorAggregationHelper.java:127)
40 at io.deephaven.engine.table.impl.by.ChunkedOperatorAggregationHelper$$Lambda$1995/0x00007f8d58e11cc8.get(Unknown Source)
41 at io.deephaven.engine.liveness.LivenessScopeStack.computeEnclosed(LivenessScopeStack.java:179)
42 at io.deephaven.engine.table.impl.by.ChunkedOperatorAggregationHelper.aggregation(ChunkedOperatorAggregationHelper.java:115)
43 at io.deephaven.engine.table.impl.by.ChunkedOperatorAggregationHelper.aggregation(ChunkedOperatorAggregationHelper.java:70)
44 at io.deephaven.engine.table.impl.QueryTable.lambda$aggNoMemo$18(QueryTable.java:855)
45 at io.deephaven.engine.table.impl.QueryTable$$Lambda$1992/0x00007f8d58e10b50.get(Unknown Source)
46 at io.deephaven.engine.table.impl.perf.QueryPerformanceRecorder.withNugget(QueryPerformanceRecorder.java:369)
47 at io.deephaven.engine.table.impl.QueryTable.aggNoMemo(QueryTable.java:854)
48 at io.deephaven.engine.table.impl.QueryTable.lambda$aggBy$17(QueryTable.java:830)
49 at io.deephaven.engine.table.impl.QueryTable$$Lambda$2136/0x00007f8d58e54b38.get(Unknown Source)
50 at io.deephaven.engine.table.impl.QueryTable$MemoizedResult.getOrCompute(QueryTable.java:3681)
51 - locked <0x0000000732c30bc8> (a io.deephaven.engine.table.impl.QueryTable$MemoizedResult)
52 at io.deephaven.engine.table.impl.QueryTable.memoizeResult(QueryTable.java:3650)
53 at io.deephaven.engine.table.impl.QueryTable.aggBy(QueryTable.java:830)
54 at io.deephaven.engine.table.impl.QueryTable$FilteredTable.aggBy(QueryTable.java:973)
55 at io.deephaven.api.TableOperationsDefaults.aggBy(TableOperationsDefaults.java:337)
56 at io.deephaven.api.TableOperationsDefaults.aggBy(TableOperationsDefaults.java:324)
57 at io.deephaven.api.TableOperationsDefaults.countBy(TableOperationsDefaults.java:412)
58 at io.deephaven.api.TableOperationsDefaults.countBy(TableOperationsDefaults.java:406)
59 at org.jpy.PyLib.executeCode(Native Method)
60 at org.jpy.PyObject.executeCode(PyObject.java:138)
61 at io.deephaven.engine.util.PythonEvaluatorJpy.evalScript(PythonEvaluatorJpy.java:73)
62 at io.deephaven.integrations.python.PythonDeephavenSession.lambda$evaluate$1(PythonDeephavenSession.java:205)
63 at io.deephaven.integrations.python.PythonDeephavenSession$$Lambda$1087/0x00007f8d58a83c70.run(Unknown Source)
64 at io.deephaven.util.locks.FunctionalLock.doLockedInterruptibly(FunctionalLock.java:51)
65 at io.deephaven.integrations.python.PythonDeephavenSession.evaluate(PythonDeephavenSession.java:205)
66 at io.deephaven.engine.util.AbstractScriptSession.lambda$evaluateScript$0(AbstractScriptSession.java:165)
67 at io.deephaven.engine.util.AbstractScriptSession$$Lambda$1086/0x00007f8d58a83848.run(Unknown Source)
68 at io.deephaven.engine.context.ExecutionContext.lambda$apply$0(ExecutionContext.java:196)
69 at io.deephaven.engine.context.ExecutionContext$$Lambda$623/0x00007f8d5870faf8.get(Unknown Source)
70 at io.deephaven.engine.context.ExecutionContext.apply(ExecutionContext.java:207)
71 at io.deephaven.engine.context.ExecutionContext.apply(ExecutionContext.java:195)
72 at io.deephaven.engine.util.AbstractScriptSession.evaluateScript(AbstractScriptSession.java:165)
73 - locked <0x0000000706db48b8> (a io.deephaven.integrations.python.PythonDeephavenSession)
74 at io.deephaven.engine.util.DelegatingScriptSession.evaluateScript(DelegatingScriptSession.java:72)
75 at io.deephaven.engine.util.ScriptSession.evaluateScript(ScriptSession.java:75)
76 at io.deephaven.server.console.ConsoleServiceGrpcImpl.lambda$executeCommand$4(ConsoleServiceGrpcImpl.java:193)
77 at io.deephaven.server.console.ConsoleServiceGrpcImpl$$Lambda$1283/0x00007f8d58ba6910.run(Unknown Source)
78 at io.deephaven.server.session.SessionState$ExportBuilder.lambda$submit$2(SessionState.java:1537)
79 at io.deephaven.server.session.SessionState$ExportBuilder$$Lambda$1284/0x00007f8d58ba6b38.call(Unknown Source)
80 at io.deephaven.server.session.SessionState$ExportObject.doExport(SessionState.java:995)
81 at io.deephaven.server.session.SessionState$ExportObject$$Lambda$1285/0x00007f8d58ba6d60.run(Unknown Source)
82 at java.util.concurrent.Executors$RunnableAdapter.call(java.base@17.0.10/Executors.java:539)
83 at java.util.concurrent.FutureTask.run(java.base@17.0.10/FutureTask.java:264)
84 at java.util.concurrent.ThreadPoolExecutor.runWorker(java.base@17.0.10/ThreadPoolExecutor.java:1136)
85 at java.util.concurrent.ThreadPoolExecutor$Worker.run(java.base@17.0.10/ThreadPoolExecutor.java:635)
86 at io.deephaven.server.runner.scheduler.SchedulerModule$ThreadFactory.lambda$newThread$0(SchedulerModule.java:100)
87 at io.deephaven.server.runner.scheduler.SchedulerModule$ThreadFactory$$Lambda$1091/0x00007f8d58a86878.run(Unknown Source)
88 at java.lang.Thread.run(java.base@17.0.10/Thread.java:840)
- Lines 2-9 indicate that the process is reading data using Java I/O primitives.
- Lines 10-30 are the Deephaven I/O layer.
- Lines 30-44 indicate that the process is performing an aggregation.
This points towards the count as the likely culprit. This is a piece of evidence, but not definitive. The where
filter could have taken most of the time, and the aggregation could simply be starting to execute. In some cases, it is reasonable to increase the execution timeout - the query may be slow but can still be completed when given sufficient time. In this case, if the timeout is increased, we can run Performance Overview on the query:
performanceOverviewByPiid("d17ff33c-69c6-4608-9d14-3eb15201253a")
performance_overview(process_info_id="d17ff33c-69c6-4608-9d14-3eb15201253a")
This yields the following QueryOperationPerformance
table:
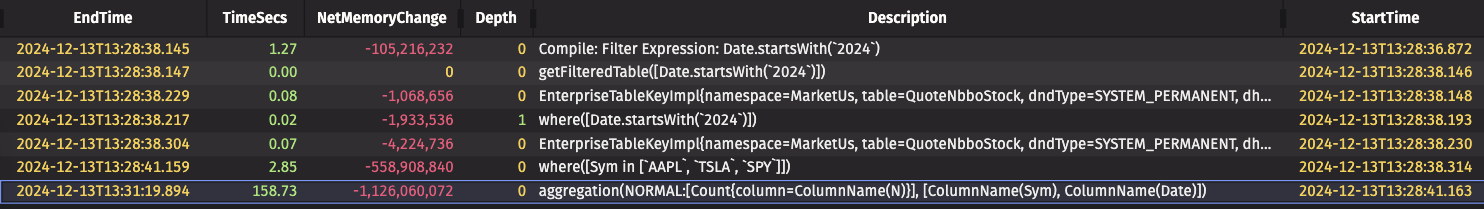
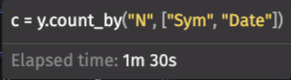
If you cannot wait for the query to completely initialize, one simple way to determine the slow operation is to add print statements before and after each operation and then monitor the ProcessEventLog
. Another method to narrow down which part of the query is slow is to run snippets of the query one at a time in a Code Studio, using the elapsed time reported for each section of the query, showing that the count is the bulk of execution time:
If you have administrative access to the server, you may also cause a thread dump to be taken by sending Unix signal 3
to the worker process. You can monitor the execution of the DeephavenApiServer-Scheduler-Serial-1
thread to identify what kind of operation is currently executing. Similarly, you can attach a profiler or debugger.