Persistent Query failures
To debug a failed Persistent Query (PQ), start by checking its status using either the Query Monitor or the PersistentQueryStateLog internal table. The Query Monitor provides the current status of the query, while the PersistentQueryStateLog table (located in the DbInternal namespace) records every change in the query's status.
Determine State with the Query Monitor
To find your Failed query in the Query Monitor, search by name or use one of the status filters. Across the top are "Running" and "Failed" statuses. Click "Failed". Locate the query in the list on the left and select it view the detailed status in the panel on the right. This example examines the query named No Resources.
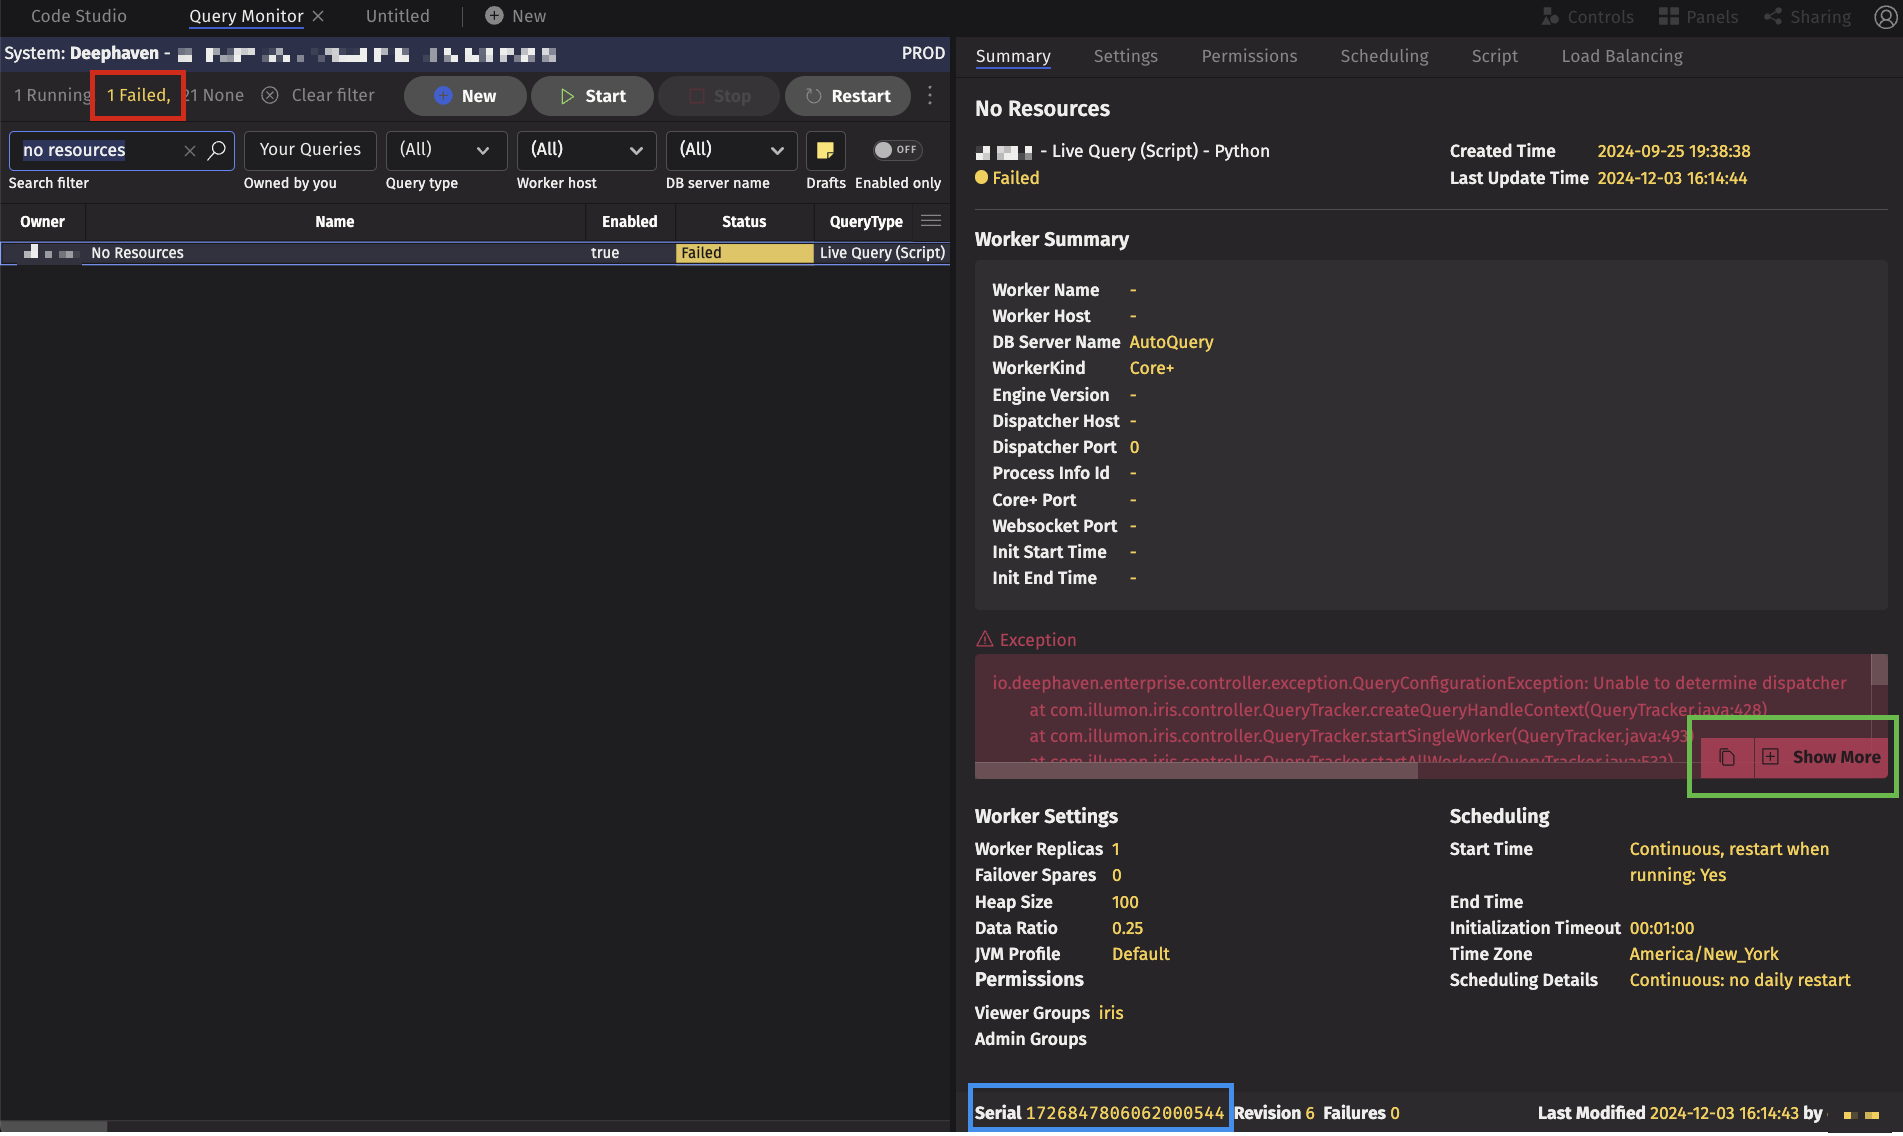
In this case, the query is in the "Failed" state, and an exception is displayed in the red box. Java Exceptions consist of:
- A type, in this case,
io.deephaven.enterprise.controller.exceptionQueryConfigurationException. - A message, in this case
Unable to determine dispatcher. Not all exceptions have a message. - A stack trace, which contains the file name, function name, and line number of each function call leading to the execution.
- Optionally, one or more causes.
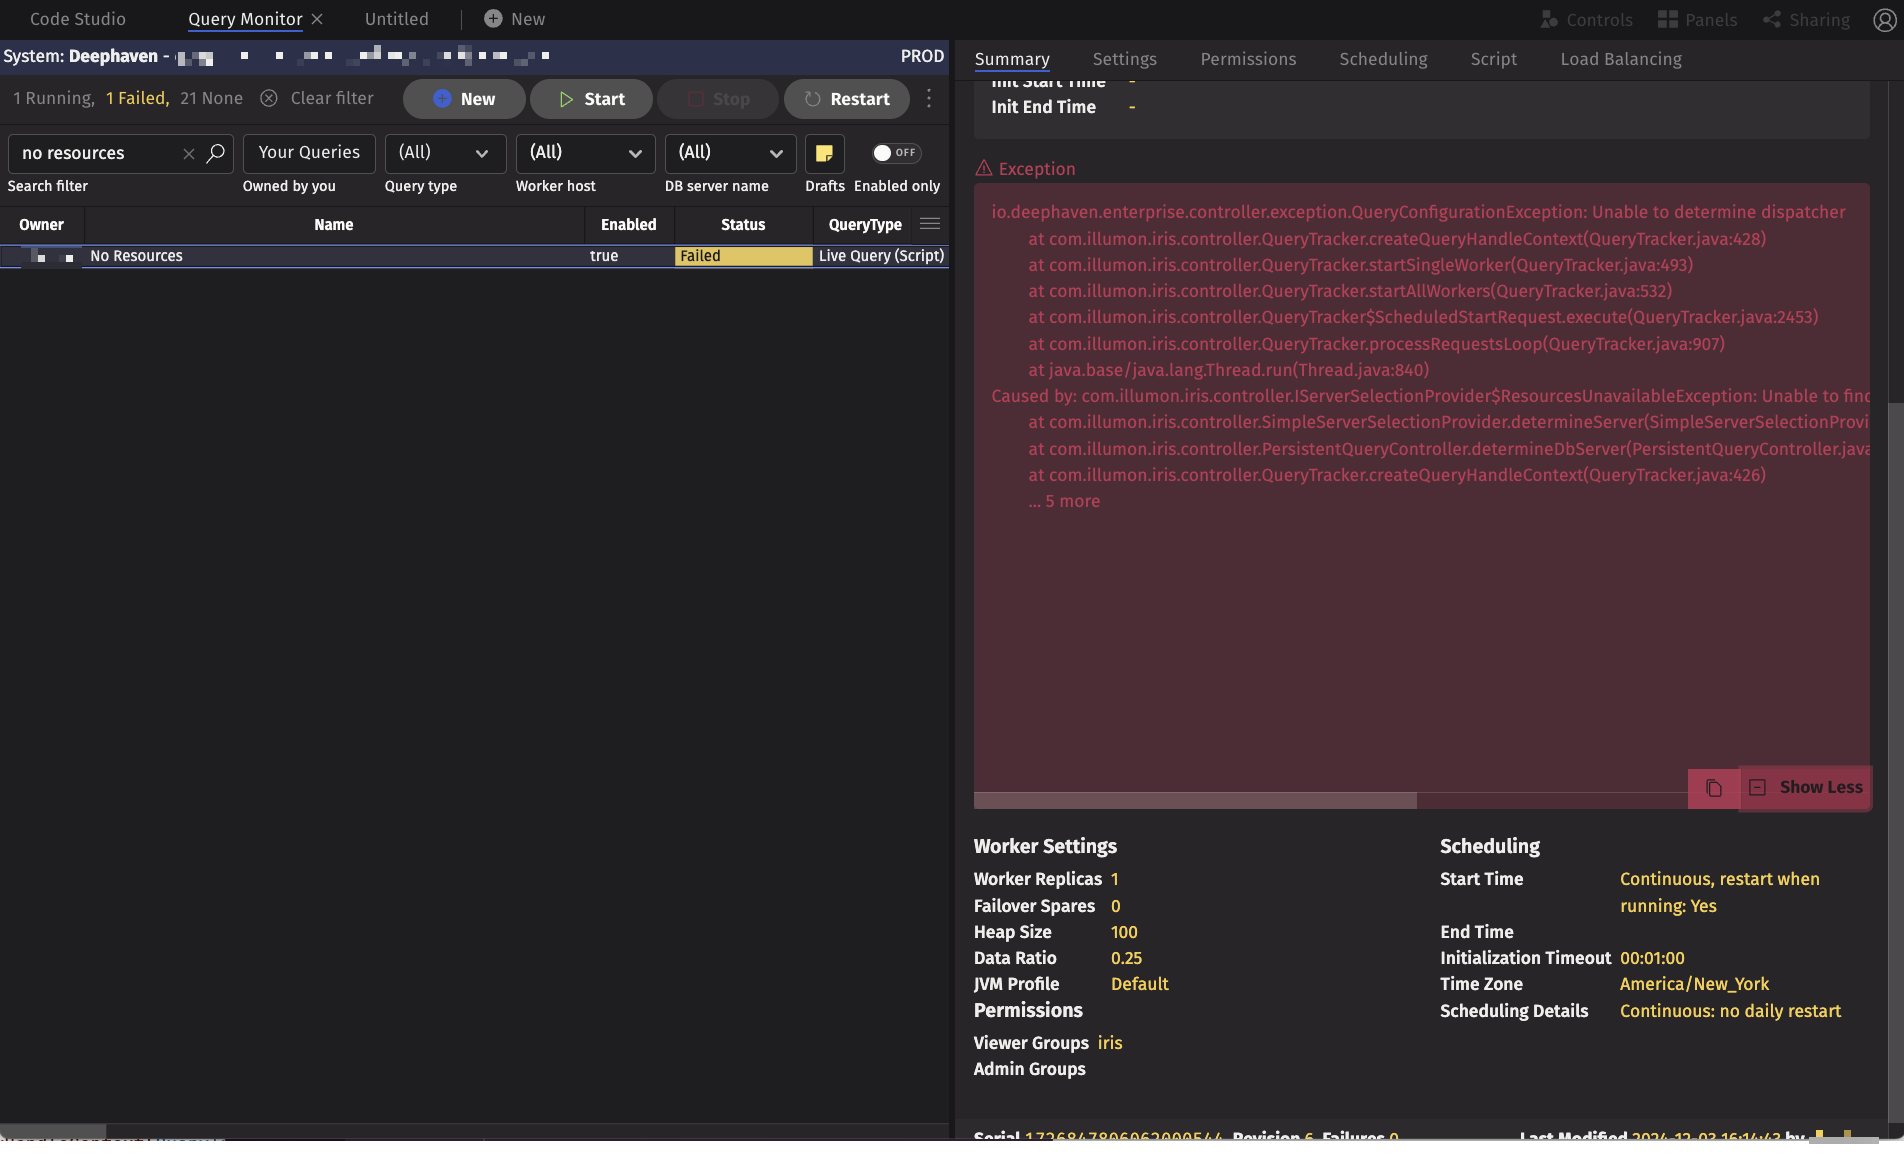
To get more information, click Show More (highlighted in green). At this point, the complete exception, including its cause, is shown. Scrolling to the right shows that the cause of the exception was Caused by: com.illumon.iris.controller.IServerSelectionProvider$ResourcesUnavailableException: Unable to find available server for requested heap of 102400 MB in server group AutoQuery for worker kind DeephavenEnterprise. From this message, we can see that the query requested 100GB of heap, which was unavailable on any of the servers in the cluster.
In this case, the Persistent Query was in a Failed state. Interpreting Persistent Query status is discussed below.
Of course, there are many different error messages and stack traces, each with its own solution, but the first step to debugging any outright failure is to examine the stack trace and then take action based on the information contained within it. Interpreting stack traces is essential to debugging a Deephaven query.
Determine State with the Persistent Query State Log
The Query Monitor allows you to see the current state of a Persistent Query, but to examine previous states of a query, use the PersistentQueryStateLog table, which contains all transitions of a query. You can filter on columns such as Name, Owner, or Status, but the serial number uniquely defines a PQ. The serial number is visible along the bottom bar in the right-side panel of the Query Monitor (highlighted in blue) or in the Serial column of the left-hand Query Monitor table. In the previous example, the serial number is 1726847806062000544.
The PersistentQueryStateLog table has several columns of interest for debugging your query:
| Column | Description |
|---|---|
| Timestamp | The time this state transition occurred. |
| Status | The query's state at this time. |
| StatusDetails | More detailed information about the worker's life cycle. On Kubernetes, this field contains information about pod creation. |
| ProcessInfoId | A unique identifier assigned when the controller requests a worker from the dispatcher. Use the ProcessInfoId to search for the particular worker in other logs. |
| ExceptionMessage | When an error occurs, the top-level exception class type and message. This corresponds to the first line in the Query Monitor. |
| ExceptionStackTrace | The complete stack trace from a failure, which corresponds to the expanded red box from the Query Monitor right-side panel. |
| ReplicaSlot | When more than one replica exists for a query, each slot has an independent status. Care must be taken not to mix slots accidentally when analyzing the sequence of transitions. |
These columns are shown below. Note that the Table Options menu can be used to organize and hide columns that are not of interest.
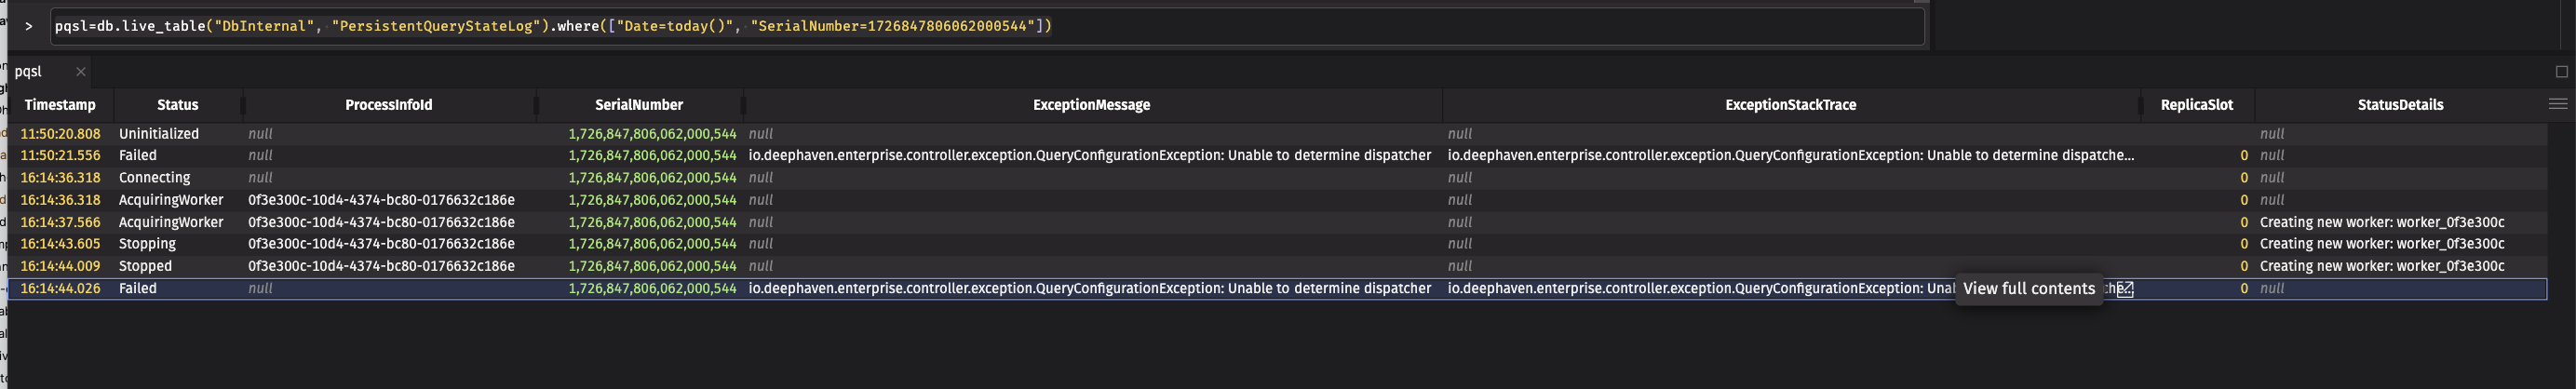
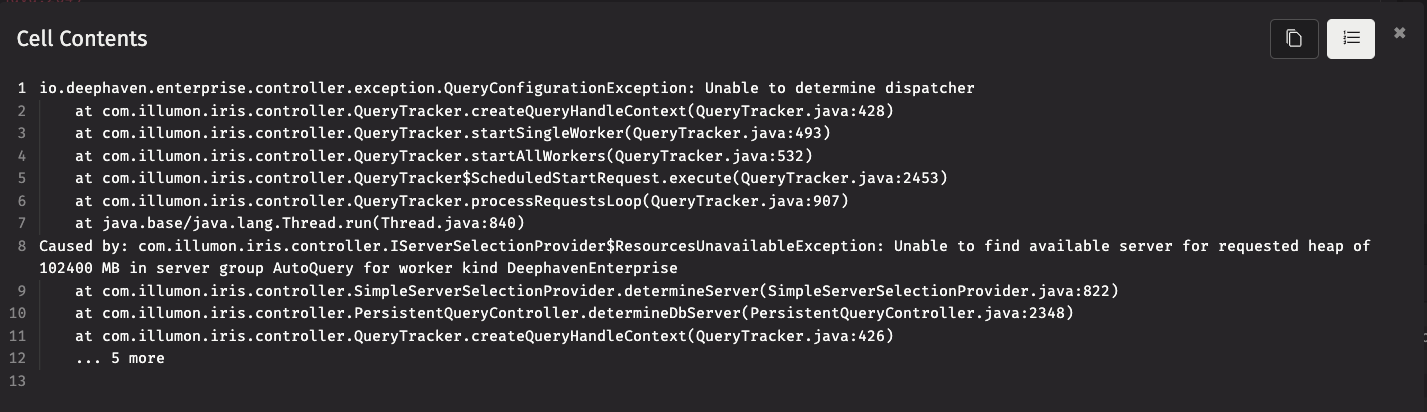
The last entry in the table has the same information as displayed in the Query Monitor. The ExceptionStackTrace column has an overflow selector, which can be used to view the full stack trace.
Interpreting Persistent Query status
The following states are typically indicative of a failure:
- Failed: The Persistent Query failed before or during initialization.
- Error: An error occurred after the query was initialized (e.g., processing incremental updates).
- Disconnected: The worker process disconnected from the dispatcher. This often results from a problem that terminates the JVM without giving the worker a chance to notify the dispatcher (e.g., OutOfMemoryError or hotspot errors in native code).
You may also find that a PQ has one of the following states:
- Initializing: The PQ's worker has been allocated and started, and the initial script is in the process of executing. Sometimes an initializing query simply needs more time to complete successfully; however, the query could be hung or could be performing operations that are unlikely to finish due to resource limitations or the size of the data.
- AcquiringWorker: The controller has requested a worker from the dispatcher and is waiting for the worker to be allocated. The dispatcher limits the number of workers that can be concurrently started, as worker startup is very resource-intensive. When additional workers are requested at the same time, the dispatcher adds each additional worker to a queue and waits for another worker to complete startup (but not script initialization) before starting another.
Live queries that successfully initialize enter the Running state. When a PQ is in the running state, clients (e.g., the web UI or other queries) may connect to the query's worker and request exported tables. Batch queries that successfully initialize enter the Completed state, and the worker is then terminated.
Failed Status
When a Persistent Query fails before or during initialization, the controller reports it as Failed. A query may fail for many reasons. Among the most common are:
- The query has invalid Python or Groovy syntax.
- A Deephaven operation failed. Follow the steps to debug query operation errors.
- The query did not initialize within the configured timeout. Follow the steps to debug excessive initialization time.
- A user or library function threw an exception. In these cases, read the stack trace and identify which function threw an exception.
- The node or server group the query is assigned to has insufficient resources to allocate the worker. If the query uses less heap than is requested, you can reduce the heap. Otherwise, contact your Deephaven system administrator to discuss resources.
- A system-level problem is preventing workers from starting, or the particular query has an invalid worker configuration (e.g., incorrect JVM arguments). Follow the steps in worker launch troubleshooting to diagnose and correct these kinds of issues.
Error Status
When a Persistent Query fails after initialization, the controller reports its state as Error.
There are many causes of errors, but among the most common are:
- Formula evaluation failures.
- The PQ depends on another PQ, using a remote table builder or URI subscription. If connectivity is lost, the subscribing query may be configured to raise an error rather than continue running with stale or no data.
- The Deephaven query engine detects inconsistent state and throws an assertion failure.
- The controller loses its connection to the query, indicated by an exception of the form
io.deephaven.shadow.client.flight.io.grpc.StatusRuntimeException: UNAVAILABLE: Network closed for unknown reason. This error is similar to a Disconnected status, so follow the same debugging steps.
Disconnected Status
When the dispatcher loses connectivity to a query, then the controller reports its state as Disconnected. The dispatcher may lose connectivity because the worker process crashed without informing the dispatcher or controller of an error or because the dispatcher does not receive regular heartbeats from the worker.
When a worker is disconnected, identify the ProcessInfoId from the query panel or Persistent Query State Log. Once you have the ProcessInfoId, you can then retrieve the ProcessEventLog, which contains the text logs for a worker.
There are many reasons a worker can enter the disconnected state, but some common causes are:
- The JVM threw an
OutOfMemoryerror while allocating buffers, in which case you must ensure that the worker has sufficient heap to execute your query. - The JVM was not able to allocate native memory from the operating system. The administrator must ensure that the Remote Query Dispatcher memory limits are correctly configured.
- The JVM crashed because of inconsistent JARs on the classpath; for example, a custom JAR was built against another version of a library, resulting in a
NoSuchMethodError. In this case, you should ensure that all JARs are built using the same version of libraries. The-verbose:classJVM argument may be helpful. - Native code (e.g., the JVM itself or the embedded Python interpreter) had an error, which resulted in a hot spot error.
- The worker JVM or dispatcher JVM did not have sufficient resources to send or receive heartbeat messages. This can occur if the machine is drastically overloaded.
- The
etcdcluster was overloaded and could not maintain the dispatcher's lease or the worker's subscription.