Debugging Tools
Debugging tools provide ways to inspect, analyze, and troubleshoot Deephaven processes executing your queries. These tools help you examine the state of Deephaven objects, diagnose performance issues, and step through code execution when standard error messages aren't sufficient for problem solving.
Many of these tools require knowledge of Java; knowledge of Deephaven's internals is helpful for more advanced debugging scenarios.
Connect a remote debugger
Remote debugging allows you to introspect and even manipulate a worker's state and can be applied to either Code Studios or Persistent Queries. You may want to debug a worker to examine the state of a Deephaven object or to examine and step through your own Java extensions.
To debug a Deephaven worker, you should create an IntelliJ project that includes the Deephaven JARs and any of your own components.
- When debugging a Legacy worker, you must create a project with the Legacy JARs.
- When debugging a Core+ worker, you must create a project with Deephaven Core+ and Deephaven Community Core JARs.
There are two modes of remote debugging available:
- Attaching to a remote JVM. In this mode, you start the worker first and then start the debugger second.
- Listening to a remote JVM. In this mode, you start the debugger first and then start the worker second.
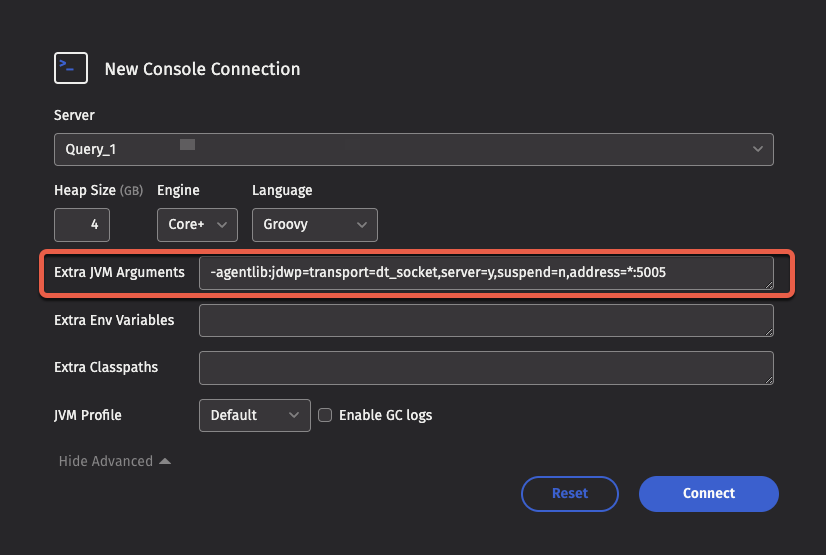
Either way, you must add options to your worker's JVM arguments. From the Code Studio, set the arguments in the Extra JVM Arguments text box after expanding Show Advanced:
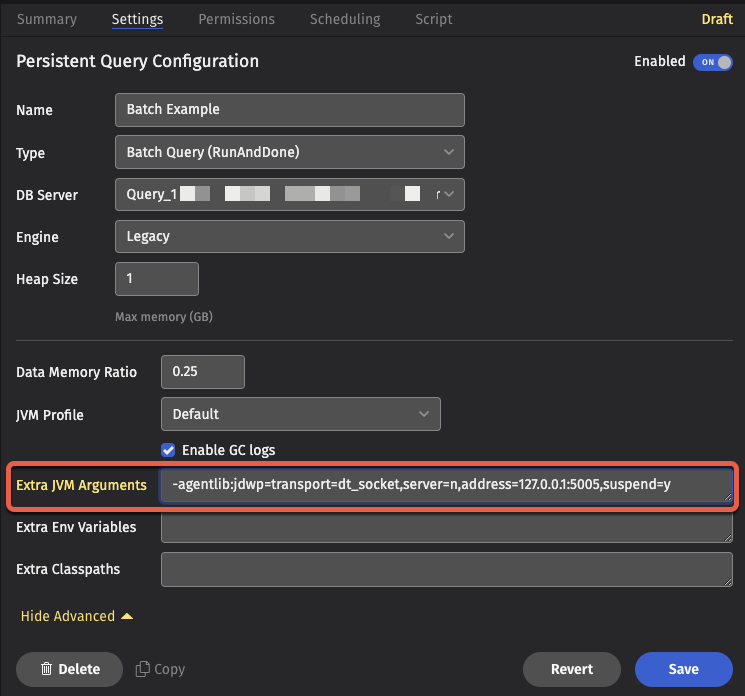
For a Persistent Query, set Extra JVM Arguments after expanding Show Advanced in the Settings tab:
IntelliJ run configuration
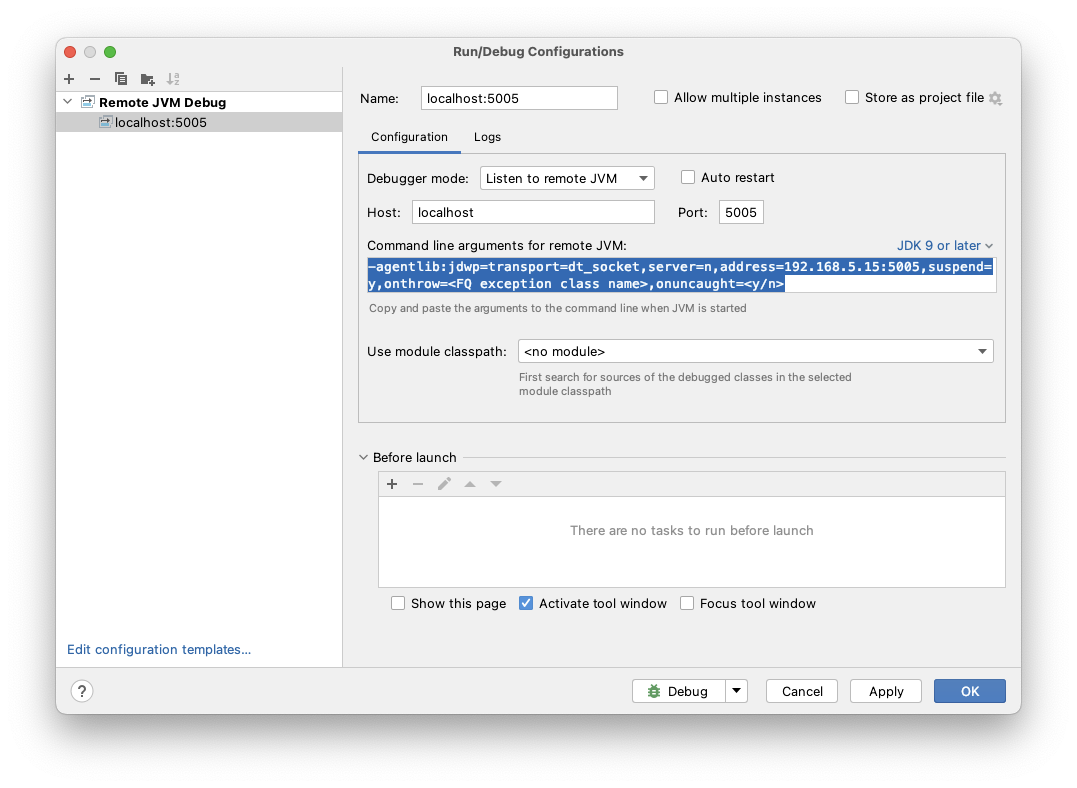
The Jetbrains remote debugging tutorial describes configuring an IntelliJ run configuration attaching or listening to a remote JVM. The configuration for "Remote JVM Debug" allows you to select the debugging mode, the port, and, if applicable, the remote hostname. Command Line Arguments for remote JVM: in this dialog serve as a suitable template for the extra JVM arguments to provide to your worker:
Attaching to a remote JVM
Typical worker JVM arguments to start a JVM that listens for connections from a remote debugger (i.e., the IntelliJ debugger attaches to a remote JVM):
Note
Each listening JVM must have a unique port otherwise the worker will fail to start with an error of the form:
Warning
When attaching to a remote JVM, setting suspend=y is necessary to debug worker startup, but prevents the worker startup process from proceeding until you connect your debugger to the worker. If you do not connect a debugger quickly enough, then the worker startup times out and fails. Consider using a listening debugger instead. When debugging script code in a Code Studio, you can select suspend=n and attach the debugger before executing your script code.
Listening to a remote JVM
Typical worker JVM arguments to make it connect to a listening debugger (i.e., the IntelliJ debugger is listening to a remote JVM):
Before starting your worker, make sure your listening debugger and any applicable SSH port forwarding are enabled.
SSH Port Forwarding
Remote debugging requires TCP connectivity between your local IDE and the worker on your selected port. Depending on your network, VPN, and firewall configuration, it may be necessary or easier to use SSH tunnels to establish the necessary connectivity.
SSH tunnels can be set up in two different ways depending on which side initiates the debug connection. Both techniques use the -N option which instructs SSH not to open an interactive shell, creating only the tunnel. Adding the -v option can be useful to troubleshoot connectivity issues.
Local port forwarding
Use local port forwarding (the -L option) when your debugger needs to connect to a remote JVM:
Example: If you have a worker that is listening for debug connections on port 5050 on the host worker-host.example.com and you want to connect to it from IntelliJ on your local port 5005:
This forwards connections from your local port 5005 to port 5050 on the remote server. Your local IDE initiates the connection to the remote JVM's debug port.
Remote port forwarding
Use remote port forwarding (the -R option) when the remote JVM is configured to connect to your debugging tool:
Example: If your local IDE is listening for debug connections on port 5006, and the remote JVM on worker-host.example.com is configured to connect to a debugger on port 5060:
This forwards connections from port 5060 on the remote server to port 5006 on your local machine. The remote JVM initiates the connection to your local debugging tool.
Heap Dumps
Heap Dumps write the entire state of the JVM heap to a file. You must have access to the server running your worker to retrieve this file and then use a tool like Java VisualVM to analyze it. You may also set the extra JVM argument -XX:+HeapDumpOnOutOfMemoryError.
Warning
As heap dumps contain the entire Java heap, a heap dump file takes significant disk space -- roughly the size of the heap that you have allocated to the worker. You must regularly remove any generated heap dumps to avoid an out-of-disk space condition on the query server.