Code Studio
Use the Deephaven Web interface's Code Studio to write console-based queries for analyzing data. The tables, charts, and widgets generated from those queries (as well as other tables, charts, and widgets) can then be arranged to create customized workspaces in the Deephaven interface.
Connect
When you open a new Code Studio, the New Console Connection screen provides options to specify:
- The server you want to use.
- The heap size (memory) requested to run your queries.
- The engine (Community or Enterprise).
- The language you plan on using for the query (Groovy or Python).
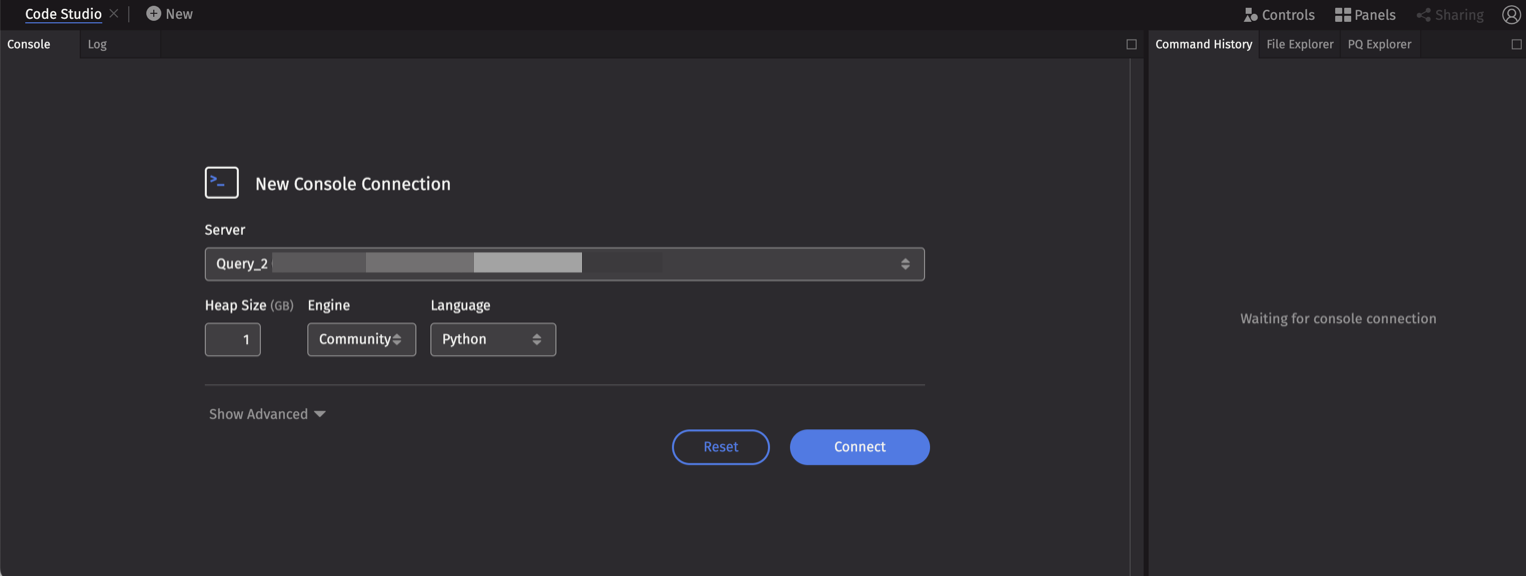
Server
Available servers are presented in alphabetical order in the drop-down menu. Every installation is unique, so please consult your system administrator for additional information about available servers.
Heap size
This setting refers to the dynamic memory (RAM) you want Deephaven to use to process the instructions and the data needed to run this specific query. Memory listed in this setting is noted in gigabytes (GB).
Note
Memory is a finite resource on the system. It is usually best to start small when estimating the amount of memory needed to run the query, and then adjust it as needed.
The heap size only refers to memory allocated to the Java Virtual Machine's heap. The vast majority of Deephaven data structures are located in heap memory, but your worker may also use non-heap memory, for example to store Python native objects. See Additional Memory in the advanced settings section for more information.
Engine
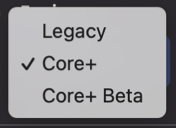
Choose to launch Deephaven using either the Core+ or Legacy engine. The Core+ engine integrates the Deephaven Community Core engine and the Deephaven Enterprise data store. The Legacy engine is the original engine from which Deephaven Community is derived. New queries and applications should use the Core+ engine, which is under active development.
The two engines have different syntax, so you must pick the engine corresponding to your script.
- For the Community Core engine, refer to the Deephaven Database documentation, as well as the Community User Guide.
- For the Legacy engine, refer to the Legacy table operations and Legacy plotting documentation.
Your system administrator may define other engine choices (e.g., with different Python environments), which will be displayed in this drop down.
Note
Depending on how the Deephaven system is configured, you may see more than one option available for Core+.
Language
You can write Deephaven scripts in Groovy or Python. This value defaults to Groovy. If you prefer to write your scripts in Python, select Python from the drop-down menu.
Show Advanced
Select Show Advanced to see additional connection options.
Click to see options.
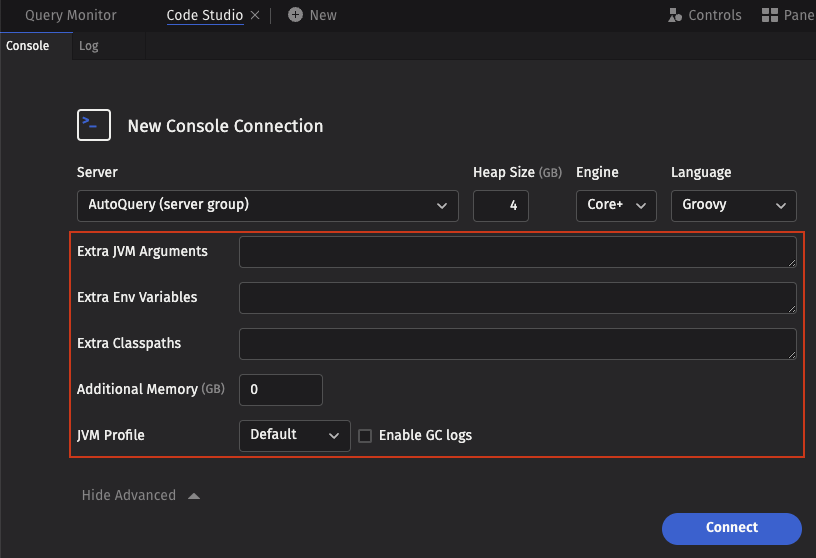
- Extra JVM Arguments - This field allows users to access different Java utilities that are not included in the base Deephaven installation. For example, one may want to run a different profiler or debugging processor. You can include these items in the Deephaven configuration by typing the extra JVM arguments in this field.
- Extra Env Variables - If needed, this field can be used to pass extra environment variables to the Deephaven configuration.
- Additional Memory - The amount of additional memory (in GB) allocated to this worker process beyond the JVM heap memory. This allows Deephaven to account for memory allocated by Python native code, Java direct memory, and other types of non-heap memory. This setting is especially important on Kubernetes, because if a worker's memory usage exceeds the total allocated heap and additional memory then the Linux kernel terminates it with an out-of-memory error.
- JVM Profile - This drop-down field allows users to select an alternative JVM profile for new persistent queries. Remote processing profiles are used to specify JVM parameters and environment variables for Persistent Queries and interactive consoles. Several predefined profiles are available, such as CMS GC or G1 GC, and you can define new profiles by using controller properties.
- Enable GC logs - Garbage Collection (GC) is a JVM memory management program that frees unreachable memory by getting rid of objects not in use by a Java application. When the check box is selected, Garbage Collection information will be included in the server-side dispatcher logs.
- Extra Classpaths - Extra paths that should be included as part of the Java class path.
If you select a Core+ Python worker, then there are three additional options for configuring the worker's Python environment:
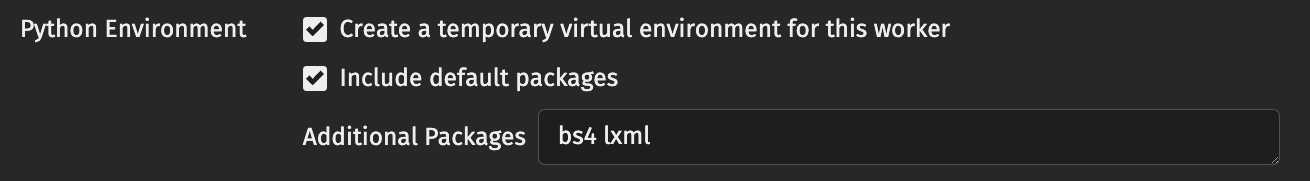
- Create a temporary virtual environment for this worker - When selected, a new virtual environment is created for this worker. On bare metal installations, a worker may not change the default shared virtual environment. To install additional packages (either with the Additional packages field or with
deephaven_enterprise.venv), you must create a temporary virtual environment. On Kubernetes clusters, you can install packages into the default virtual environment, as it is specific to your container instance and not shared across workers. - Include default packages - When selected, the temporary virtual environment is initialized with a copy of the packages in the default environment. Note that some of these packages are necessary for Deephaven to function, but you may want to exclude them so that you can experiment with different versions of the packages.
- Additional packages - A space-separated list of additional requirements to install into the virtual environment on startup.
When running on a Kubernetes cluster, the following additional parameters are also available:
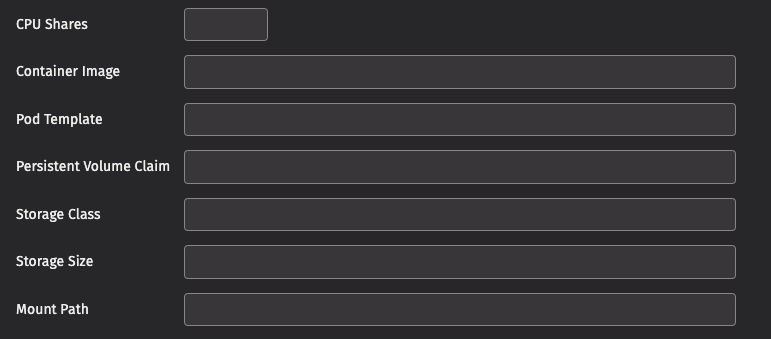
- CPU Shares - Controls the number of CPU shares requested by the worker pod. If not specified, no explicit CPU request is made and the cluster uses the default value.
- Container Image - The path to the container image to use for this worker.
- Pod Template - An alternative pod template to use for this worker. This allows you to change many of the worker settings.
The following four options allow you to attach storage to your worker. This is necessary, for example, to create an in-worker DIS or Kafka Ingester:
- Persistent Volume Claim - Mount the persistent volume claim with this name in your worker pod, or create a persistent volume claim if it does not exist.
- Storage Class - If creating a new volume claim, use this storage class.
- Storage Size - The amount of storage in bytes. May be expressed in Mi, Gi, etc., as in
10Gi. - Mount Path - Location where the volume will be mounted in your worker.
Note
Your Deephaven administrator may not permit changing all of these values (see Kubernetes worker parameters for more information).
Warning
Extra classpath entries must follow Java's rules for inclusion. Entries should either be paths to .jar files, paths to directories containing .class files, or a path glob such as /path/to/jars/*
See -classpath in Java Documentation
Connect to Server
After adjusting the applicable settings in the dialog box, click Connect.
After establishing a connection to the server, the Code Studio window will look similar to the image below:
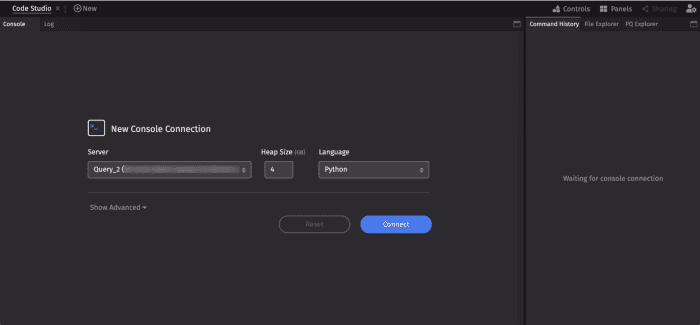
On the left, the Console and Log panels are nested together. The Console is for writing and executing queries. When the query executes, any tables, plots and/or widgets generated by the query appear in the workspace as a new panel.
To the right, the Command History, File Explorer, and PQ Explorer panels are nested together. Any of the panels can be rearranged in the workspace by dragging and dropping the panel tabs, or maximized to full screen. See Customizing Your Layout for a full guide to manipulating panels in the Deephaven UI.
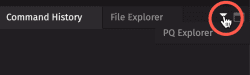
Note that if your browser window width cannot accommodate all three tabs, an arrow will appear that provides access to the additional tabs. In the example below, the arrow can be used to bring the PQ Explorer into the foreground:
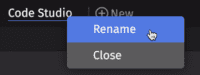
You can add multiple Code Studios to the interface by using the New button in the Navigation bar at the top. Consider creating separate code studios for each console and server configuration you commonly access. You can rename any Code Studio (or Dashboard) by right-clicking the tab, as shown below:
Console
The Console window is used for writing and executing queries. You can then use the tables, plots, and widgets generated by those queries to build your workspace.
Queries
Simply speaking, a query is a way to ask the data system for information. For example, you can write a query to filter, group, and aggregate data; to join different tables; to create different views; or to build plots and other widgets.
There are two types of queries:
- Console-based queries are typed in the console or accessed via Git or other types of repository. Typically, console-based queries are used for one-off questions or data extractions and the development of new PQs. Tables and charts generated by console-based queries appear in the Code Studio window as new panels.
- Persistent queries use the same language as console-based queries. However, PQs can be saved, thereby enabling the automation of repeating and/or timed operations. You can also share PQs with other individuals or groups. You can access tables and charts generated by PQs from the Panels menu. To learn more, see Panels and Creating Persistent Queries on the Web.
The following code block is an example of a query using the Deephaven Query Language. When executed in the console, the query opens a table of stock market data and then filters that table to a specific date and Sym (AAPL):
After the query runs, the generated table appears in a new panel in the Code Studio window.
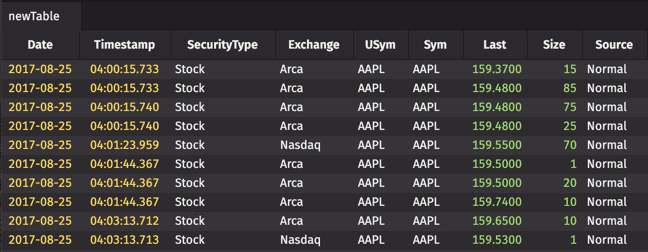
As shown above, the new table holds information pertaining only to trades of Apple (AAPL) securities on August 25, 2017.
A blue button then appears in the Console that shows the name of the table that was just created. Click this button to refresh the table, or reopen the table if it has been subsequently closed.
Now that you have created the table, add another query to create a simple line plot using data from the previous table:
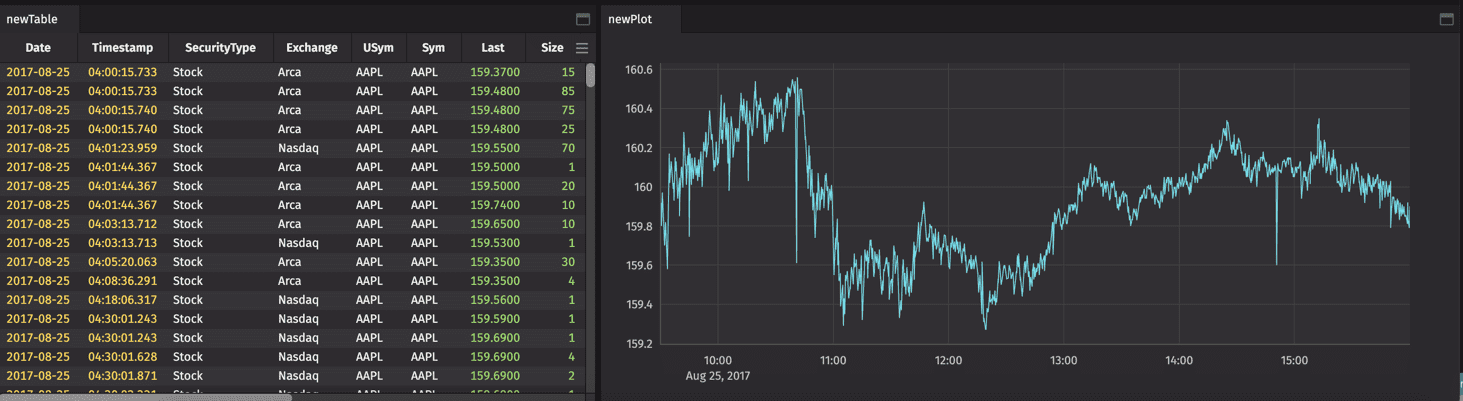
After the query executes, the plot appears as a new panel in the Code Studio window. As before, you can use the blue button in the Console panel to refresh or reopen the plot.
Console Menu

The menu at the top of the Console window provides the following information and options:
Worker status
This shows the current state of the worker: Idle (hollow circle), Working (solid circle), or Disconnected (hollow red circle).
Query worker name
This is the name of the Deephaven worker assigned to this console.
Script type
This tells users which programming language is being used. Options are Groovy or Python.
Memory (Heap)
This is the amount of memory assigned to process queries in this console session.
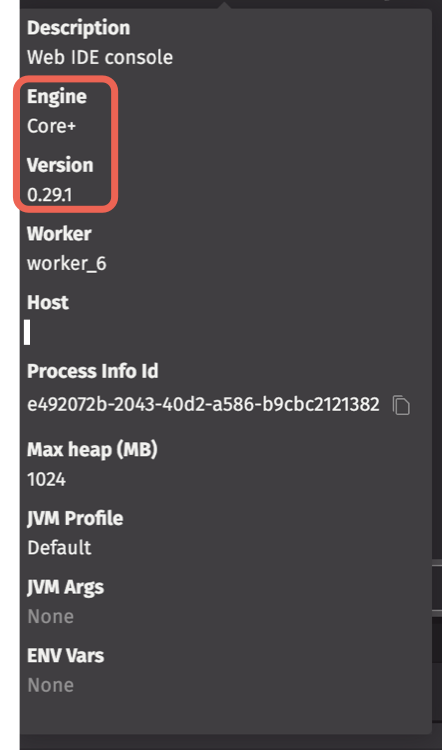
Session details
This shows the URL of your Deephaven instance. Hovering over this section or the info button shows details of your session, including the worker kind and Community Core engine version:
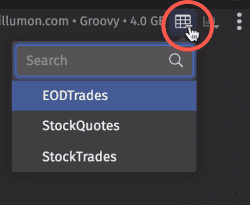
Show Table
This option becomes available if any console-based queries have generated a table. Select an item in the drop-down menu to bring it into focus. If a table has been subsequently closed, you can re-open the table by selecting its name from the drop-down list.
Note
This only applies if the table has been generated in the same session.
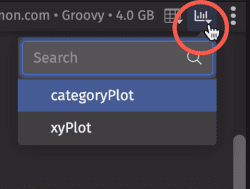
Show Widget
This option becomes available if any console-based queries have generated a plot or other widget. Selecting an item in the drop-down menu will bring it into focus. If a plot or widget has been subsequently closed, you can re-open it by selecting its name from the drop-down list.
Note
This only applies if the plot or widget has been generated in the same session.
More Actions
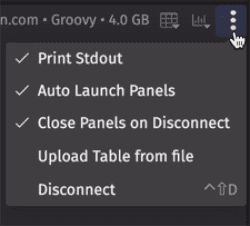
This More Actions includes the following options:
- Print Stdout - If selected,
stdout(standard output) will be included in the console history. If your script generates a large amount of logging tostdout, you may wish to turn this off. - Auto Launch Panels - If selected, any console-based queries will automatically open in new panels in the Code Studio window. If unselected, tables or widgets produced from console-based queries will not automatically open as new panels. However, these can be opened by clicking the blue button under the query or from the Show Table/Show Widget menus.
- Close Panels on Disconnect - If selected, all open panels will be closed when the console disconnects, or when you exit the web browser. If unselected, panels will remain open upon disconnect or a new session.
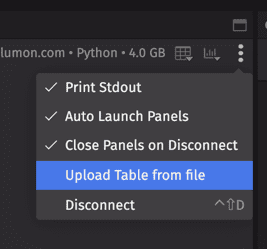
- Upload Table from file - Opens the wizard to import table data from a file, such as a CSV. See below for more details.
- Disconnect - Disconnects the console from the query server and will return you to the New Console connection screen.
Upload Table from file
You can import tables from files via the UI in one of two ways:
- Select Upload Table from file from the console's More Actions menu:
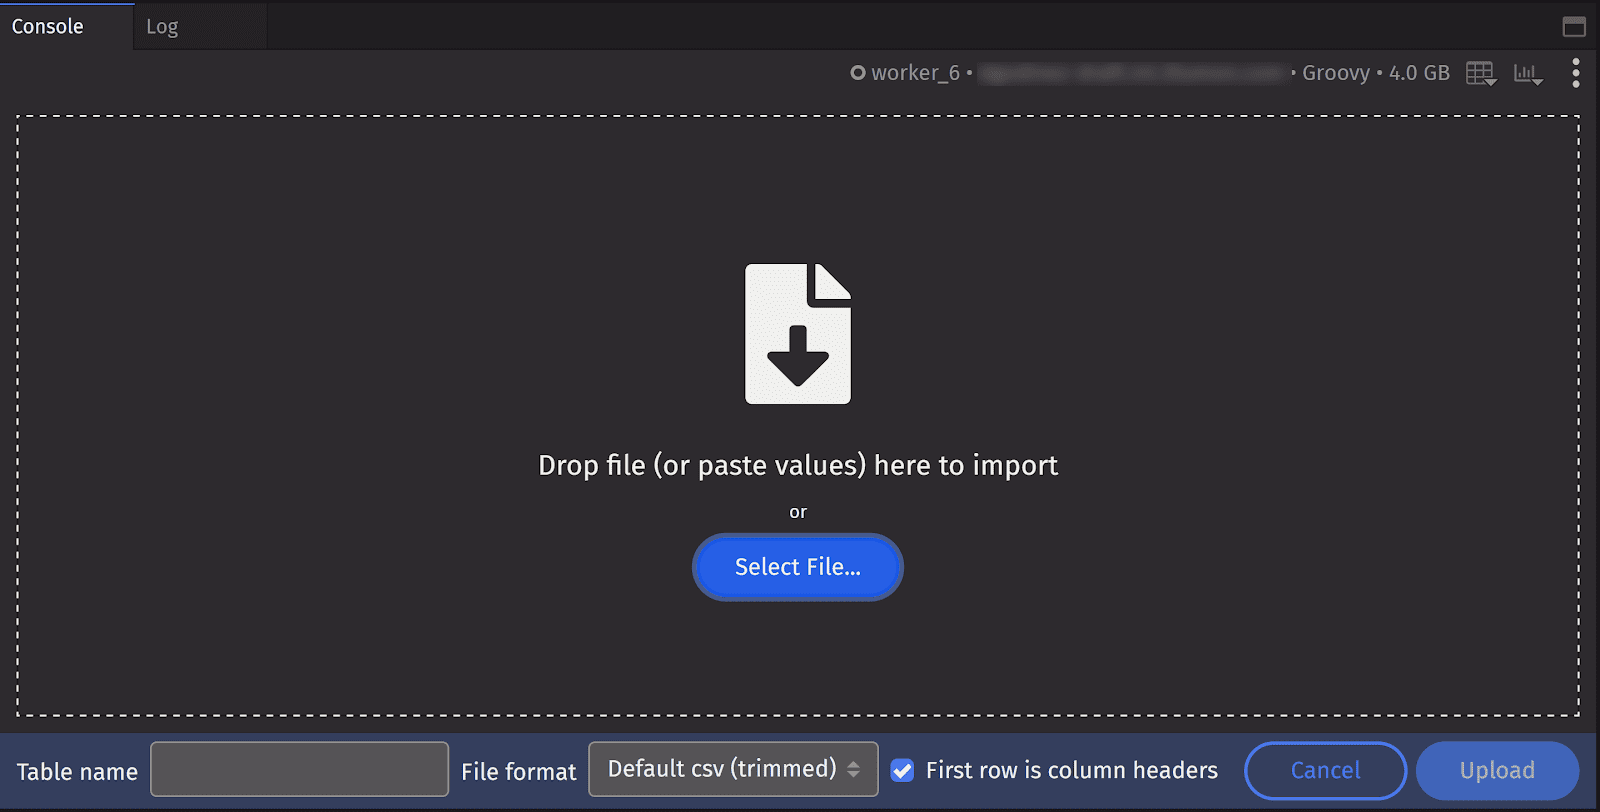
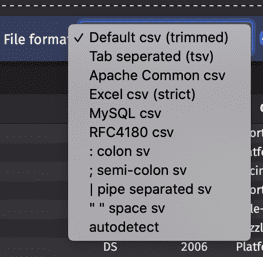
A table name will be generated for you, but you can enter your own. You can also choose an alternative file format:
- Drag a CSV file onto the console.
This feature supports the following file extensions:
- csv
- tsv (tab separated)
- tab (also tab separate)
- zip (containing one of the above)
Log
The Log panel tab is located beside the Console panel and presents a record (log) of what your query programming is doing, including data input/output and processing. This feature is primarily designed for more advanced programmers, but the log can help all users find and resolve errors that may occur.
There are eight different logging levels in Deephaven:
- FATAL - Details about severe events that will likely cause the query to abort.
- STDERR - Presents details about events occurring in the stream where a program writes its own error data.
- ERROR - Presents details about more harmful errors that are occurring even though the query is still running.
- WARN - Presents details about potentially harmful events that are occurring.
- STDOUT - Presents details about events occurring in the stream where a program writes its output data.
- INFO - Presents general information showing the progress of the query.
- DEBUG - Presents more specific information that should be useful for debugging.
- TRACE - Presents very fine-grained details about events as they occur.
Log search
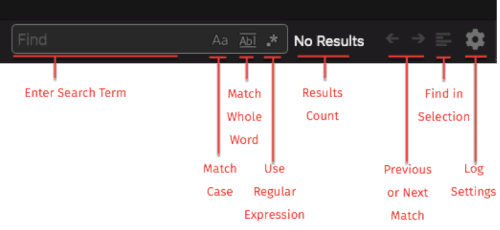
The Log search allows you to search the logs for specific keywords/phrases. Search will find partial matches and is case-insensitive by default. However, you can choose alternative search options in the search field, including:
- Match Case
- Match Whole Word
- Use Regular Expression
If the search term is present in the log, the keyword will be highlighted (Note: this can be turned off and on with the Find in selection button in the search toolbar). If there are multiple instances of the keyword, you can either scroll through the log window or click on the left and right arrows in the search toolbar to jump directly to the next instance of the search term. The log scroll bar will also indicate each instance of your search term, as shown below:

Log Settings
Click the "gear" icon at the right of the Log panel to open the Settings menu:
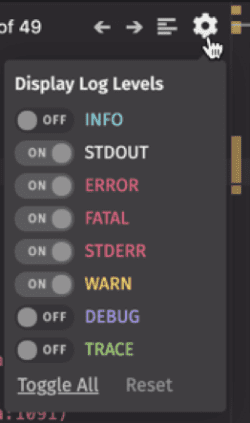
The Display Log Levels drop-down menu allows you to choose the level of details presented in the log window when a query is running.
- By default, only five levels are shown, including FATAL, STDERR, ERROR, WARN, and STDOUT.
- You can turn each log level on or off individually.
- Select Toggle All to show every detail of logging presented in Deephaven.
- Select Reset to restore the default levels.
Log Context Menu
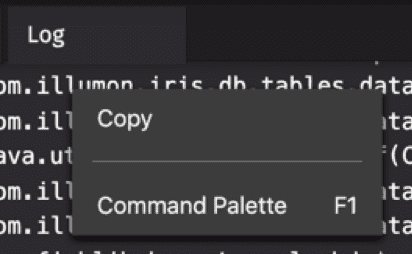
Right-click within the log panel to open a context menu with the following options:
Copy
Copies either the line from where the right-click menu was generated, or selected lines, to the clipboard.
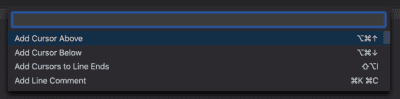
Command Palette
Opens the Command Palette, which provides an exhaustive list of commands for editing, including keyboard shortcuts for the most common operations.
Command History
The Deephaven Command History can be used to review, retrieve and rerun queries that were used in previous queries. By default, the Command History appears to the right of the console window, as shown below. However, you can drag and drop its tab to another location in your workspace.
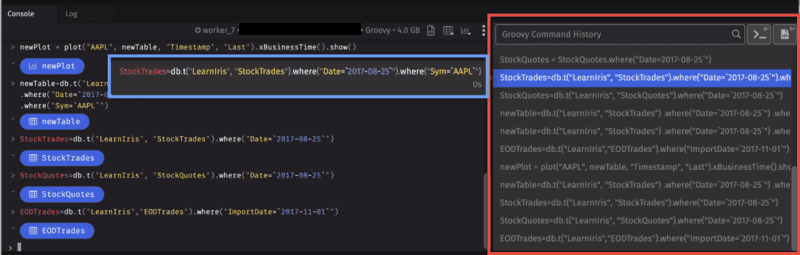
The most recently used commands are shown at the bottom of the list. When the panel is full of previous commands, scrolling enables users to find older commands.
The history will show as much of the line as fits the window width. Hovering over that line opens a flyout menu to the left with the full query and its runtime.
You can highlight one or more commands in the History panel by clicking or shift+clicking on the commands. Double-click on a command in the panel or hit enter to copy that command to the console.
At the top of the Command History, there are three options:
- The Search field, which you can use to find a specific keyword in a previous command.
- Open selected commands in the console copies the selected commands into the console.
- Open selected commands in the notebook copies the selected commands into the notebook panel, or if none are present, creates a new notebook panel with the commands.
Note
Command History for Core+ workers is separate from Legacy workers since Core+ and Legacy worker commands are not compatible.
Command History Context Menu
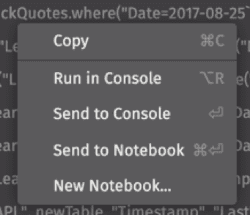
Right-click on a command in the Command History panel to display the following options:
- Copy - Copies the selected command(s) to the clipboard.
- Run in Console - Runs the selected command(s) in the console.
- Send to Console - Copies the selected command(s) into the console, where you can edit them before running the query.
- Send to Notebook - Copies the selected command(s) to the most recently opened notebook panel in the console.
- New Notebook... - Copies the selected command(s) into a new notebook panel.
You can add notebooks can to your workspace by using the File Explorer or the PQ Explorer.
File Explorer
The File Explorer tab at the top right of the Code Studio provides options to create and open Deephaven notebooks.
PQ Explorer
The PQ Explorer tab at the right of the Code Studio lists all the PQs available to you, as well as some status information.
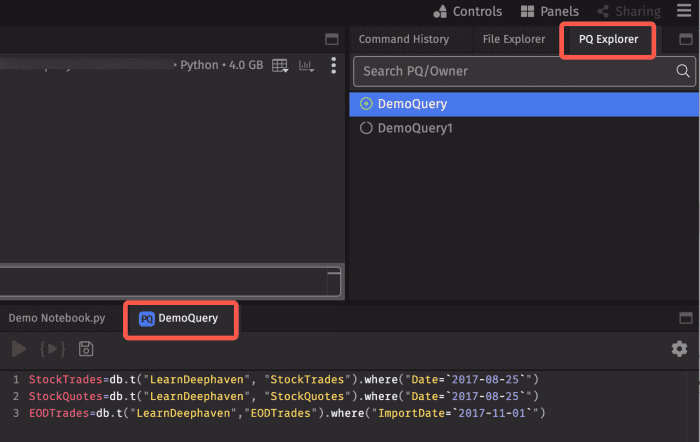
As shown above, the green circle indicates that the PQ named "DemoQuery" is active, while "DemoQuery1" is not. Selecting any query automatically opens its script in a new notebook panel. When a notebook generated from the PQ Explorer is saved, any edits will be automatically applied to that persistent query script and reflected in the Script tab of the Persistent Query Configuration Editor.
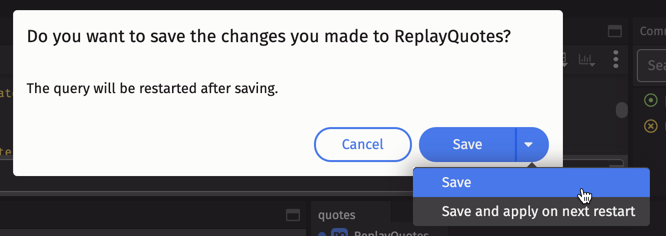
Click the drop-down arrow within the Save button for options to either restart the query immediately, or apply the changes upon the next scheduled restart:
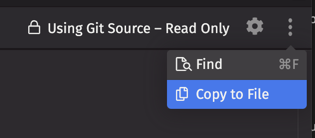
If the query is Git-hosted, the script will open as a read-only Notebook. The overflow menu provides the option to copy the script into a new editable notebook.
Autocomplete
As you write queries in the Deephaven web console, the autocomplete feature speeds up your query writing by suggesting possible values. As you type in the Console window, a drop-down list appears with values relevant to your query, such as available namespaces, table names, and table operations.
For example, the animation below shows Deephaven's autocomplete feature generating suggestions (in drop-down menus) as portions of the query are typed.
To select one of the suggested values, scroll to the desired value, and click or press Return/Enter on the highlighted item.