System logs
This guide outlines how to review and search system logs for troubleshooting purposes. It covers text logs and binary logs.
Text logs
Deephaven utilities and processes that are controlled by M/Monit generate text logs which are usually a good starting point when a server process is failing or is not operating correctly.
These logs are written to sub-directories under /var/log/deephaven.
DbInternal binary logs
Some Deephaven processes, especially workers (which are used in consoles and also behind persistent queries), log their details to binary log files, which are then loaded by the data import server into DbInternal tables. See Deephaven internal tables for more details about these tables.
When the system is functional and a console can be started, users can query the ProcessEventLog table to view log output from their own workers. Administrative access is required to view logs from other users' workers (see Deephaven permissions). When consoles are not functional, the iriscat utility can be used to view binary log files.
DbInternal table view
Workers are identified by a UUID (Universally Unique ID), stored in the ProcessInfoId column of various DbInternal log tables. The controller process assigns these IDs at startup. A truncated version of the UUID is stored in the WorkerName column. The WorkerName starts with the string worker_, followed by the first section of the ProcessInfoId. For example, a ProcessInfoId of 6604dd7e-054d-4ce5-9249-93c5dffa739b would have a WorkerName of worker_6604dd7e.
Note
A UUID (Universally Unique ID) is a value generated using unique hardware details of the machine on which a generator algorithm is running, in conjunction with the date and time at which the ID is generated. The UUID ProcessInfoId within Deephaven's scope always uniquely identifies one specific run of a worker process.
When troubleshooting, the most commonly used internal table is the ProcessEventLog (referred to as PEL). The PEL is useful when a Persistent Query has failed, but the exception displayed in the Query Monitor panel does not provide sufficient information about the cause of the failure. It is also useful when a console fails without a useful exception, for example if a process runs out of heap or encounters a fatal exception.
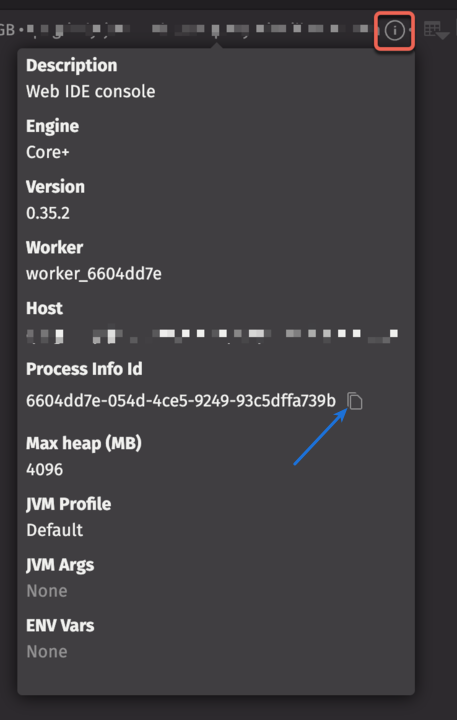
To view the PEL table for a process you must determine a unique identifier for it, preferably the ProcessInfoId. For a Persistent Query, the ProcessInfoId is found in a column in the Query Monitor panel. For interactive workers, the ProcessInfoId can be found by hovering over the ⓘ menu in the console. The ID can be easily copied to the clipboard by clicking on the icon next to the ID.
For a Persistent Query that crashed and no longer shows the ProcessInfoId, use the PersistentQueryStateLog table to find the ProcessInfoId.
In the query above, the psl table has a ProcessInfoId column containing the unique identifier for all executions of the Import 12 Persistent Query for today.
If the WorkerName for a console is known, the ProcessInfoId can be obtained by querying the AuditEventLog. For example, to get the worker startup audit details for query worker worker_6604dd7e:
Once you know the ProcessInfoId, you can query the PEL to get the detailed worker logs from startup through shutdown. If the worker crashed or shut down unexpectedly during startup, there may be limited information available in the log. When this happens you need to inspect logs from the dispatcher on the host your query was running on.
This query gets all PEL entries for all workers that were assigned the ProcessInfoId of 6604dd7e-054d-4ce5-9249-93c5dffa739b for today.
The .sort("Timestamp") is required because a process may have multiple loggers writing to the PEL, and those messages will be appended to the log in the order in which they arrived. Especially in the case of a fatal exception handler, the messages may arrive before the main log queue is flushed to the binary log file.
DbInternal iriscat view
When it is not possible to start a console to query the PEL, the iriscat utility can be used to view binary log files. iriscat is used to dump binary log files from disk to a text format where they can be read and parsed using standard *NIX command-line tools. The binary logs on each Deephaven server are written to /var/log/deephaven/binlogs/pel.
For example, to dump the contents of a particular PEL binary log file to stdout:
The -l directive formats the data as a log file, including formatting long epoch offsets to datetime values for easier reading.
A common practice is to search the formatted log file for a particular ProcessInfoId and sort the result.