Web UI troubleshooting
The most common causes of failures with the Web UI login panel are:
-
Expired or incorrect certificate - This should show a browser message like, "Your connection is not private". The specific message will vary depending on the particular browser and version used. Details about the problem with the certificate should be visible by clicking or right-clicking on a "Not Secure" message or icon typically at the left of the address bar. See replacing certificates for details about updating the certificate file and key for the cluster.
-
WebClientDataPersistent Query is not running - When attempting to log in, the Web login dialog will show "Unable to login: Cannot connect, query config has status 'Stopped'". TheWebClientDataPersistent Query makes available to the Web API Service data needed to present workspaces and dashboards within the Web UI. Normally this Persistent Query is configured to run on the first query server, and to restart automatically if it fails.If the
WebClientDataPersistent Query remains down, you may login using Safe Mode by clicking the Gear on the login screen. Alternatively, if you have the Swing client configured, it is not dependent on theWebClientDataPQ or even on having any functional dispatchers in order to run. From the Swing client, the Query Config panel can be used to view the status and any recent exception associated with theWebClientDataPQ.Instead of launching a Swing client, dhconfig pq can be used from the command line to view the query's status. The
-D trueoption is required as theWebClientDatais a "non-displayable" query normally only visible to superusers.The WebClientData query can also be restarted with the controller tool:
If further analysis is needed to find why the PQ cannot run, see system logs for details on finding the PQ's worker id and its PEL logs.
-
Web API service is not running - If this process is not running, the Web UI URL usually produces a connection refused error (without Envoy) or 502 HTTP error (with Envoy). The Web API Service is typically installed on the "infra" cluster node, which also hosts the merge dispatcher and data import server services, but it can be installed on any server in the cluster. See processes, process dependencies, and process startup troubleshooting for background on this process and finding details of what would cause it to fail to start.
-
Firewall blocking worker ports - If Envoy is not in use, connections to the Web UI login page will normally be on port 8123, but, once a user is logged in, connections to workers hosting dashboards and consoles will be on other ports. If there is a firewall blocking the other ports, then connecting workers or dashboards may report errors (404, 500, et al), or may simply hang and eventually time out. The solution is to open the needed port ranges, disable the firewall between the server and client networks, or configure Envoy
-
A stale browser page - Depending on network configuration, intermediary routers and firewalls, and browser configuration, it is possible that a Deephaven Web UI login page will look active, but the backing connection has been closed. In this case, attempting to log in may hang on "Authenticating..." or "Loading Workspace...". The solution here is simply to force a refresh of the page (F5, Cmd+R, or click a browser refresh button) and reattempt the login.
-
Outdated Web UI JavaScript - If the Deephaven cluster has been recently upgraded, clients may have an out-of-date version of the
irisapi.nocache.jsJavaScript that supports most Web UI features. This can cause a variety of strange failures. The solution here is to force a reload of JavaScript (Shift+F5, Shift+Cmd+R), or close and reopen the Web UI page in the browser.
If some other failure is seen when attempting to log in to the Web UI, details of what is happening between the browser and the Web API can be viewed by right-clicking on the Web UI login page and choosing "Inspect", "Inspect Element", or similar, depending on the browser being used. This will open a dialog with various tabs or panels. There should be a panel labelled something like "Console". The Console tab/panel will present a log of browser/Web API interactions, which may reveal what is causing the failure. Additional information can be obtained from the Deephaven server, by viewing the Web API Service logs (/var/log/deephaven/web_api_service/WebServer.log.current or ...timestamp), and, in the case of an authentication problem, the authentication server log (/var/log/deephaven/authentication_server/AuthenticationServer.log.current or ...timestamp).
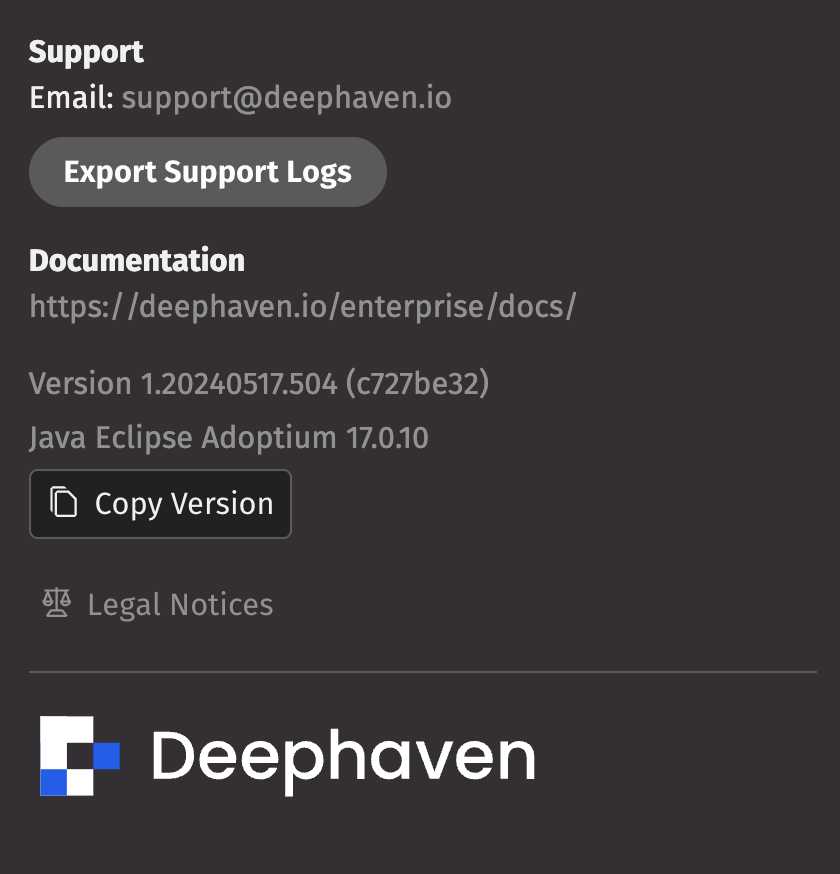
For Web UI problems that occur after logging in, the browser "Inspect" method detailed above is also often helpful, and there is also an "Export Support Logs" button available under the user menu (upper right corner):