Work with tables
Once you create or open a table in Deephaven, you can further manipulate the table's content and layout via the User Interface (UI). The UI allows you to hide or show certain columns, change the column order, resize column widths, filter and/or sort the data in the columns, add more columns to the table, and more.
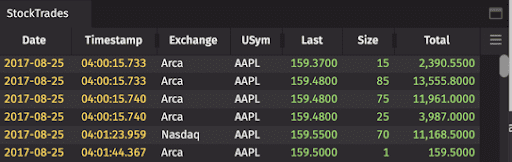
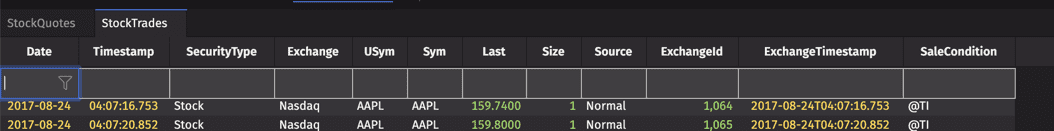
The examples in this guide use the StockTrades table, which contains stock trade data:
Adjust column width
You can adjust the width of individual columns within tables by clicking and dragging the border between column headers:
If you do not manually alter the width of columns, they will auto-size to fit their data. Sizing a column down all the way sets the column to hidden.
Column information
You can view basic information about the content of each column by hovering your cursor over the column name. For example, the screenshot below demonstrates the information available when hovering the cursor over the Ticker column:
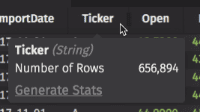
The tooltip shows the column name (Ticker), the data type (String), and the number of rows in the column (656,894). You can view additional information about this column by selecting the Generate Stats option. Stats are automatically generated for columns with less than 100,000 rows.
Generate stats
Hover the mouse over a column header and select Generate Stats to display a summary statistics popup:
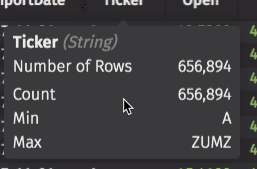
The stats displayed by the popup vary depending on the column data type. Some column types - such as array columns created by group_by - do not have summary statistics. The following sections provide a list of summary statistics for each data type.
Data Type: Boolean
| Name | Description |
|---|---|
| Count | Number of non-null rows |
| Number of Rows | Total number of rows |
| Unique Values | Number of distinct values |
Data Type: Date/Timestamps
| Name | Description |
|---|---|
| Count | Number of non-null rows |
| Number of Rows | Total number of rows |
| Min | Earliest date |
| Max | Latest date |
Data Type: Number
| Name | Description |
|---|---|
| Count | Number of non-null rows |
| Number of Rows | Total number of rows |
| Sum | The sum of all values in this column |
| Sum (abs) | The sum of the absolute values of all values in this column |
| Sum (sqrd) | The sum of the squared values of all values in this column |
| Min | The smallest value in this column |
| Max | The largest value in this column |
| Min (abs) | The smallest absolute value in this column |
| Max (abs) | The largest absolute value in this column |
| Avg | The average value in this column |
| Avg (abs) | The average absolute value in this column |
| Std Dev | The standard deviation of the values in this column |
Data Type: String
| Name | Description |
|---|---|
| Count | Number of non-null rows |
| Number of Rows | Total number of rows |
| Unique Values | Number of distinct values |
Rename tables
You can rename any open table by right-clicking its tab:
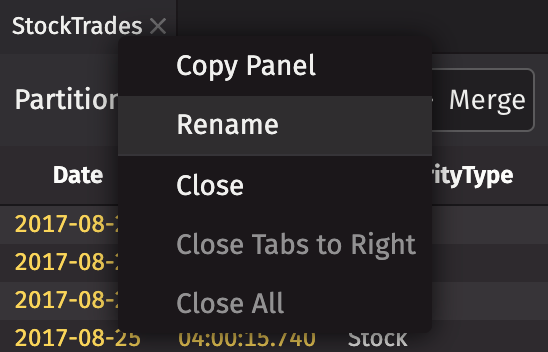
Table Options menu
You can open the Table Options menu from any Deephaven table by clicking the icon at the right of the header row:
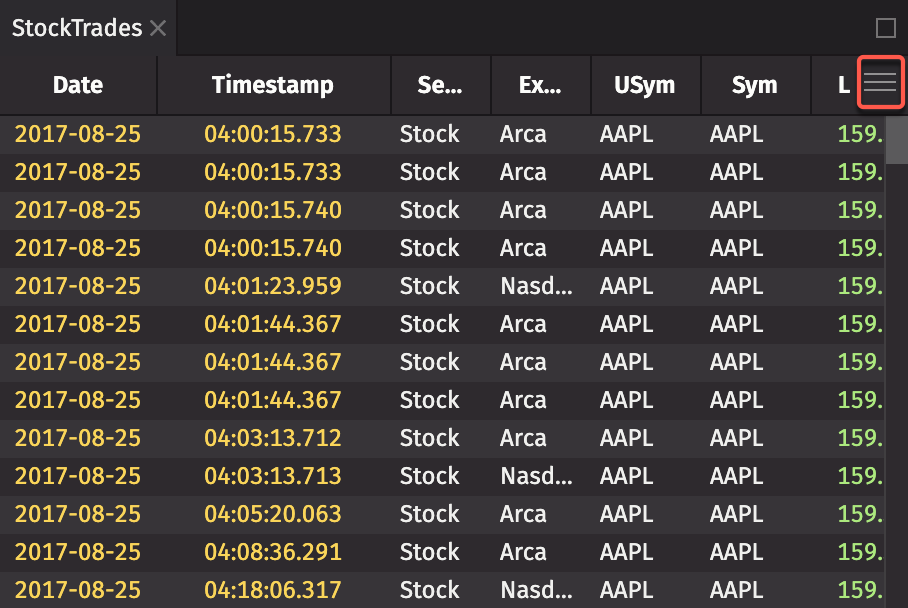
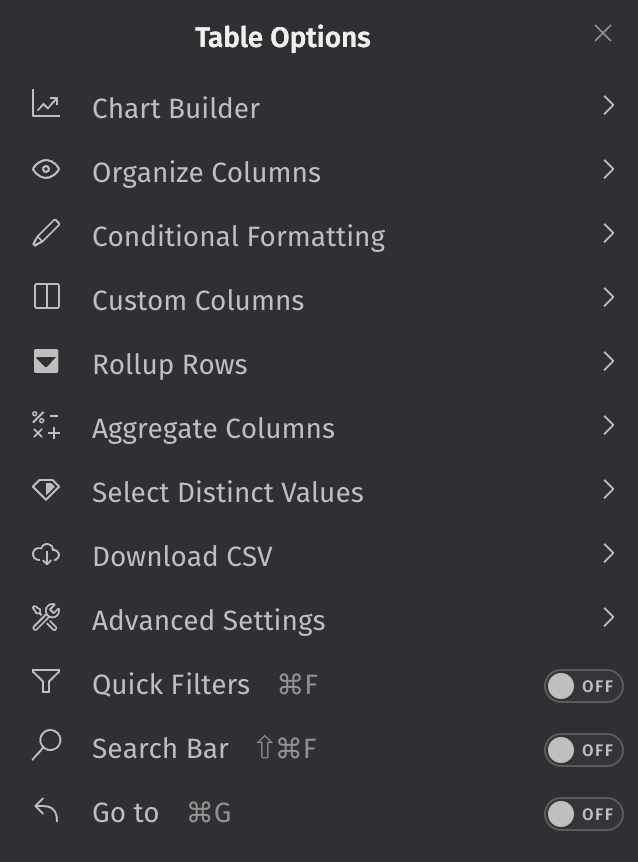
Chart Builder
The Chart Builder allows you to create applicable charts from the table data.
Hide, group, and order columns
This feature allows you to quickly hide/show, rearrange, and sort columns in one place.
-
The dialog lists the columns in the table; the eye icon next to each indicates which columns are visible. Click the icon to show/hide columns.
-
You can reorder columns by dragging and dropping items in the list, or by using the arrow buttons at the top of the dialog.
- To create column groups, select one or more columns and then click the Group button as shown below. You can move columns in and out of column groups in this menu, either via drag-and-drop or the arrow buttons at the top of the menu. You can also change group names and colors. Note that the Show All Columns option is only available when at least one column is currently hidden from view. When selected, all hidden columns are returned to their original location in the table.
- The toolbar includes additional buttons to sort the table in ascending or descending order, and a Reset button to restore the table to its default arrangement.
Conditional formatting
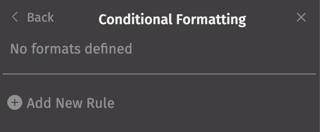
The Conditional Formatting feature allows you to define conditional formatting for cells or rows by creating new rules.
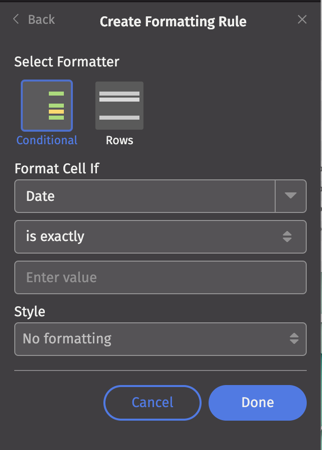
Select Add New Rule, then choose Conditional to format individual cells or Row to format specific rows.
-
Choose a column from the dropdown list provided.
-
Select the desired condition, such as "is exactly", "contains", "starts with", etc.
-
Select a style:
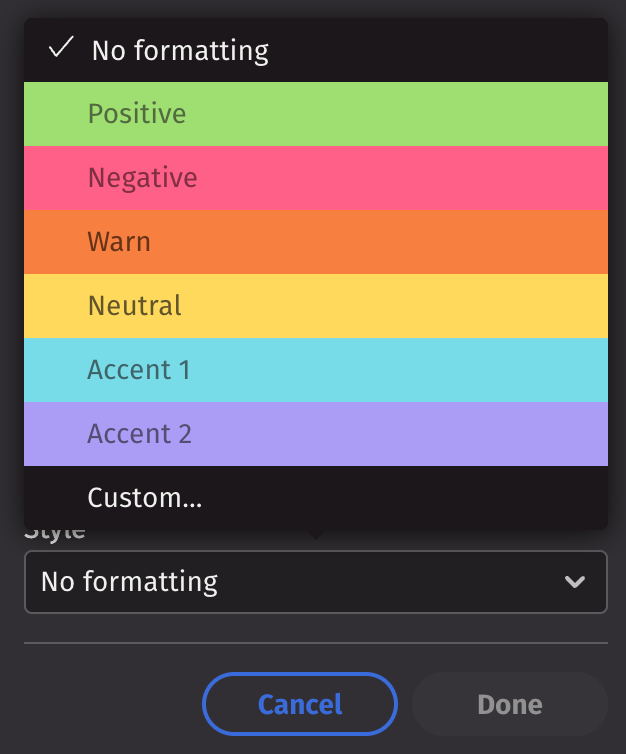
Six colors are available by default. The "Custom" option allows you to define your own color.
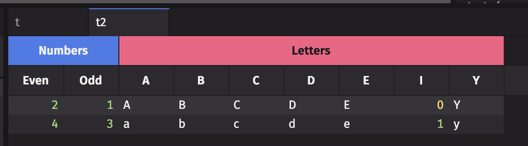
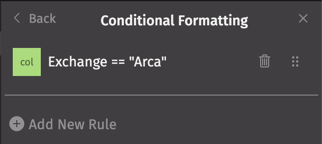
In the example below, all cells in the Exchange column containing the value "Arca" are colored in the "Positive" style:
Delete or reorder new rules by returning to the Conditional Formatting dialog.
Manage Custom Columns
Manage Custom Columns is a feature that enables you to quickly add new columns to house custom calculations directly in the Deephaven interface, rather than updating a table's query.
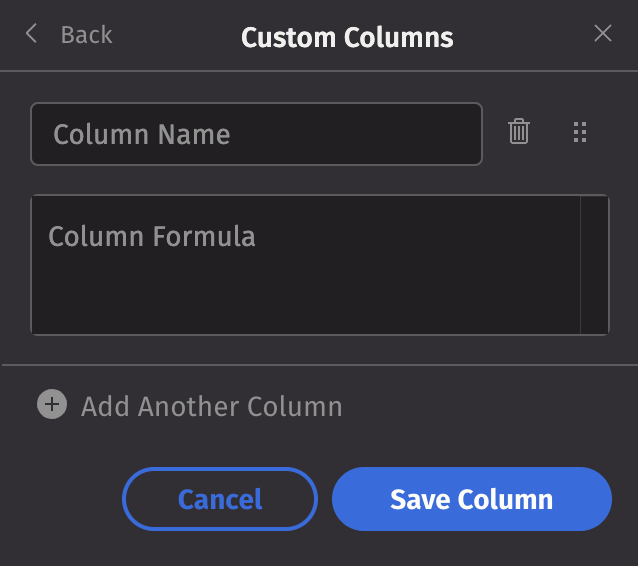
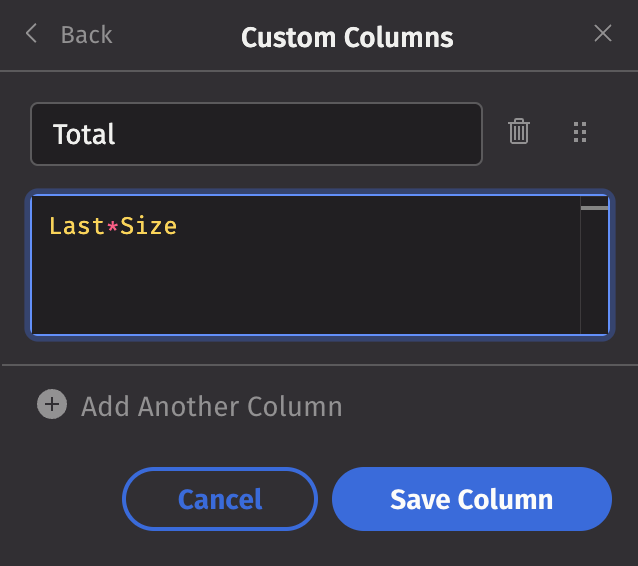
In the Manage Custom Columns dialog, enter the name of the new column, then write the formula below. Select Save Column to add the new column. For example, you could add a new column called "Total" that multiplies the last price and size for each row in the StockTrades table:
Reopen the dialog to edit your selections:
- Add other columns and their respective formulas by clicking the + Add Another Column button.
- It may be necessary to arrange the order of your custom columns for calculations to work correctly. To change the order of the new custom columns, click the drag icon (
 ) and drop the column information in the desired position.
 - To remove a custom column, click the trash can button (
 ) to the left of the column name, and select Save Column.
Rollup rows
You can create a roll-up table from any table in Deephaven.
Select Rollup Rows from the Table Options menu, then drag the desired Grouping Column into the box at the top of the dialog:
You can select multiple grouping columns, and reorder or delete your selections by using the icons to the right of the column name.
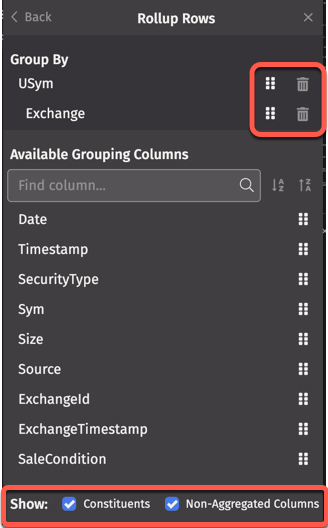
Two Show options are available:
- Constituents—When checked, the roll-up table shows which rows from the source table contributed to the hierarchy at the lowest level.
- Non-Aggregated Columns—When checked, the roll-up table shows all the columns in the source table. When unchecked, it only shows columns with either a grouping or an aggregation applied.
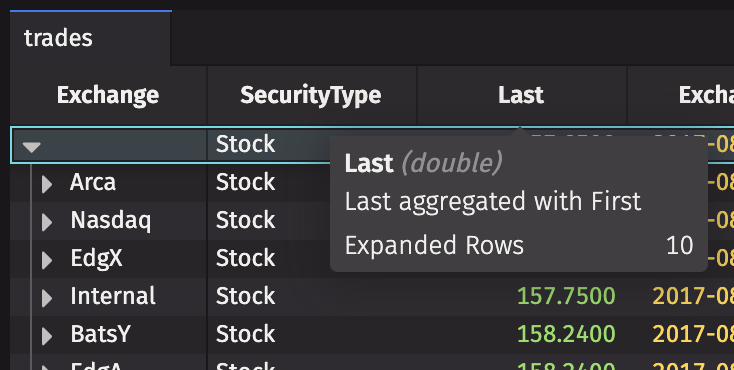
Hover over a column header to display a tooltip showing which aggregation has been applied to the column. For example, the tooltip for the Last column looks like this:
Aggregate columns
Aggregate Columns is a feature that adds a totals row to the selected Deephaven table. The row can be configured to show one or more aggregations.
Select Aggregate Columns from the Table Options menu. The Aggregate Columns dialog allows you to choose among several aggregation operations. See available aggregations for a full list.
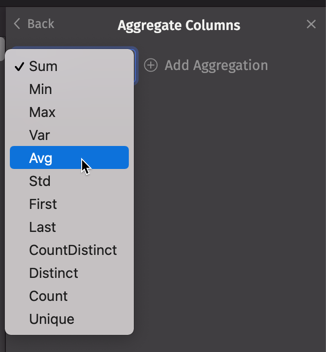
Choose an operation from the drop-down list, then click Add Aggregation to add the totals row to the Deephaven table. In this example, the Avg aggregation is selected:
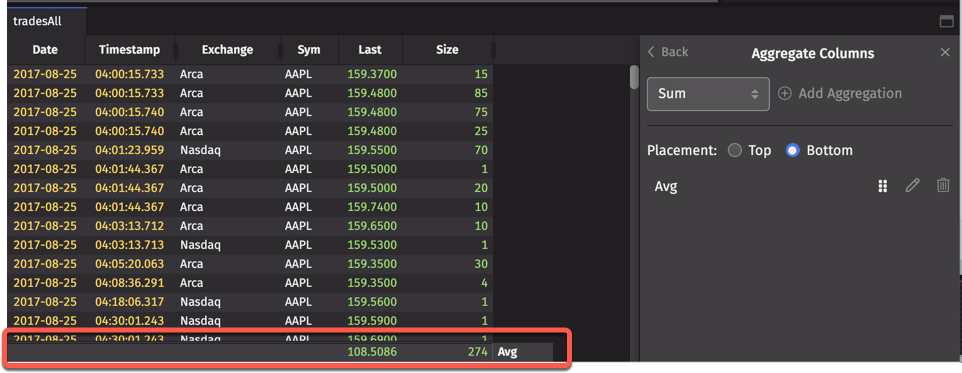
You can also place the row at the top or bottom of the table.
You can select multiple aggregations. Use the icons at the right of the aggregation type to reorder, edit, or delete selected aggregations:
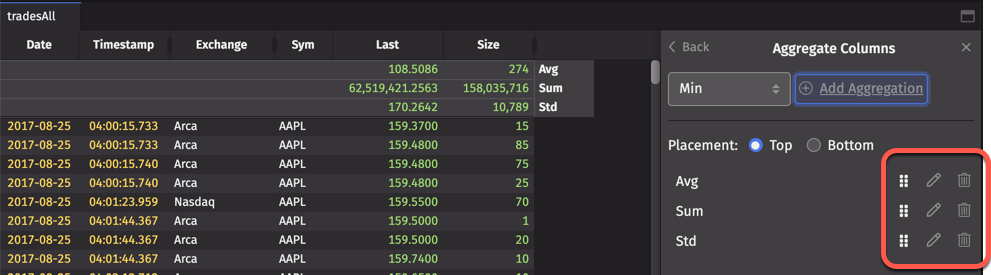
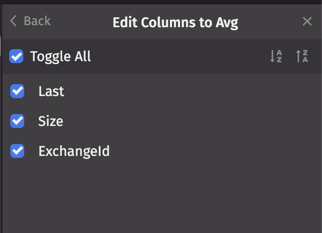
When the Edit icon is selected, users can choose which applicable columns to apply the aggregation to. For example, three columns were averaged in the example above, but a user can deselect (or reselect) columns to include in the totals:
Aggregated roll-up tables
You can apply the Aggregate Columns feature to any Deephaven table, including roll-up tables. As shown below, the columns in the roll-up table identify which aggregation operation is being applied.
Available aggregations
| AggType | Description |
|---|---|
| Sum | Displays the total sum of the column |
| Avg | Displays the total average of the column |
| Min | Displays the minimum of the column |
| Max | Displays the maximum of the column |
| Var | Displays the variance of the column |
| Std | Displays the standard deviation of the column |
| First | Displays the first value of the column |
| Last | Displays the last value of the column |
| CountDistinct | Displays the number of unique values in each group |
| Count | Displays the number of non-null items present. Only available in roll-ups. |
| Unique | Displays: - the single unique value contained in each specified column, - a customizable value, if there are no values present, - or a customizable value, if there is more than one value present. |
Select distinct values
The Select Distinct Builder modifies a table to show unique values from a selected column.
Note
Using the Select Distinct Builder resets any previously applied filters to the table.
Select Select Distinct Values from the Table Options menu. The dialog allows you to choose a column from which to display unique values. Additional columns may be added. Delete selections using the trash icon to the right of the selection's name. Deleting all selections restores the table to its original state.
Download CSV
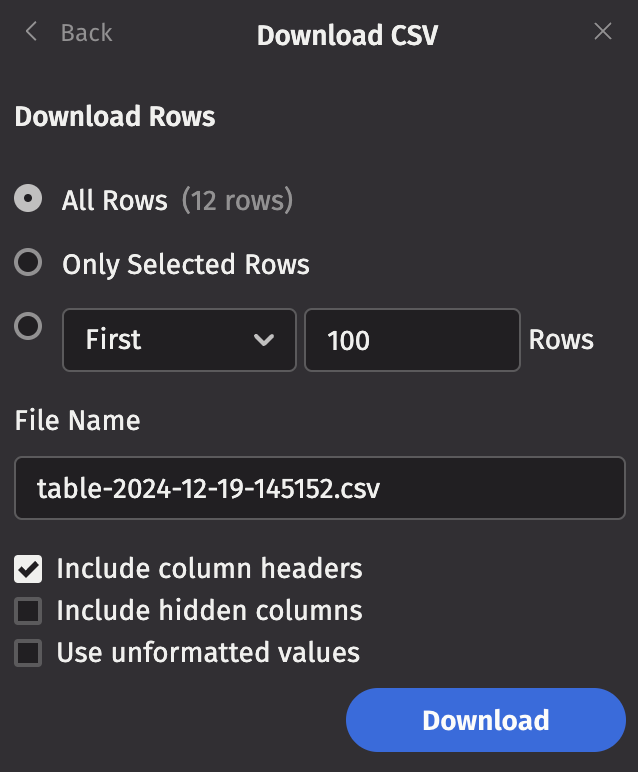
You can download all or some of the rows in a Deephaven table into a CSV file to save on your local computer.
Choose from the following options:
- All Rows - This downloads the entire table. The number of rows appears in parentheses.
- Only Selected Rows - This downloads only the rows you have highlighted in the table. When rows are selected, the number of rows appears in parentheses.
- First/Last - This downloads rows from the start or end of the table. Select First or Last from the drop-down menu and specify an amount of rows.
A file name is automatically generated, but you can rename the file in the File Name field. Click Download to save the CSV file into the default location on your local computer.
Advanced Settings
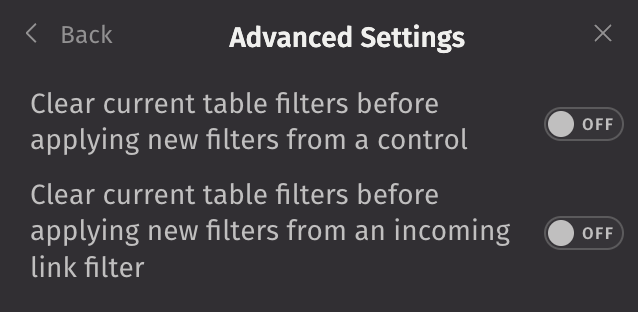
Under Advanced Settings, two options are available:
-
Clear current table filters before applying new filters from a control - Control filters are applied by a control, such as an input filter or dropdown filter. Setting this button to "On" allows control filters to clear / override any previously applied filters.
-
Clear current table filters before applying new filters from an incoming link filter - The Linker tool applies inbound filters to a table. Setting this button to "On" allows inbound filters to clear / override any previously applied filters.
Quick Filters
Set the Quick Filters button to On to add the Quick Filters bar to that table:
Tip
You can also open or close the Quick Filters bar using the keyboard shortcut Ctrl+F or ⌘F.
Search Bar
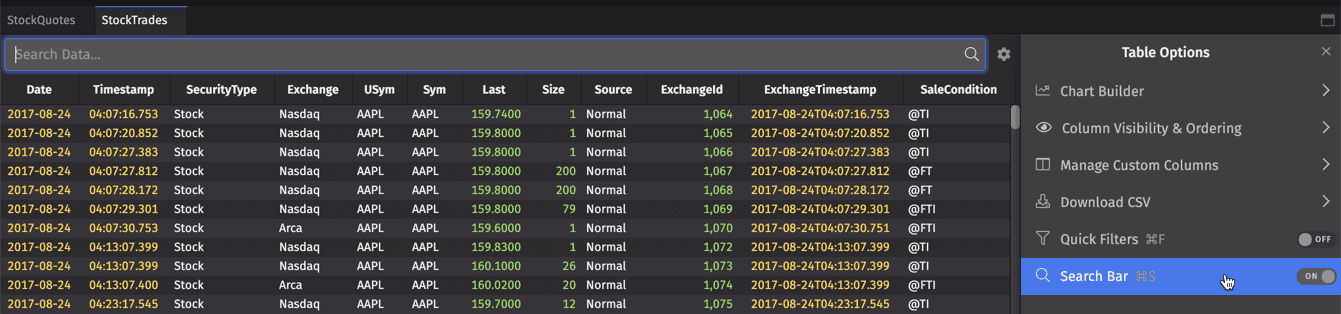
Set the Search Bar button to On to add the search bar to that table:
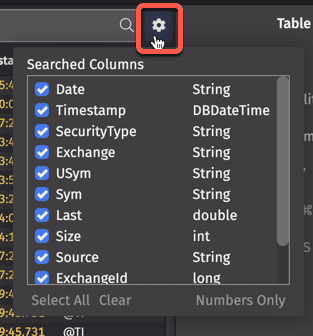
By default, Deephaven searches all columns for your term. You can configure cross-column search using the Settings dialog at the right of the search bar:
Tip
You can also open or close the search bar using the keyboard shortcut Ctrl+S or ⌘S.
Table context menus
Dashboard tables contain several context menu shortcuts to help speed analysis. To access these menus, simply right-click on the applicable part of the interface as described below.
Column headings context menu
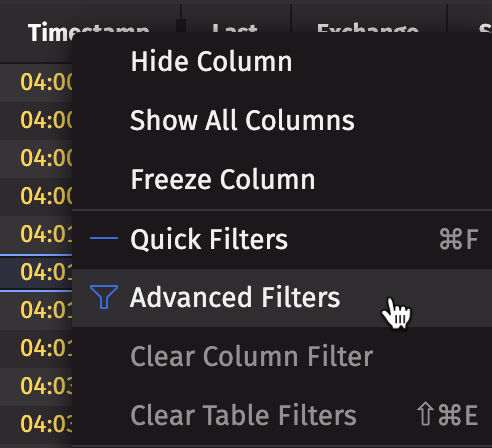
The screenshot below demonstrates the context menu that is revealed when a user right-clicks on a column heading. In this case, the right-click selected the EODTimestamp column.
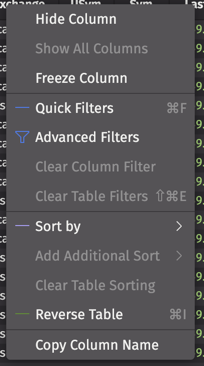
-
Hide/Show Columns - Select the Hide Column option to remove that column from the table display. The Show All Columns option is only available when a column has previously been hidden. When selected, all hidden columns are returned to their original location in the table.
-
Freeze Columns - Select this option to freeze the column to the left side of the table so it stays in view while scrolling horizontally.
-
Advanced Filters - Select this option to open the Advanced Filters dialog window. See Filter Tables.
-
Quick Filters - Select this option to open a new toolbar on top of the table. See Filter Tables.
-
Remove All Filters - Select this option to clear any filters applied to the table.
-
Remove Column Filter - Select this option to clear a filter applied to that individual column.
-
Sort by - Select this option to provide sorting methods for that column. See Sort Tables.
-
Add Additional Sort - Select this option to add an additional sort to that column. See Sort Tables.
-
Remove All Sorts - Select this option to remove all sorts applied to that table.
-
Reverse Table - Select this option to reverse the entire table's order. See Sort Tables.
-
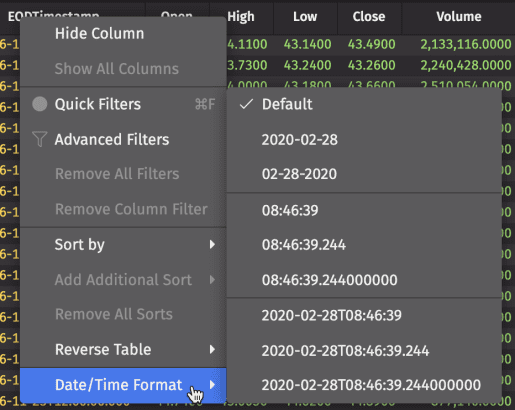
Date/Time Format - If the selected column contains a DateTime data type, an option to set the Date/Time Format appears in this context menu. When selected, the secondary context menu provides the following options:
-
Number Format - If you right-click on a column containing numerical data, the Number Format option becomes available from the context menu, as shown below:
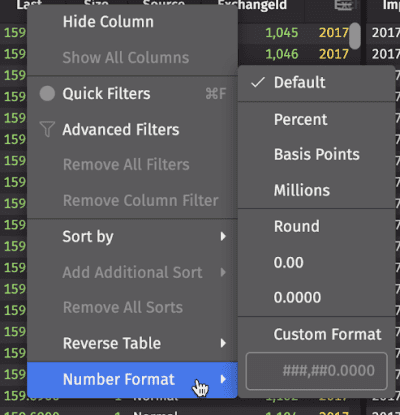
Table data context menu options
Right-click on the table data to view the following context menu shortcuts:
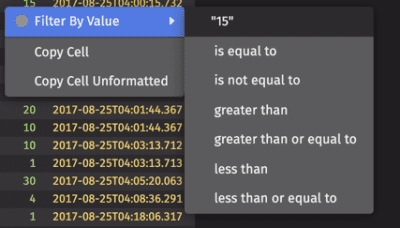
- Filter By Value - This context menu provides six options to filter the column based on the value of the table cell where the user right-clicked.
- Copy Cell/Copy Cell Unformatted - This option copies the cell's data with formatting to the clipboard.
- Copy Cell Unformatted - This option copies the cell's data without formatting to the clipboard.
Filter Tables
Advanced Filters
As the name implies, the Advanced Filters feature provides advanced options to filter data in a table. Access the Advanced Filters dialog through the right-click menu on column headings:
Note
Advanced Filters can also be accessed by clicking on a column's funnel icon within the Quick Filters bar.
Sorting options
The top of the Advanced Filters window provides two buttons that allow users to sort the entire underlying table based on the column selected. You can sort the table in descending or ascending order by clicking the appropriate button:

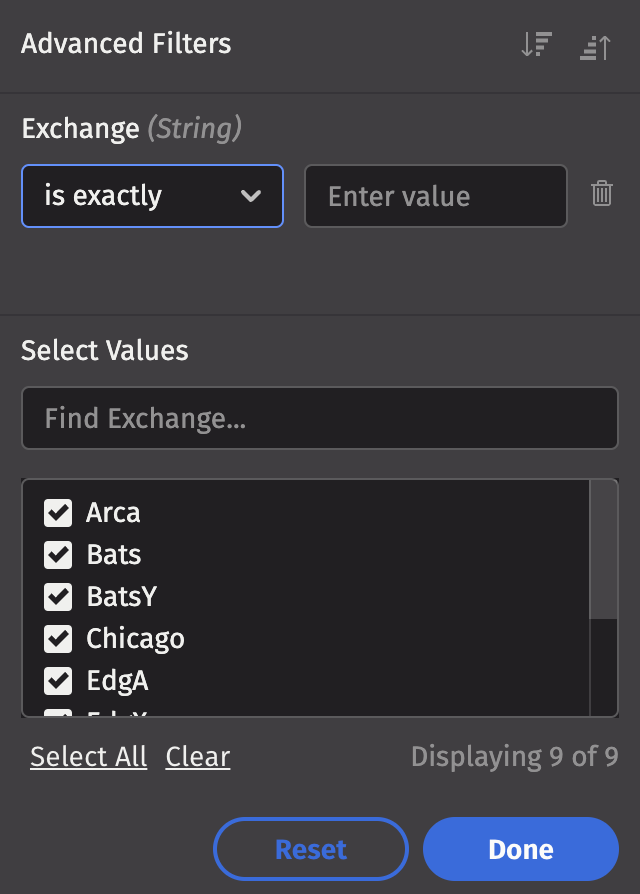
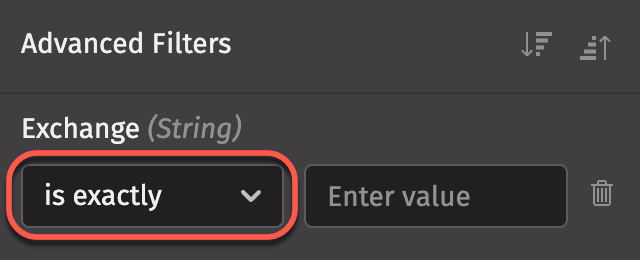
Enter value(s)
Immediately below the name of the filtered column is a selection menu that provides options for filtering the data in the selected column. The filtering options available in the Advanced Filters menu depend on the data type of the column selected.
In this example, the Exchange column contains the String data type:
Click in the menu to reveal the filtering options available for this column type (String):
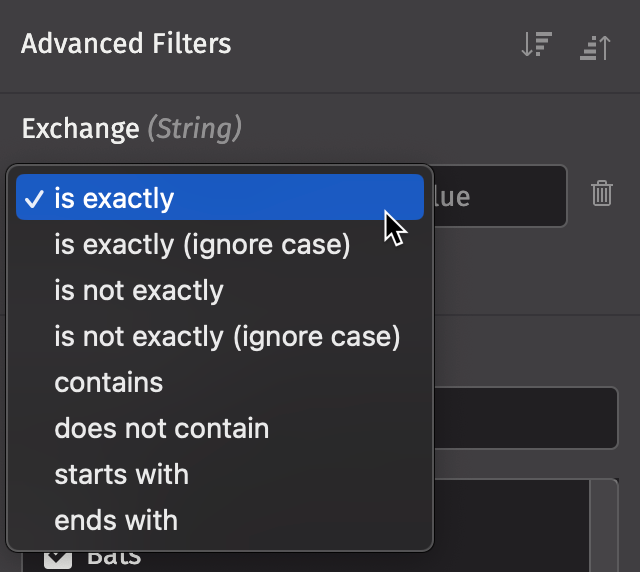
Note
The filter options for other data types may differ from the choices shown above.
Once you have selected the filter option, enter a value in the field to the right of the filter you just chose. In this example, Arca is the filter value:
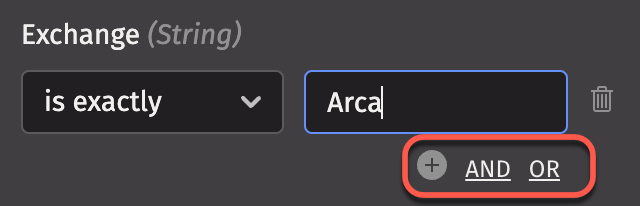
After you enter the value, the underlying table is filtered accordingly.
You can filter the table by a secondary value by clicking on the AND or OR buttons just below the value field (circled above). Selecting either of them will add a new filter set to the dialog window. In this example, a second filter has been added for Bats using the OR option.
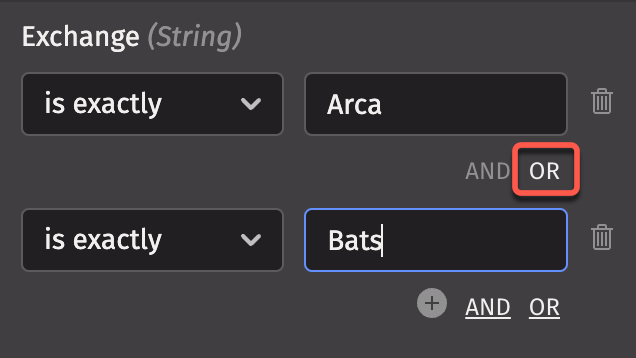
When this filter set is applied, the table only presents rows of data that include Exchange values equal to Arca or Bats.
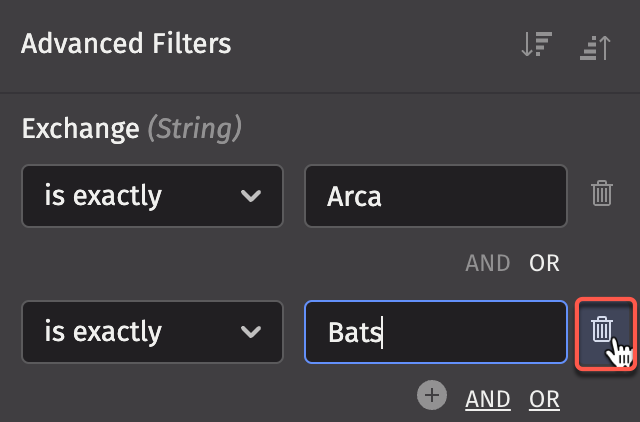
Click the trash can icon to the right of the filter value to remove filters from the dialog:
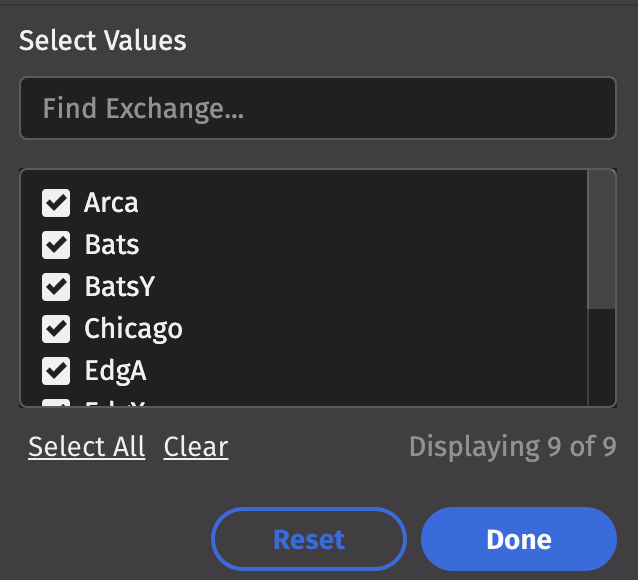
Select value(s)
The lower portion of the Advanced Filters dialog enables users to filter the underlying table by selecting specific values. Users can search for a value in the Find Ticker... field, or scroll through to select or deselect specific values found in the column.
Filter order
The upper and lower portions of the Advanced Filter work conjunctively - they both filter the same column. However, the upper portion of the Advanced Filter is processed first. Therefore, if you filter a table using the upper filter criteria, the filtering specified in the lower section will be applied to the table after it has been filtered by the upper portion.
Remove filters
- Select the Reset button to remove all filters.
- Remove one or all filters by using the Column Header right-click menu.
Quick Filters
The Quick Filters bar is an easy way to create a simple column filter. It allows you to perform basic equal-to, less-than, greater-than, etc. types of filters in columns.
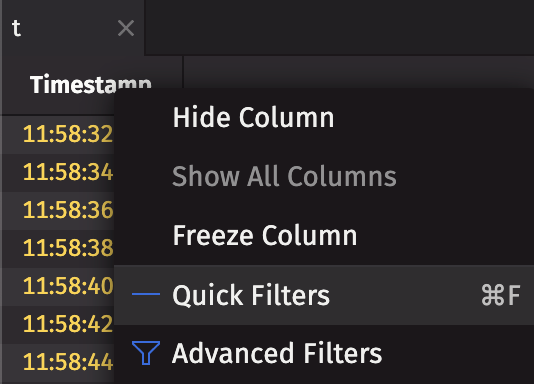
Access Quick Filters by pressing Ctrl+F or ⌘F on the keyboard, or by right-clicking on a column header in a table and selecting "Quick Filters" from the drop-down menu:
Now you can type filter statements into the Quick Filter field to filter one or more columns:
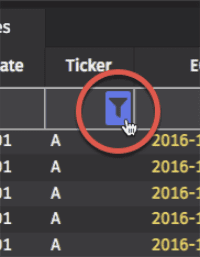
More advanced filtering can be accomplished using Advanced Filters. For quick access to the Advanced Filters menu, select the funnel-shaped icon in the column header field:
The Quick Filter statement options for each column depend on its data type. The following sections provide a list of filter statement options for each data type.
Number Data Types
| Symbol | Meaning | Example(s) |
|---|---|---|
| = (or nothing) | Equal to |
|
| != | Not equal to |
|
| > | Greater than | >50 |
| >= | Greater than or equal to | >=50 |
| < | Less than | <50 |
| <= | Less than or equal to | <=50 |
| && | Greater than X and less than Y | >10 && <50 |
| || | Or | NYSE || Nasdaq |
| null | No value | null |
Note
You can combine multiple filtering statements in one Quick Filter field.
String Data Types
Filter statements for string data types are case-insensitive, and can use comparisons, simple wildcard rules, or regex.
| Symbol | Meaning | Example(s) |
|---|---|---|
| = (or empty) | Text equals |
|
| != | Text does not equal |
|
* | Start or ending wildcard. Matches zero or more letters. |
|
| ~ | Text contains | ~sp |
| !~ | Text does not contain | !~sp |
| null | Text field is empty (no value) |
|
| !null | Text field is not empty |
|
Note
- You can combine filtering statements. For example,
!=A*is equivalent to "Text does not equal any value that starts with A". - \null can be escaped to match "null" as a string vs value.
- To search for an operation symbol, you must escape it with a backslash
\. For example, to find the equal sign, use\=.
Date/Time Data Types
Date/Time filter statements are similar to filter statements for numeric data types. Date values that can be used in the filter statement include the year, month, and day. You can also use time values in conjunction with date values, including hour and minute, and optionally seconds and nanoseconds (e.g., 2018-01-25 09:25).
You can also use magic words such as "now", "today", and "yesterday". When "now" is used, the values include the timestamp down to the millisecond using the appropriate time zone.
| Symbol | Meaning | Example |
|---|---|---|
| > | Greater than (after) |
|
| >= | Greater than or equal to |
|
| < | Less than (before) |
|
| <= | Less than or equal to |
|
| = (or empty) | Equal to |
|
| != | Not equal to |
|
| null | No value | null |
| !null | Not null (has a value) | !null |
Boolean Data Types
Boolean filtering statements work on columns displayed as "true" or "false".
- To filter boolean columns, you can use any derivation of the words true or false, and in any letter case. For example, you can filter the "true" value using true, T, True, t, tru, tRUe, TRUE, etc.
- You can also use the binary values 0 (true) or 1 (false) to filter boolean columns.
- Use "Null" (also case insensitive) to filter for empty values in boolean columns.
Sort tables
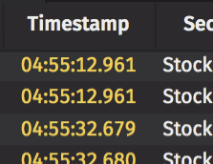
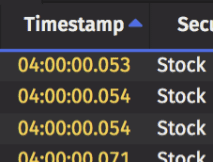
You can sort values in a table in ascending or descending order by clicking on a column heading:
- Click once on a column heading to sort the table data in ascending order based on the content in the column selected. When the table is sorted in ascending order, a blue "up" arrow appears to the right of the column name.
- Click again on the column heading to change the sort to descending order. When the table is sorted in descending order, a blue "down" arrow appears to the right of the column name.
- To clear the sorting order, click the column header one more time.
A blue underline displays across the bottom of the column heading row anytime a table is sorted.
| Unsorted | Sorted Ascending | Sorted Descending |
|---|---|---|
 |  | 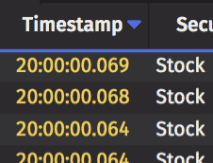 |
Sorting options are also available the in Advanced Filters dialog.
Sort menu
You can access sorting options through the right-click menu on column headings. The example below shows options for a column named "Exchange":
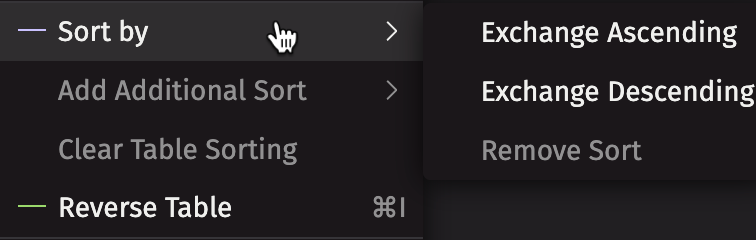
- If another column has already been sorted, the Add Additional Sort option becomes available on the remaining columns in the table.
- Selecting Remove All Sorts clears any sorts that have been applied to the table.
Reverse table order
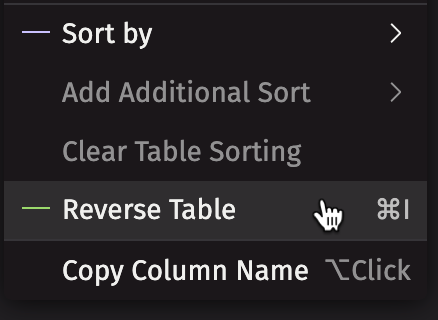
To reverse the order of the rows in an entire table, right-click on any column header in the table and select Reverse Table from the sorting menu:
In the example below, the StockQuotes table has been reversed (as indicated by the green bar):
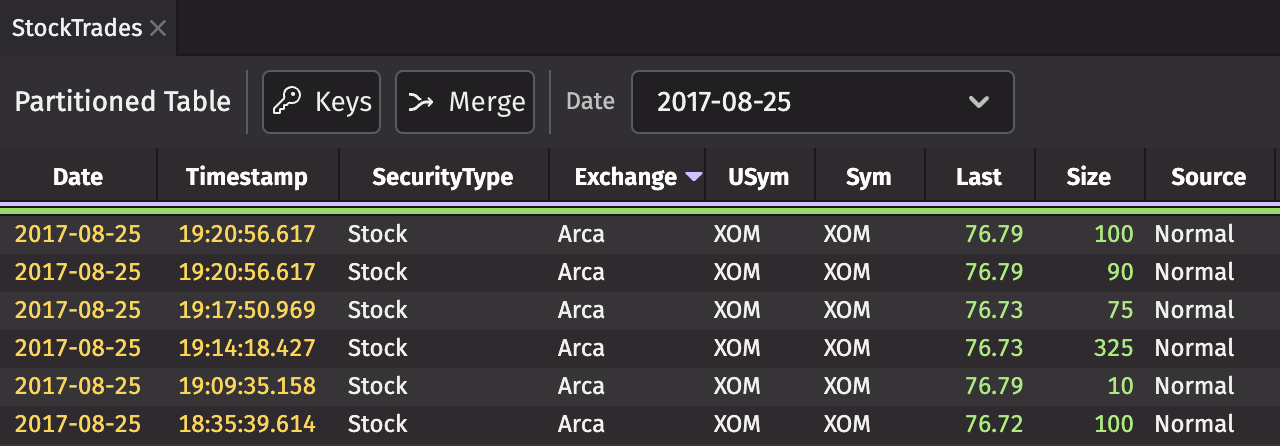
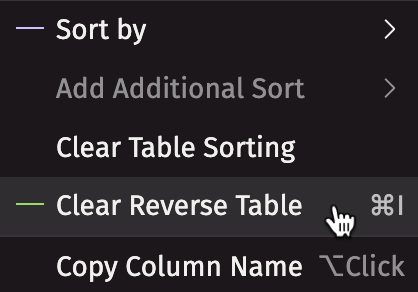
The table is also sorted on the Exchange column; the green reverse table bar sits below the violet sort bar to indicate the table is both reversed and sorted.
Once you have reversed a table, the Reverse Table option changes to Clear Reverse Table. Select this option to return the table to its original order.