Monitoring Queries
This guide covers best practices for monitoring Persistent Queries (PQs) in Deephaven. Regular monitoring of queries is critical to identifying, diagnosing, and resolving issues related to performance, resource usage, correctness, and stability in a timely fashion. The methods presented combine the use of Deephaven's internal tables and dashboards.
Deephaven's internal tables contain information about the state of the system, including query status. These tables can be queried individually or together to diagnose slow and/or unresponsive queries. Combining these tables with additional widgets and graphical tools helps continuous monitoring efforts and provides a comprehensive view of the system's health.
The techniques presented are intended to help you troubleshoot queries independently. However, some issues may require assistance from Deephaven support. When serious, unexpected, or esoteric issues arise, it's recommended to send Console logs, Exception messages, and any other pertinent information to the support team.
Internal tables
All Deephaven installations include many tables that contain specific information for the system's internal use. These tables are updated by various processes. They contain details about processes, workers, PQ states, and all query operations. These tables are stored in the DbInternal namespace.
Every internal table contains a ProcessInfoId column with a unique identifier for a particular worker and can be used to correlate values across multiple tables.
Query Operation Performance Log
The Query Operation Performance Log (QOPL) contains information about performance details on query operations such as duration and memory usage. This table can be queried in a Core+ worker with the following code:
See Query Operation Performance Log for an explanation of each column in the table.
Update Performance Log Core
The Update Performance Log describes the time and resources used by the Update Graph. It contains aggregated performance details on incremental update operations performed in update graphs. This table can be queried in a Core+ worker with the following code:
See Update Performance Log for an explanation of each column in the table.
Persistent Query State Log
The Persistent Query State Log contains information about the state of PQs. Any time a worker's state changes, whether it be from starting, stopping, or anything else, that information gets logged to this table. It can be queried in a Core+ worker with the following code:
Statuses of queries that have not failed in this table can be one of:
ConnectedAcquiring WorkerInitializingCompletedRunningStopped
Statuses of queries that have failed in this table can be one of:
See Persistent Query State Log for an explanation of each column in the table.
Failed
This means that the PQ failed before or during initialization. Refer to the ExceptionMessage column in the Persistent Query State Log for specific details.
- The most common failure is an error in a script. Expanding the cell shows the full text of an error message. As an example, leaving a closing quotation mark off a string will result in a
ScriptExceptionand the line number of the error. - Queries fail if the query exceeds the query server's maximum heap size. In cases where this happens, increase the memory (heap) usage value in the Query Monitor.
Error
This means that an error occurred after the query was initialized (e.g., while processing incremental updates). The ExceptionStackTrace column may offer more information in this case. To review this information, expand the relevant cell to open a window with the full text, e.g. by right-clicking the entry and selecting View Cell Contents.
Disconnected
This means the worker process disconnected from the dispatcher. Query workers typically disconnect from the dispatcher as a result of an exceptional error or excessive workload that prevents the worker from sending a heartbeat. Common reasons for a disconnection include:
- The server runs out of heap and an
OutOfMemoryErrornotification occurs, thus killing the JVM. - The JVM is stuck in Garbage Collection so long that it is unable to respond to dispatcher heartbeats for 60 seconds.
- A deployment issue results in a
NoSuchMethodError. - An error occurred in internal JVM or a native code error occurred (aka, a JVM Hotspot Error).
The following query shows all the times a PQ entered a failure state on the current date:
Getting the last row by serial number shows the most recent state of any PQ that attempted to start on the current date:
Combining the above queries indicates which PQs are currently in a failure state:
Alternatively, the Query Monitor provides details about the PQs that you are authorized to see. Information about each query is stored in columns, including the owner, query name, whether it's enabled, and its status. If a PQ has failed, the ExceptionDetails column includes the same raw data as the Persistent Query State Log, which may contain pertinent information.
To read the ExceptionDetails, expand the relevant cell. This opens a window that displays the full content. Alternatively, you can click the row of the relevant PQ, which presents its ExceptionDetails in its configuration editor summary.
Process Event Log
The Process Event Log contains all log messages for Deephaven workers and query/merge servers. These log messages include the output from workers. It can be queried in a Core+ worker with the following code:
A common usage pattern for this table is to find all FATAL level messages for the current day:
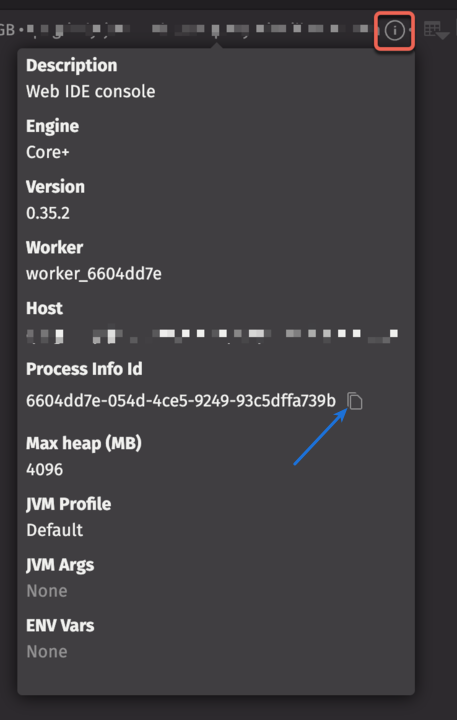
You can also find specific error messages by using the Process Info ID to query the log. This information can be found by hovering over the Info button in the console:
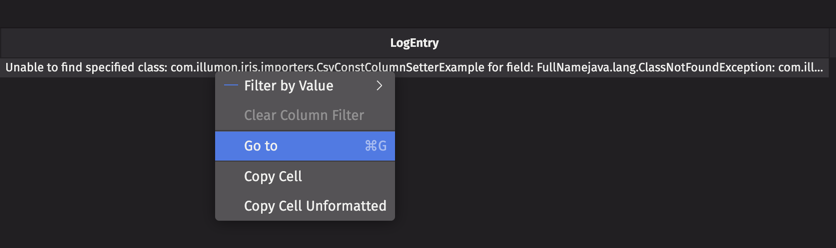
Expand the cell for your query in the Log Entry column to view a full exception message and stack trace, or right-click the cell and select View Cell Contents to open the text in its own dialog window.
To search the LogEntry column, right click it and select Go To. Alternatively, the keyboard shortcut cmd+G (Mac) or ctrl+G (Windows) opens a search box.
See Process Event Log for an explanation of each column in the table.
Monitor queries with internal tables
The following sections describe how to use the internal tables described above to monitor queries.
Operation Descriptions
When examining a query performance, you typically either have a particular operation you are interested in or you want to identify for the slowest operations. The easiest way to do either of these tasks is to look at or filter the human-readable descriptions of a query operation. The Query Performance Log (DbInternal.QueryPerformanceLogCoreV2) and Query Operation Performance Log (DbInternal.QueryOperationPerformanceLogCoreV2) tables contains a Description column. The Update Performance Log (DbInternal.UpdatePerformanceLogCoreV2) and Update Performance Ancestors Log (DbInternal.UpdatePerformanceAncestors) contain an EntryDescription column.
The image below shows a snippet of the Description column from the Query Operation Performance Log, where you can see logs related to PQs that open the StockTrades and StockQuotes tables from the LearnDeephaven namespace:
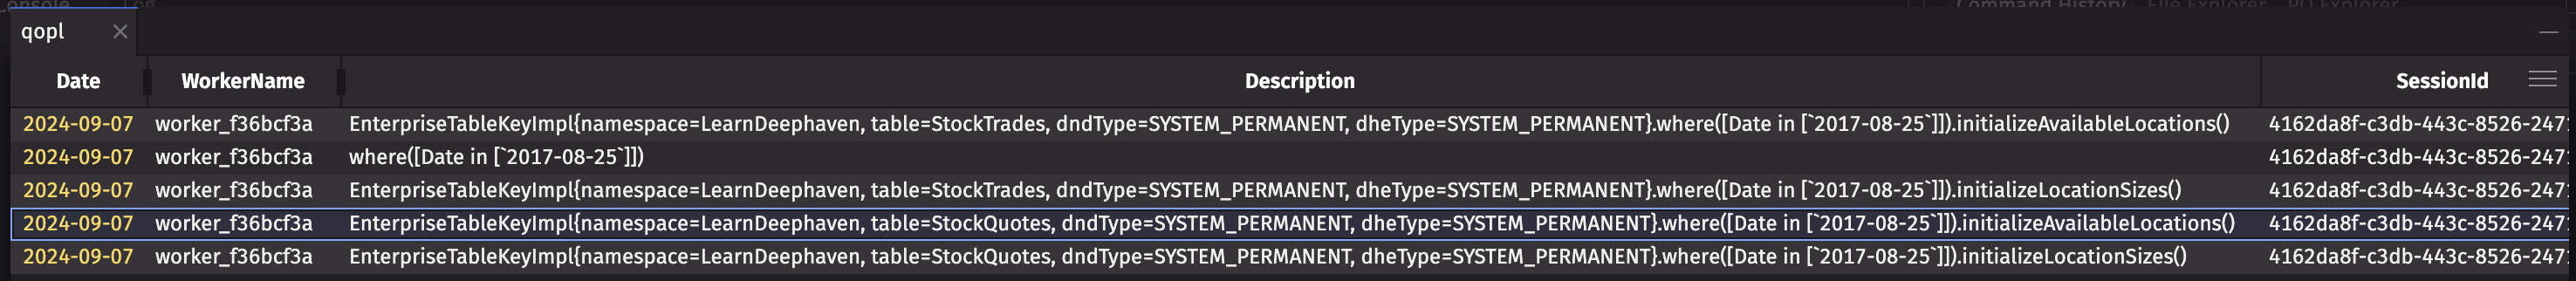
The majority of entries in this column indicate each operation performed on a table (e.g., join, sort, where, etc.). Looking at other columns in a given row (StartTime, EndTime, WasInterrupted, etc.) may help determine which specific operations are slow and offer hints as to why. While none of these log descriptions are cause for concern on their own, any action that takes a long time could contribute to performance issues.
Some descriptions found in these tables that do not easily map to table operations are:
Aggregated Small Updates(Update Performance Log only) — A summary description that indicates a group of updates, where each of which is less than the configurable threshold for logging an update. For many workloads, the vast majority of updates will not materially affect performance. Aggregating the updates saves significant disk space and bandwidth. The threshold for update logging may be configured with theQueryPerformance.minimumUpdateLogDurationNanosproperty. See Filtering Small QOPLCV2 and UPLCV2 Entries below.coalesce()— Describes producing aQueryTablethat can be used for query operations from an uncoalesced table (typically aSourceTable). TheSourceTableis a placeholder that represents your data and defers most work until a query operation is required, at which point it must be coalesced.initializeAvailableLocations()andinitializeLocationSizes()— These actions require file system access to read directories (locations) and then manytable.sizefiles. This can have a substantial impact on a historical query.Uninstrumented Code— This is code that is not enclosed in a measurement block, which means it cannot be monitored or traced. It could indicate a bug, or a complex operation that, because it is outside of our framework, has no details available.
Filter small entries
The Update Performance Log is extremely comprehensive. It contains many small entries (Aggregated Small Updates) that are not always of interest when debugging performance issues. You can set a minimum threshold to filter small entries, which frees up disk space and makes it easier to analyze the data.
Note
These properties are set in the Core properties configuration, not iris-environment.prop.
QueryPerformance.minimumUpdateLogDurationNanos=<nanoseconds>— sets a minimum duration in nanoseconds for recorded entries in the Update Performance Log. For example, setting this property to=1000000discards entries in theUpdatePerformanceLogCoreV2with a duration less than a millisecond. When set to0, all values are logged.QueryPerformance.minimumLogDurationNanos— sets a minimum duration in nanoseconds for recorded entries in theQueryOperationPerformanceLogCoreV2. When set to0, all values are logged.QueryPerformance.minimumUninstrumentedLogDurationNanos— sets a minimum duration in nanoseconds of uninstrumented code to be recorded in the Query Operation Performance Log. When set to0, all values are logged.
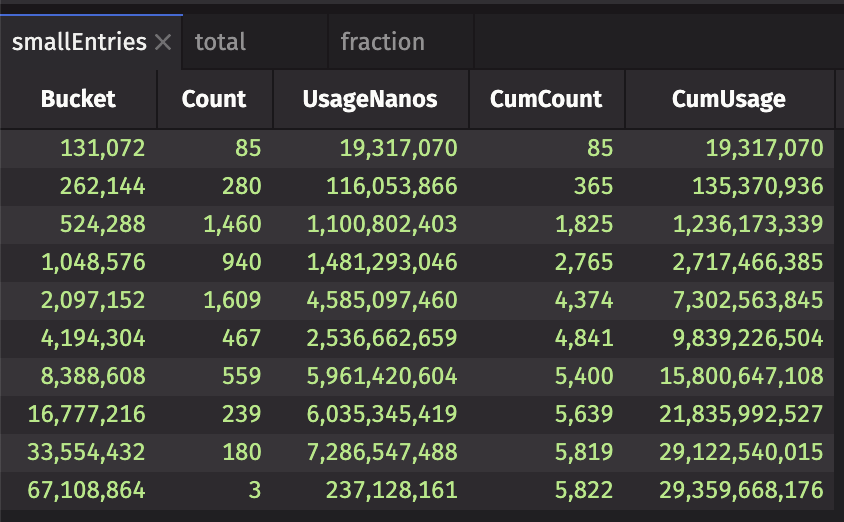
The following query creates three tables with specific totals and usage information to see just how many small entries exist in your system:
Here's what the first table looks like:
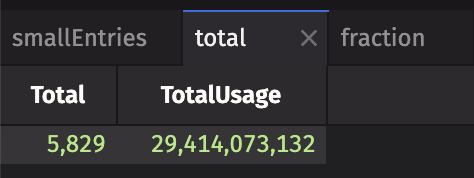
The total table shows a ticking total of the number of entries and their usage:
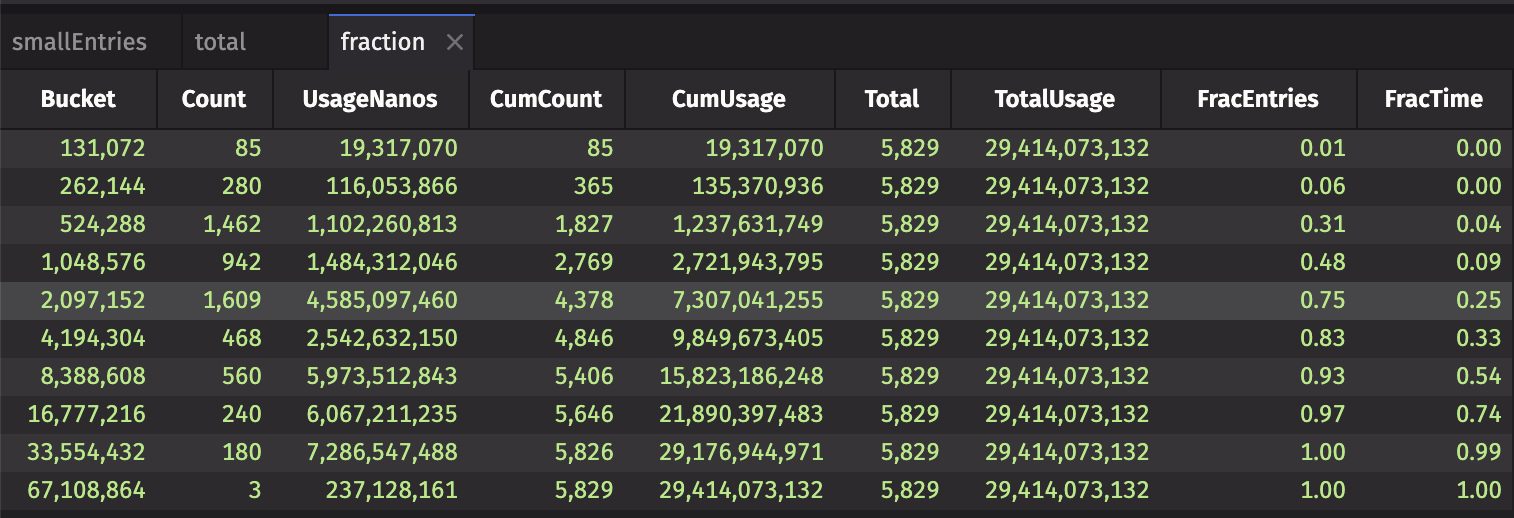
The fraction table contains the fraction of entries and time for each bucket of usage:
Performance overview
Deephaven enables you to get a performance overview for a query by its Process Info ID, worker name, or PQ name. The following code block does all three:
If the same PQ ran multiple times during the day, provide a date-time string representing an as-of time, which will narrow the search to the latest PQ run at or before the specified time:
In Groovy, the performance overview is split into three functions.
- For Process Info ID:
- For worker name:
- For PQ name:
In Python, performance_overview uses named arguments to specify the function's behavior. The following parameters may be used:
process_info_id: The Process Info ID of the worker to get performance information for.worker_name: The name of the worker to get performance information for.pq_name: The name of the PQ to get performance information for.host_name: The name of the host running the worker.as_of_time: A date-time string representing an as-of time.as_of_time_string: A string representing a date-time representing an as-of time.owner: The PQ owner. This is only relevant ifpq_nameis used.date: The date for which to get information. If not given, the current date is used.is_intraday: Determines if the table retrieval is intraday or historical.is_live: Determines whether an intraday table is live or static. This is only relevant ifis_intradayis used.
These methods open several tables and two plots (if applicable):
Tables:
QueryPerformanceQueryOperationPerformanceQueryUpdatePerformanceUpdateWorstUpdateMostRecentUpdateAggregateUpdateSummaryStatsQueryUpdateAncestorsProcessEventLogServerState
Plots:
The QueryOperationPerformance table, in particular the DurationNanos column, shows you the longest steps of your query's initialization process. For queries using intraday data, initialization is only part of the picture. Queries using live data must also update results as new data flows in. If you have an intraday query that has trouble keeping up with real-time data, you should look at the UpdateWorst table.
In the UpdateWorst table, the column to focus on is Ratio. The Ratio value shows what percentage of a query's data refresh cycle is consumed by each operation. If the sum of the Ratio column for one update interval approaches N, where N is the amount of update threads, then the query will be unable to keep up with incoming data. The amount of update threads is determined by the property PeriodicUpdateGraph.updateThreads. By default, it will be equal to the number of available processors. As using threads for updates respects dependencies, analysis may be more difficult, as the system might not be able to reach the total ratio of N due to unsatisfied dependencies or long chains of serial operations. The sum of the Ratio column for each interval, as a percentage, is available in the UpdateAggregate table.
The Update Performance Log is generated by the UpdatePerformanceTracker, which accumulates performance data for UpdatePerformanceTracker.reportIntervalMillis (defaults to 60 seconds). If the Update Graph is processing data, then the UpdatePerformanceTracker cannot generate a report. The length of time that update performance data was accumulated for is reported in the IntervalDurationNanos column. You should expect the value of this column to be between the report interval and the report interval plus the update graph cycle time. As the cycle time defaults to 1 second (configured by the PeriodicUpdateGraph.targetCycleDurationMillis property), typical values are between 60 and 61 seconds. You should monitor the IntervalDurationNanos column to ensure it does not exceed the report interval plus the target cycle time. If it does, it's a sign that cycle times are longer than expected.
Below is a description of each table that the performance overview methods produce, broken up by category.
Query initialization
QueryPerformance
This table contains top-level performance information for each query executed by the given worker. It contains data on how long each query takes to run.
A query, in this context, is the code that is run:
- Whenever you type a new command in the console and press Return. Each 'return' where you have to wait for an answer from the worker is a new query.
- When a Persistent Query initializes.
- As a result of a sort or filter in the GUI.
The most significant columns in this table are:
TimeSecs— How long this query ran for, in seconds.QueryMemUsed— Memory in use by the query (only includes active heap memory).QueryMemUsedPct— Memory usage as a percentage of the max heap size (-Xmx).QueryMemFree— Remaining memory until the query runs into the max heap size.
Note
The sum of all workers running on the server at once can never exceed the maximum total heap, and a query server will refuse to start a new worker if doing so would exceed the maximum total heap size.
QueryOperationPerformance
This table contains performance information for each operation run by a query. Every call to the standard table operations (e.g. select, update, view, etc.) constitutes a distinct operation.
The most significant columns in this table are:
StartTime— The time at which this operation started.EndTime— The time at which this operation ended.OperationNumber— Monotonically increasing sequence numbers for each operation of a query.TimeSecs— The time (in seconds) that the operation took.NetMemoryChange— The change in memory usage while this operation was occurring. Memory usage is affected by factors beside the currently running operation; as a result,NetMemoryChangeis only an approximation of the memory impact of each operation.NetMemoryChange = TotalMemoryChange - FreeMemoryChange, where "total memory" is memory reserved by the JVM for heap, and "free memory" is how much has not been used yet. TheNetMemoryChangevalue will be negative when memory allocation is high, and its value will be positive when there is a large amount of GC. Sorting onNetMemoryChangeshould provide a useful overview of which operations are taking the most memory.
Real-Time Updates
For queries operating on ticking data (e.g., intraday data or Input Tables), additional logs detail the time consumed when updating tables with the new data.
QueryUpdatePerformance
This table describes what the query spent time on during its data refresh cycle. This data is written in predefined intervals; the default is one minute, but it can be configured per query. At the end of each performance monitoring interval, a query logs every operation whose results were updated, and how much time it spent performing that update throughout the interval.
The most significant columns are:
IntervalStartTime— The start time of the interval.IntervalEndTime— The end time of the interval.IntervalDurationNanos— The duration of the performance monitoring interval, in nanoseconds.Ratio— This is the percentage of the performance monitoring interval that was consumed updating each operation. This is an approximation of how much of the available CPU was used by a given operation.QueryMemoryUsed— The total amount of memory used by the worker.QueryMemUsedPct— Memory usage as a percentage of the max heap size (-Xmx).QueryMemoryFree— The total amount of free memory remaining. This is the difference ofWorkerHeapSizeandQueryMemoryUsed. If this approaches zero, a query is likely to experience poor performance or crash due to an OutOfMemoryError.WorkerHeapSize— The maximum heap size for the query worker.NRows— Total number of changed rows.RowsPerSec— The average rate data is ticking.RowsPerCPUSec— Approximation of how fast CPU handles row changes.
UpdateWorst
This table is the QueryUpdatePerformance table sorted to show the slowest-updating operations, out of all intervals since the query initialized, at the beginning of the table ( i.e., the operations with the greatest Ratio).
UpdateMostRecent
This table is the QueryUpdatePerformance table sorted to show the most recent updates first. Operations are still sorted with the greatest Ratio at the beginning of the table.
UpdateAggregate
This table shows the QueryUpdatePerformance table aggregated for each performance recording interval. The Ratio in this table represents the total CPU usage of each individual operation displayed in the other tables. If the Ratio in this table regularly approaches N (the amount of update threads - defaults to the amount of available processors), it indicates that the query may be unable to process all data updates within the target cycle time (the set target time for one UG cycle to complete). This can result in delayed data updates in the UI.
UpdateSummaryStats
This table takes the data in UpdateAggregate and aggregates it into a single row view of the 99th, 90th, 75th, and 50th percentiles of Ratio and QueryMemUsedPct over all intervals, which makes the spread of resource consumption easier to view.
QueryUpdateAncestors
This table contains information about the parents of instrumented table updates. Combined with the QueryUpdatePerformance table, it can be used to visualize ticking nodes in the Update Graph. Visualizing the ancestors of a table can help understand how it relates to other tables, which can help troubleshoot performance problems or other errors. Only ticking tables participate in update ancestor discovery. Therefore, static tables are not included in this performance table. Additionally, though most Deephaven operations provide instrumentation, some do not. Tables without performance instrumentation are not included in QueryUpdatePerformance or QueryUpdateAncestors; therefore, they are omitted from any ancestor visualizations.
When writing custom listeners, you should derive from InstrumentedListenerBase - preferably from a InstrumentedTableUpdateListener to take advantage of shift-aware updates. When creating a custom source in the engine, derive your custom class from InstrumentedUpdateSource.
In Groovy, the UpdateAncestorViz class provides an svg method that produces SVG image data and a dot method that produces DOT to use as input to the Graphviz tool.
To visualize the graph, you may prefer to use a Python worker where deephaven.ui provides the necessary infrastructure for viewing the graph visualization directly in your console.
To select which nodes to visualize, examine the QueryUpdatePerformance or QueryUpdateAncestors table and pass in the values of EntryId that are of interest. In this case, we visualize entry 50 and store it in the String dot.
In Python, the simplest way to view information about an update graph is to use the ancestor_image function, which uses deephaven.ui to directly display the graph visualization within your Code Studio.
To select which nodes to visualize, examine the QueryUpdatePerformance or QueryUpdateAncestors table and pass in the values of EntryId that are of interest. In this case, we visualize entry 50 and create an image component named graph.
Instead of directly displaying the image, you can save it as an SVG file using ancestor_svg; or get the DOT string for use with the Graphviz tool directly.
If you write a dot string to a file (using standard Python or Groovy methods), then Graphviz's dot tool is used to generate an image; for example:
This produces the following output:

Other Tables
ProcessEventLog
This table is the Process Event Log for the specified worker.
ServerState
This table aims to show details about memory usage, Garbage Collection (GC) and Update Graph (UG) cycle count, durations, and ratios.
Garbage collection is a memory management process that automatically collects unused objects created on the heap and deletes them to free up memory.
The UG is the part of the query engine that handles real-time data updates. It runs in cycles (once per second, by default). When UG cycle logging is enabled, the UG will write the cycle's length to the logs (e.g. Update Graph Processor cycleTime: 472ms) every time it completes a cycle.
Plots
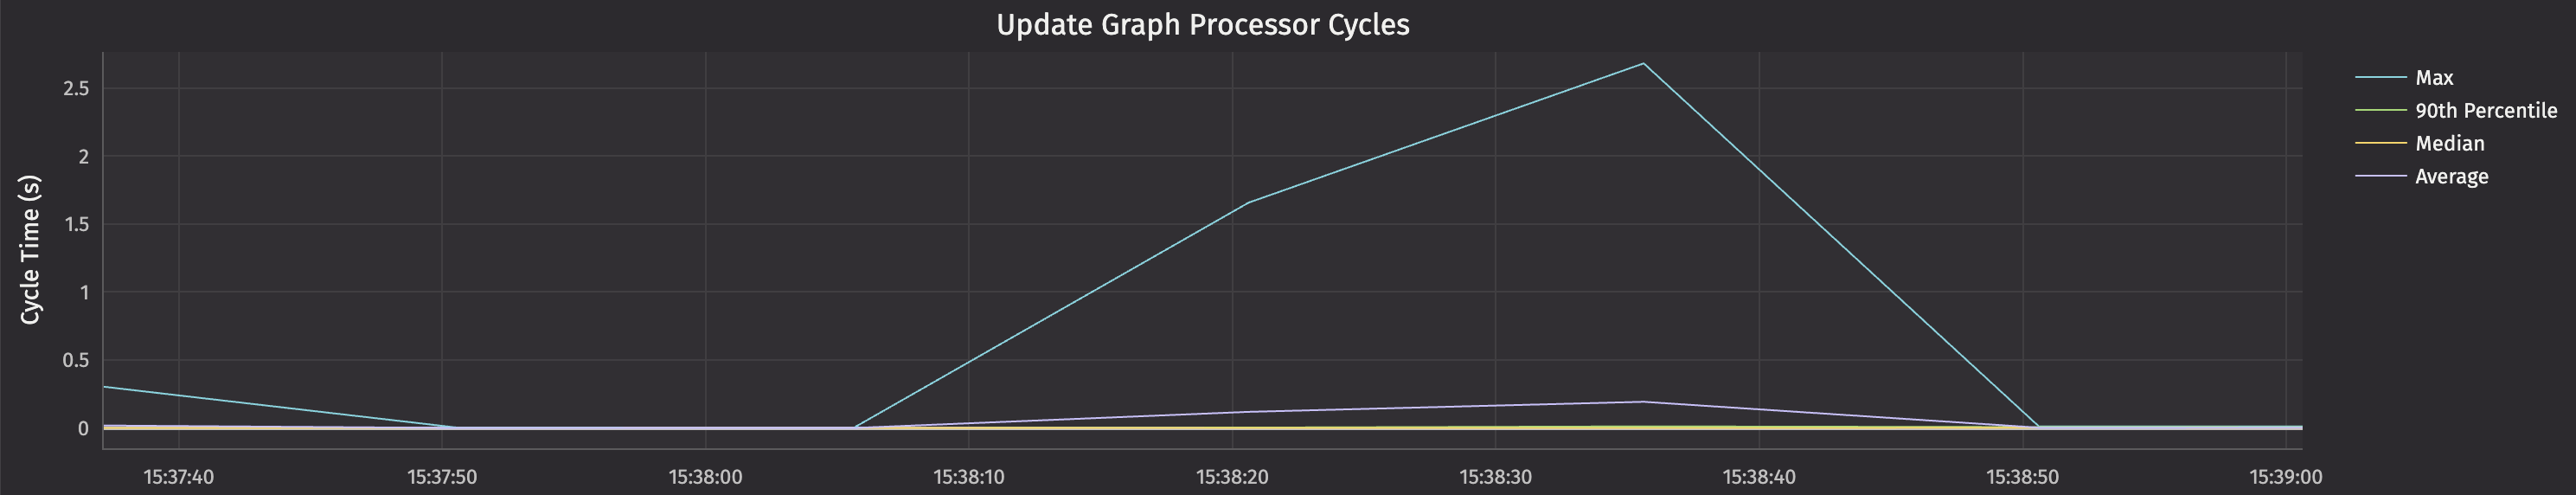
UGPCycleTimeline
The UGPCycleTimeline widget plots UG cycle times from the ServerState table:
ServerStateTimeLine
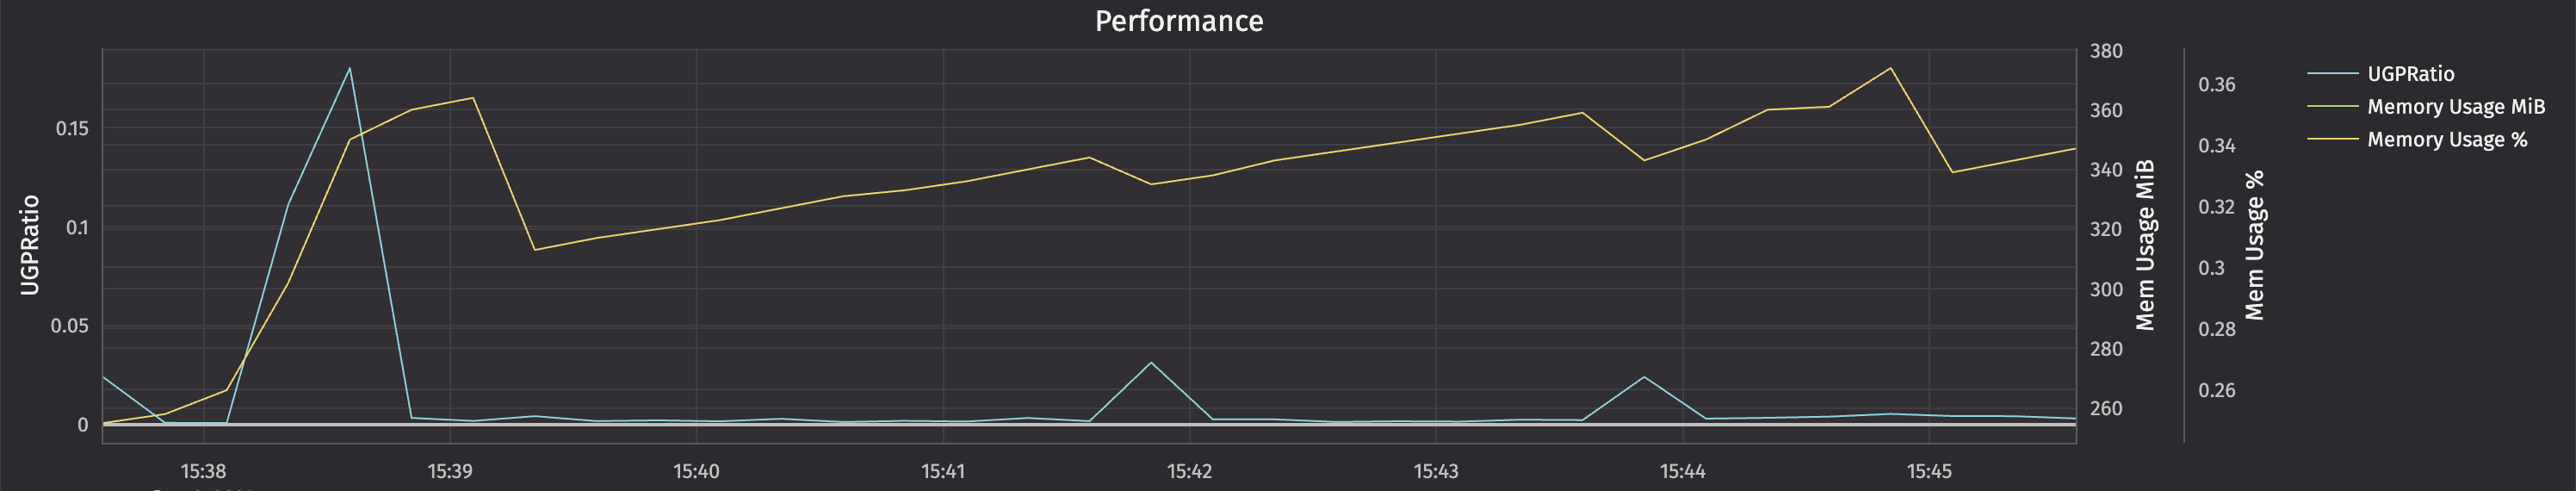
The ServerStateTimeLine widget plots UG ratio and memory usage from the ServerState table.
Performance queries
Deephaven also supports a tree table view of query performance:
Dashboards
This section provides two different examples that construct dashboards containing one or more internal tables, plots, and other widgets that can be used to monitor query performance.
Monitor PQ memory and initialization times
This example creates a dashboard that includes graphs of initialization times as well as heap usage over the last seven days of a specific PQ, then graphs the heap usage throughout the day of a single run.
Code
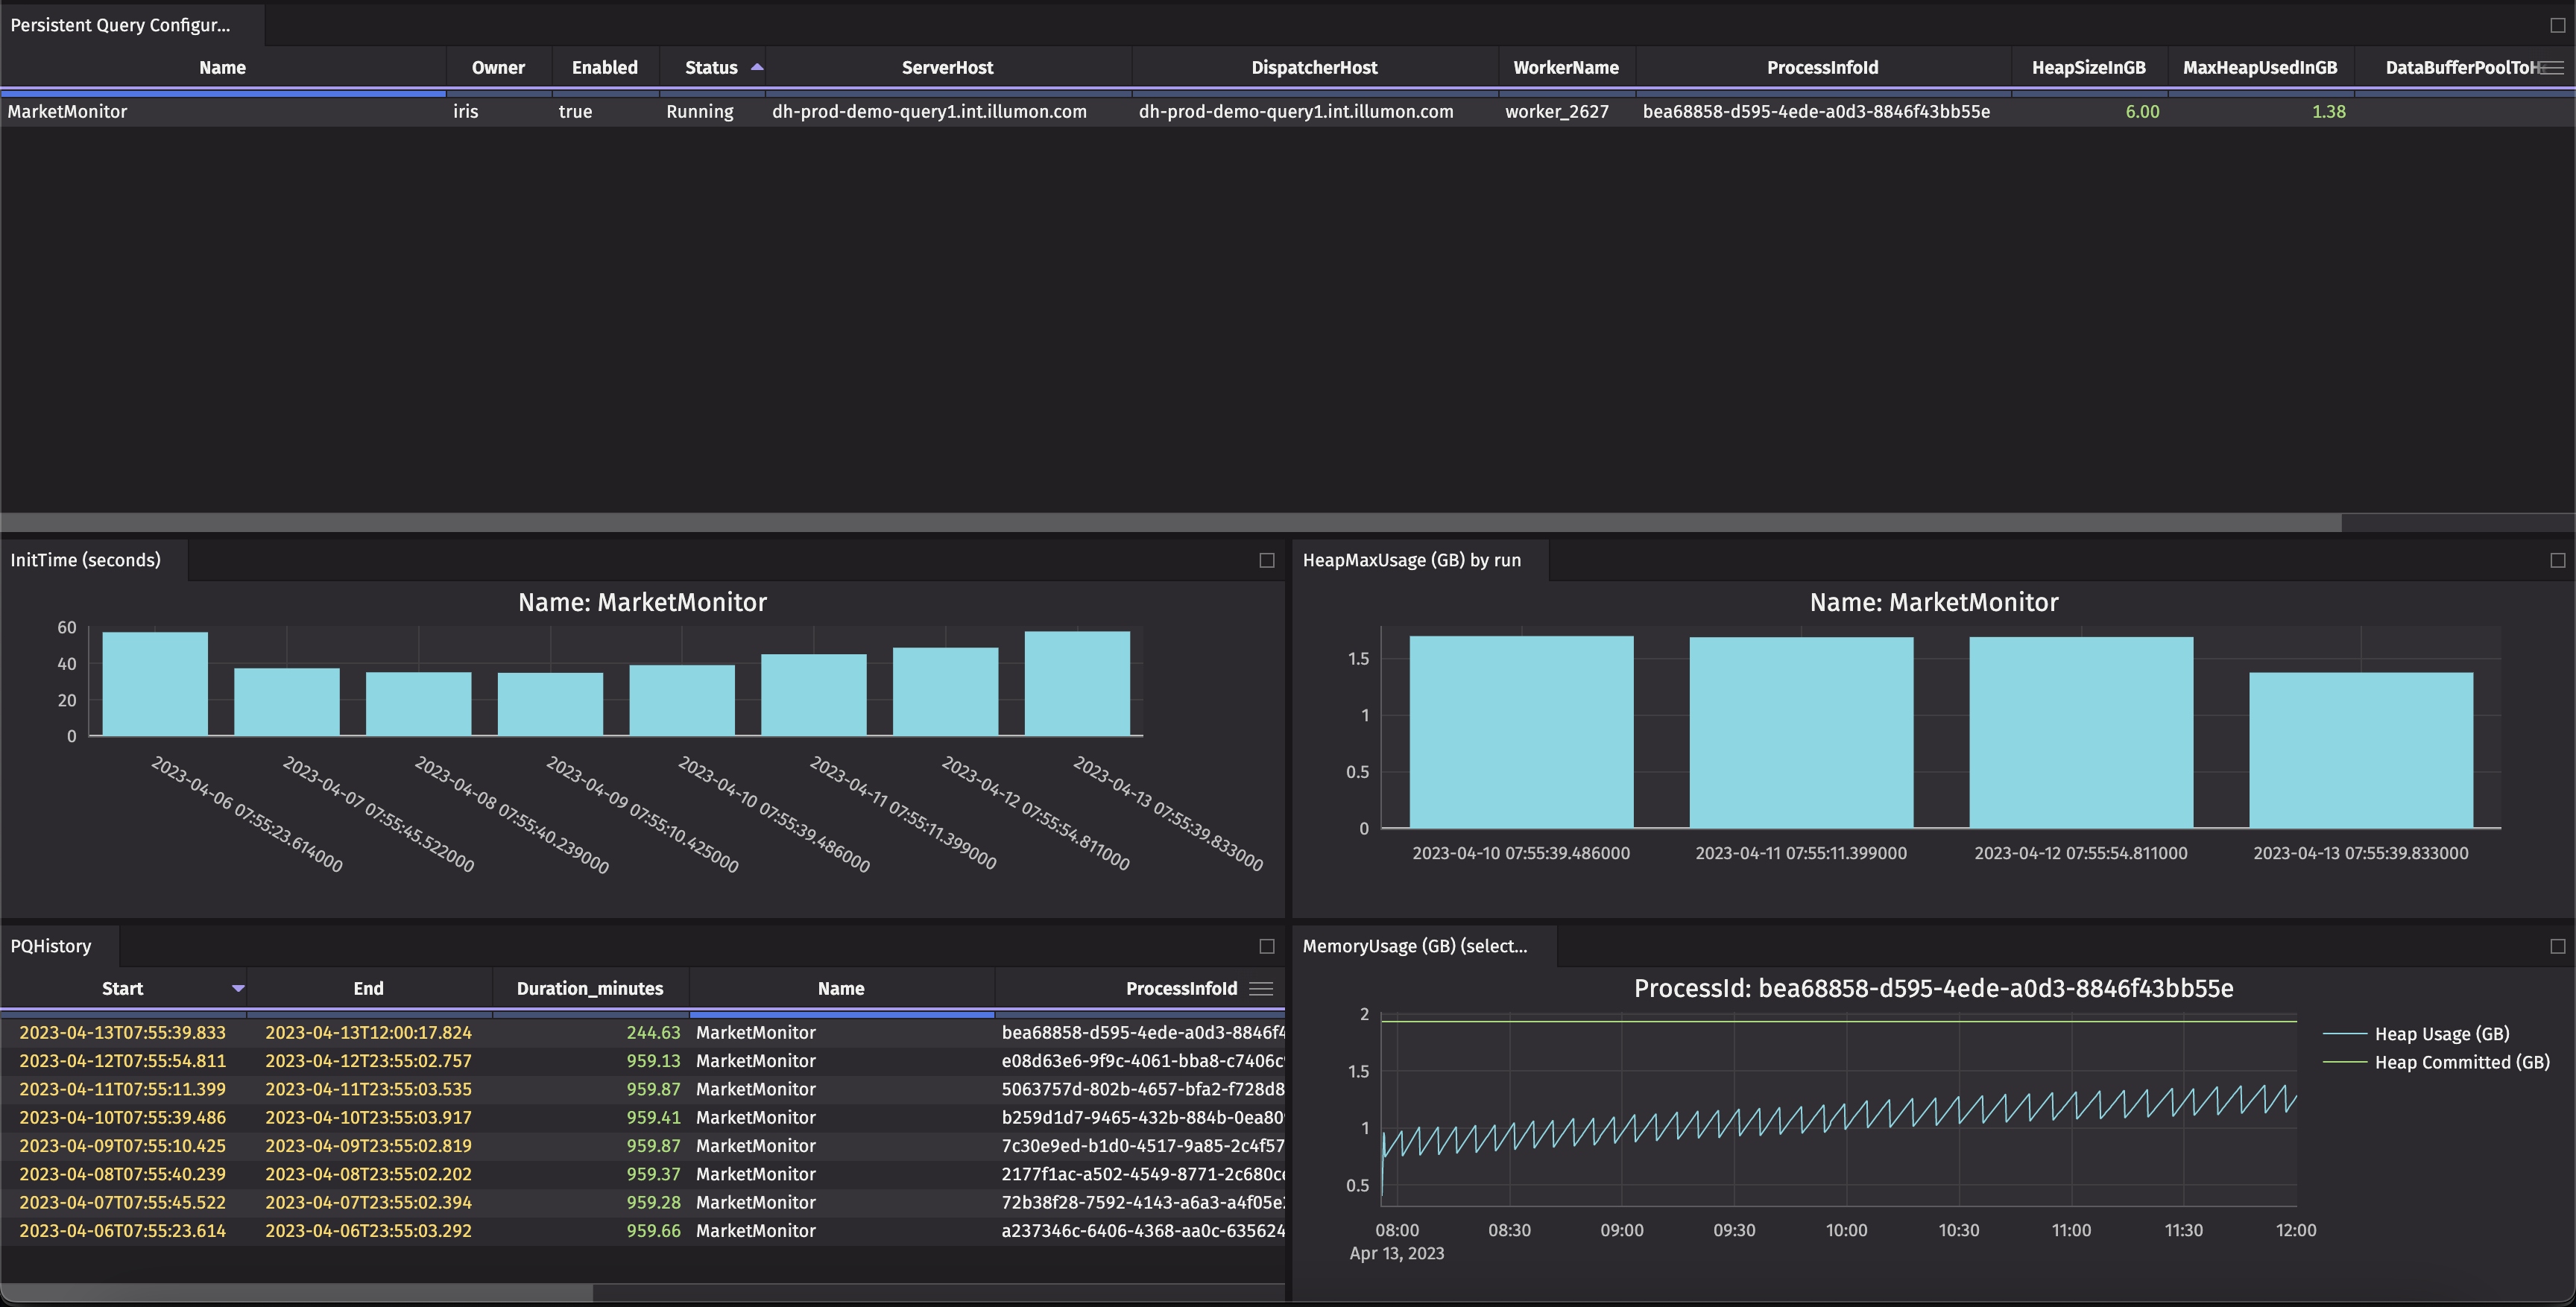
The PQHistory and Persistent Query Configurations tables include helpful information such as query status and the amount of memory configured vs the amount of memory currently used. To filter the graphs to a specific query, use a One Click filter or the Linker tool.
Monitor server usage
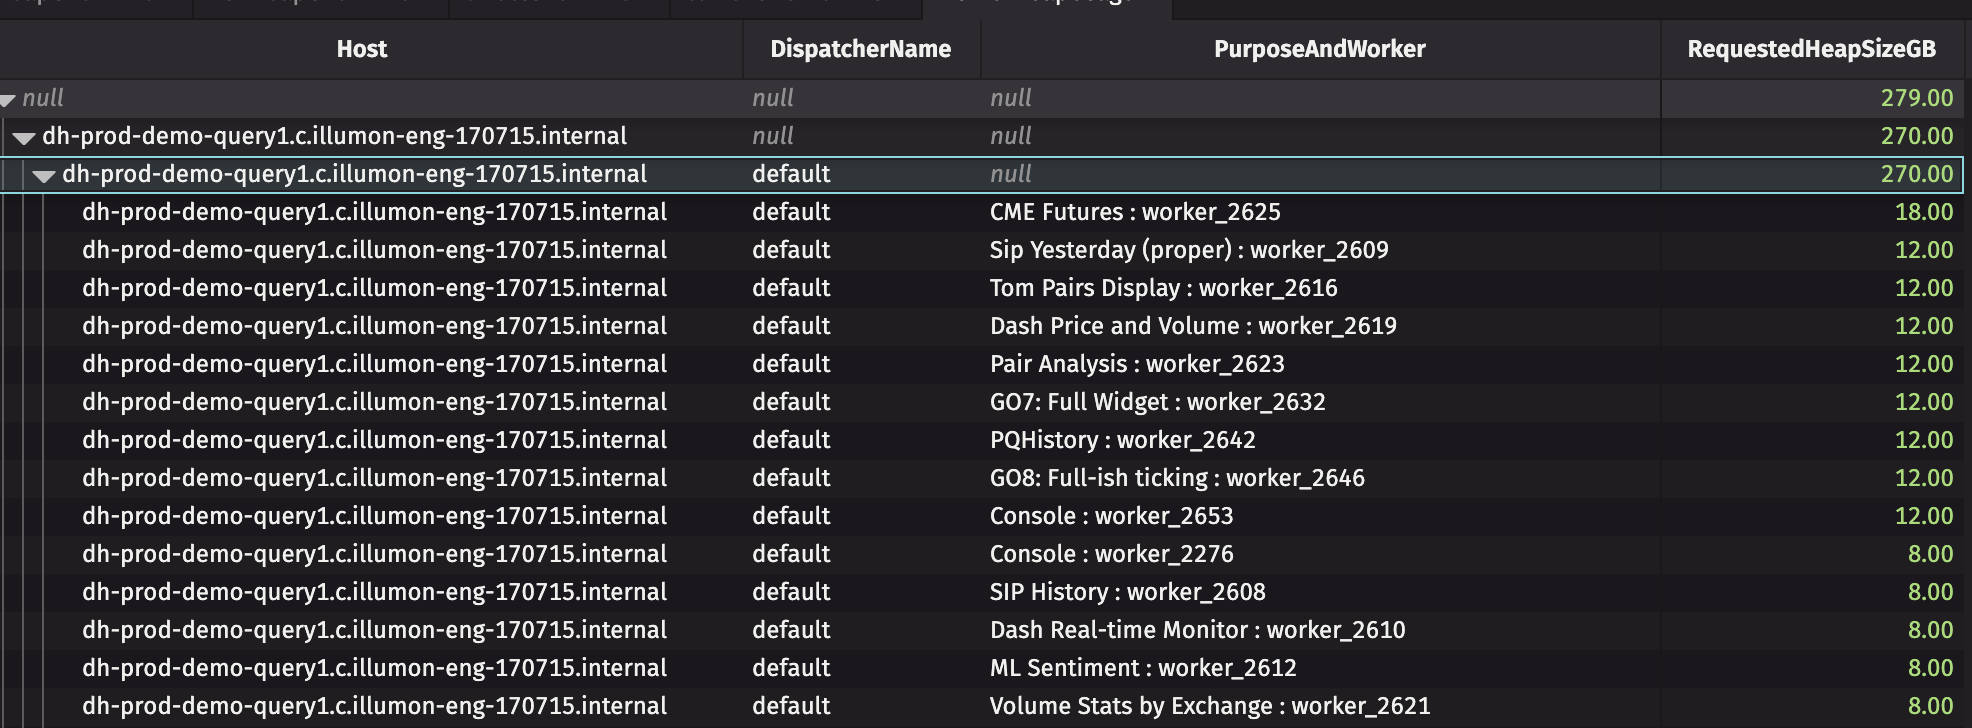
This example creates a dashboard that includes the heap usage of all PQs and breaks it down by server. This is particularly prudent for load balancing in a Deephaven cluster. It also shows all current workers and their server hosts, heap allocation, and PQ name (if applicable).
Code