Why is my query slow or unresponsive?
Query performance can be negatively affected by a number of things. This FAQ page covers common culprits as well as diagnosis. It is not an exhaustive list of reasons why a query might be slow.
Common culprits
Order of operations
Choosing the correct order of operations is critical for efficient queries. Be sure to filter data before analysis to limit it to only the data you need, thus reduce the number of calculations required. In general, you should:
- Filter on partitioning columns
- Filter on grouping columns
- Filter on other columns
- Perform calculations
Inefficient memory use
Queries may use more memory than they need to. Common reasons for inefficient memory use include:
- Not choosing the right column selection method.
- Poor choice of column data types, particularly in Python queries.
- PyObjects in Python queries.
Python and Java
In order to write efficient queries that leverage Python, you should understand The Python-Java boundary and how it affects query efficiency.
Other common culprits
Diagnose performance issues
For details on query performance, check the QueryOperationPerformanceLogCoreV2 table in DbInternal:
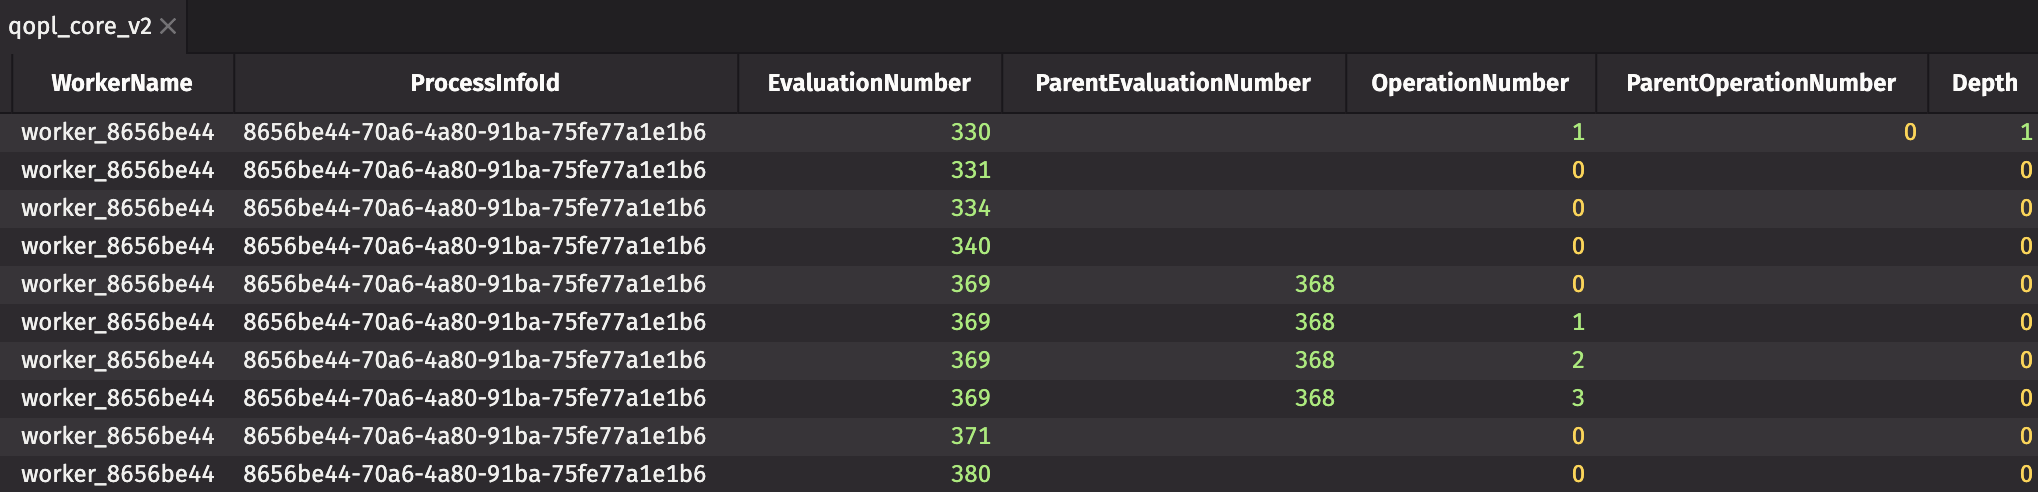
Each query is broken up into its component parts for a better understanding of how each individual operation performs.
When queries are slower than expected, or if the UI responds sluggishly, check the UpdatePerformanceLogCoreV2 table in DbInternal for information about incremental update operations in the Periodic Update Graph.
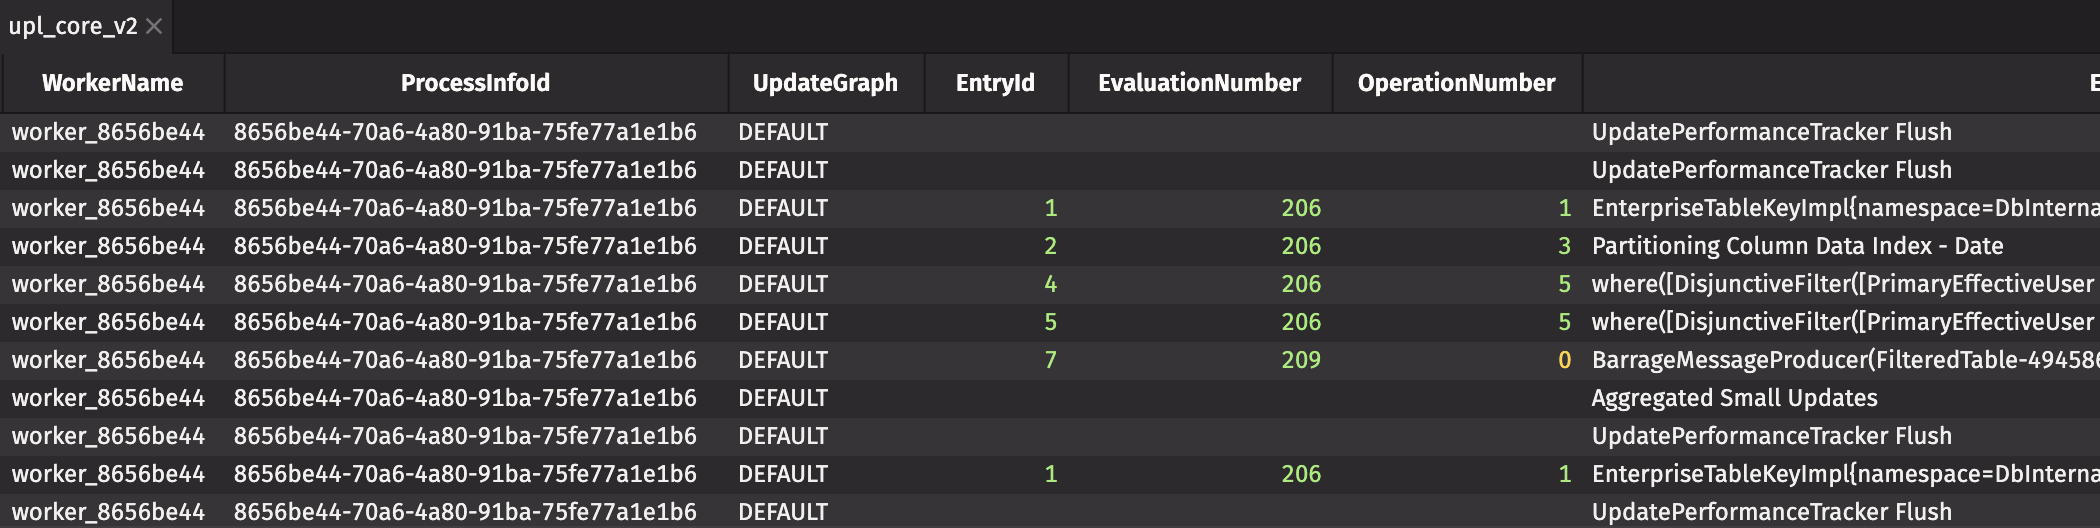
Both of these tables include a Description or EntryDescription column with human-readable information. The majority of the entries in this column indicate each operation performed on a table (e.g., join, sort, where), and looking across the row to columns such as UsageNanos or WasInterrupted may determine which specific operations are slow and offer hints as to how to resolve the issue.
Determine how your data is grouped
Using an entire table instead of the relevant partition of the table can slow down a query significantly. If you need to make sure your data is grouped the way you expect, you can access the XML file containing the table's schema via the command line.
The following steps will show you how to access the schema of a table.
First, a table with over a million rows to use as an example:
To break the above query down into component clauses:
db.historical_table("FeedOS", "OPRAQuoteL1")retrieves the root table. This table is basically stored as a tree, and partitioned on the Date column..where("Date.contains(2019)")filters the table to only include partitions where theDatecolumn contains "2019"..where("LocalCodeStr =SPY")filters the table to only include rows where theLocalCodeStrcolumn is "SPY".
If you were to execute the above query without the where filters, Deephaven would have to process every partition of the table. With use cases like option quotes, this can be a multi-terabyte table, which will take significant time to process.
Access schema files
Schema files, which define the schema of database tables, are found in etcd. You can check schema files to see how data is grouped and partitioned. The following command writes the DbInternal schema files from etcd to /tmp/schema on the filesystem:
You can then check the schema files using normal filesystem commands. Below is the schema file for the ProcessEventLog table:
DbInternal.ProcessEventLog.schema
Note that Date is the partitioning column, and Host is a grouping column.
When the intraday data is converted to historical data, it is reordered (in other words, "grouped") so that it is quicker to index into the grouped columns. When filters such as where are slow, consider the type of column you are filtering on. Filters should be applied to partitioning columns and grouping columns before normal columns.
As discussed elsewhere in the documentation, many factors affect a query's performance: how data is grouped, how it's organized on disk, and the way the query is written (i.e., the partitioning column should always be first in a query). For more troubleshooting strategies, see our Monitor query performance guide.