Barrage metrics for performance monitoring
Barrage is the name of Deephaven's IPC table transport. This guide explains what statistics are recorded and how to access them.
Access Barrage metrics tables
You can access these tables as follows:
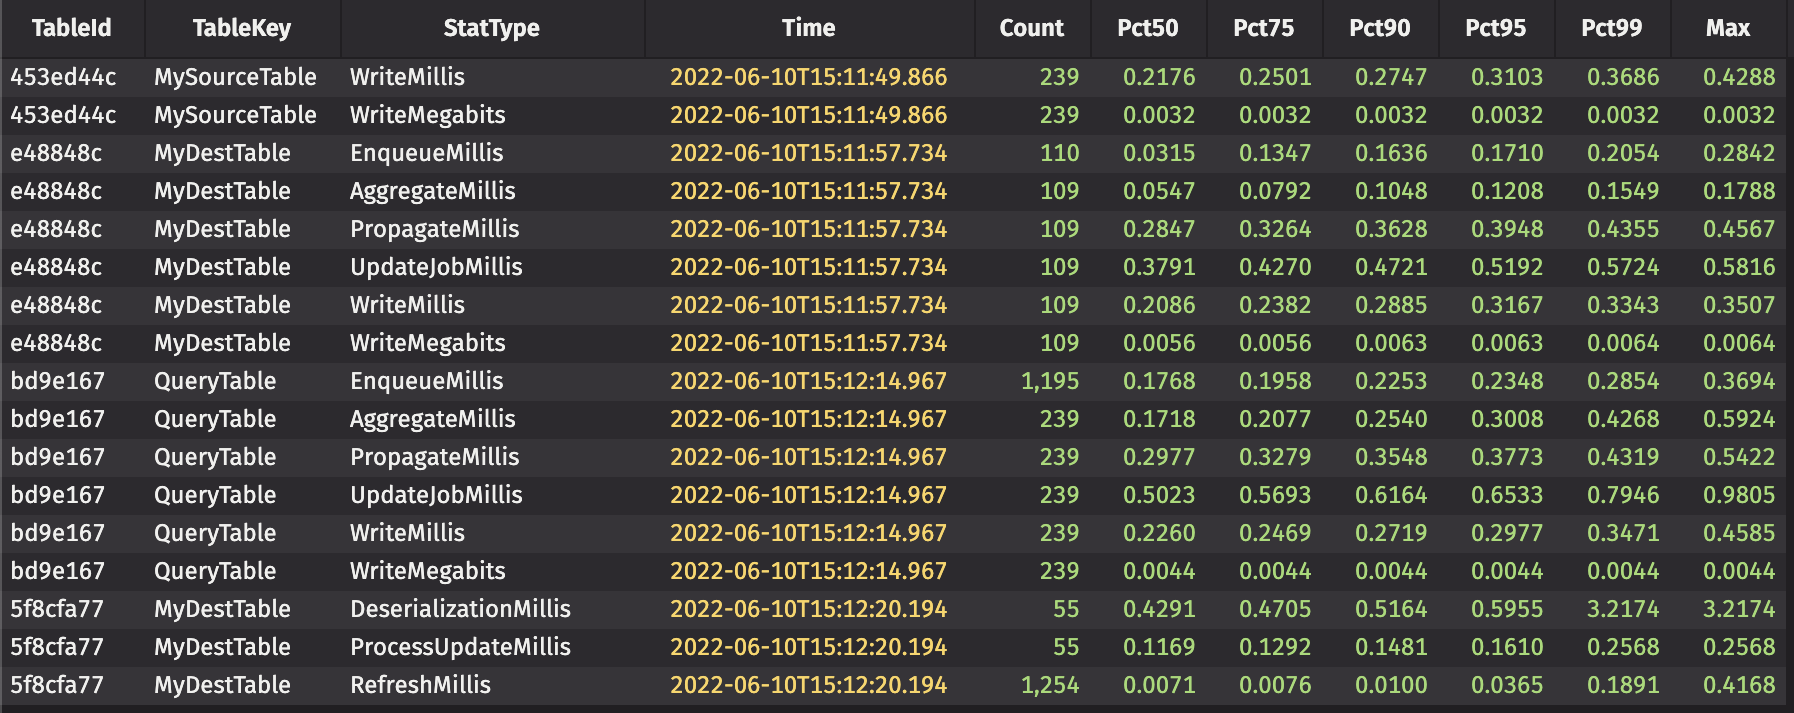
This is what the subscriptions table looks like when there are live subscriptions:
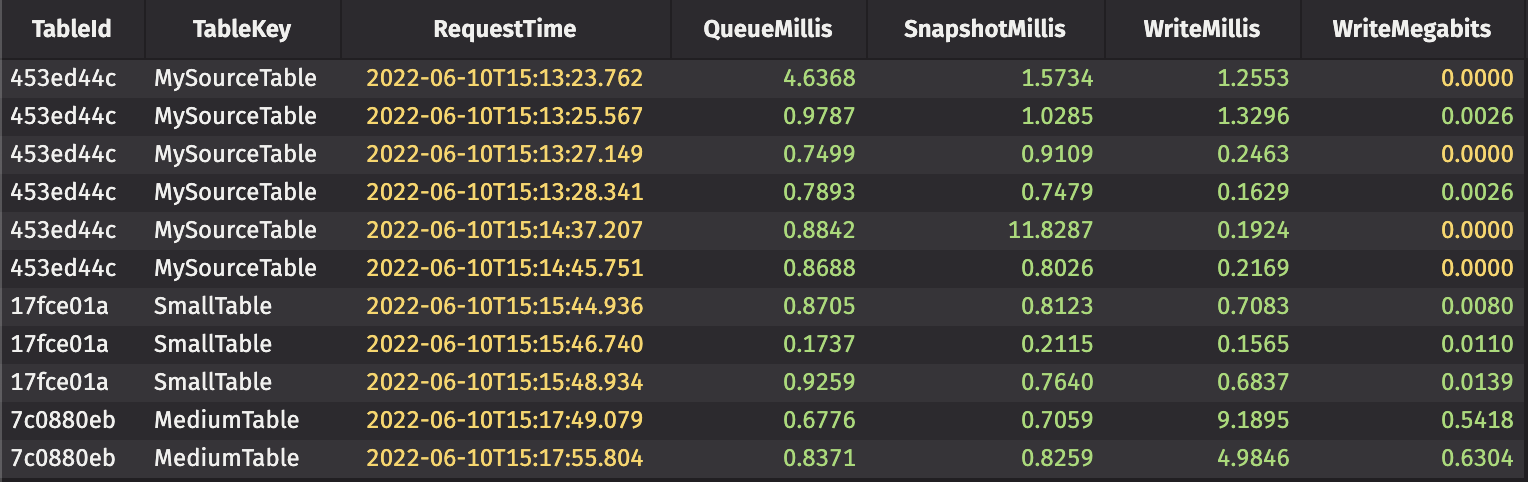
This is what the snapshots table looks like after processing a few requests:
Barrage subscription metrics summary
Subscription statistics are presented in percentiles bucketed over a time period. Here are the various metrics that are recorded by the Deephaven server:
| Stat Type | Sender / Receiver | Description |
|---|---|---|
| EnqueueMillis | Sender | The time it took to record changes that occurred during a single update graph cycle |
| AggregateMillis | Sender | The time it took to aggregate multiple updates within the same interval |
| PropagateMillis | Sender | The time it took to deliver an aggregated message to all subscribers |
| SnapshotMillis | Sender | The time it took to snapshot data for a new or changed subscription |
| UpdateJobMillis | Sender | The time it took to run one full cycle of the off-thread propagation logic |
| WriteMillis | Sender | The time it took to write the update to a single subscriber |
| WriteMegabits | Sender | The payload size of the update in megabits |
| DeserializationMillis | Receiver | The time it took to read and deserialize the update from the wire |
| ProcessUpdateMillis | Receiver | The time it took to apply a single update during the update graph cycle |
| RefreshMillis | Receiver | The time it took to apply all queued updates during a single update graph cycle |
Barrage snapshot metrics summary
Snapshot statistics are presented once per request.
| Stat Type | Description |
|---|---|
| QueueMillis | The time it took waiting for a thread to process the request |
| SnapshotMillis | The time it took to construct a consistent snapshot of the source table |
| WriteMillis | The time it took to write the snapshot |
| WriteMegabits | The payload size of the snapshot in megabits |
Identify a table
Tables are identified by their TableId and TableKey. The TableId is determined by the source table's System.identityHashCode(). The TableKey defaults to Table.getDescription() but can be overridden by setting the table attribute via withAttributes.
Note
The web client applies transformations to every table to which it subscribes. If a table is also subscribed to by a non-web client, then statistics for the original table and the transformed table will both appear in the metrics table. Their TableId will differ. Most transformations clear the TableKey attribute, such as when a column is sorted or filtered, both programmatically and through the GUI.
Extra configuration
Here are server-side flags that change the behavior of Barrage metrics.
-DBarragePerformanceLog.enableAll: record metrics for tables that do not have an explicitTableKey(default:true).-DBarragePerformanceLog.cycleDurationMillis: the interval to flush aggregated statistics (default:60000- once per minute).