Create a hierarchical rollup table programmatically
This guide will show you how to create a hierarchical rollup table programmatically. A rollup table combines Deephaven's powerful aggregations with an easy-to-navigate hierarchical structure.
A rollup table aggregates values using increasing levels of grouping to produce a hierarchical table that shows the value for each aggregation at each level. For example, the following rollup table contains data that is grouped by region, and then by age:
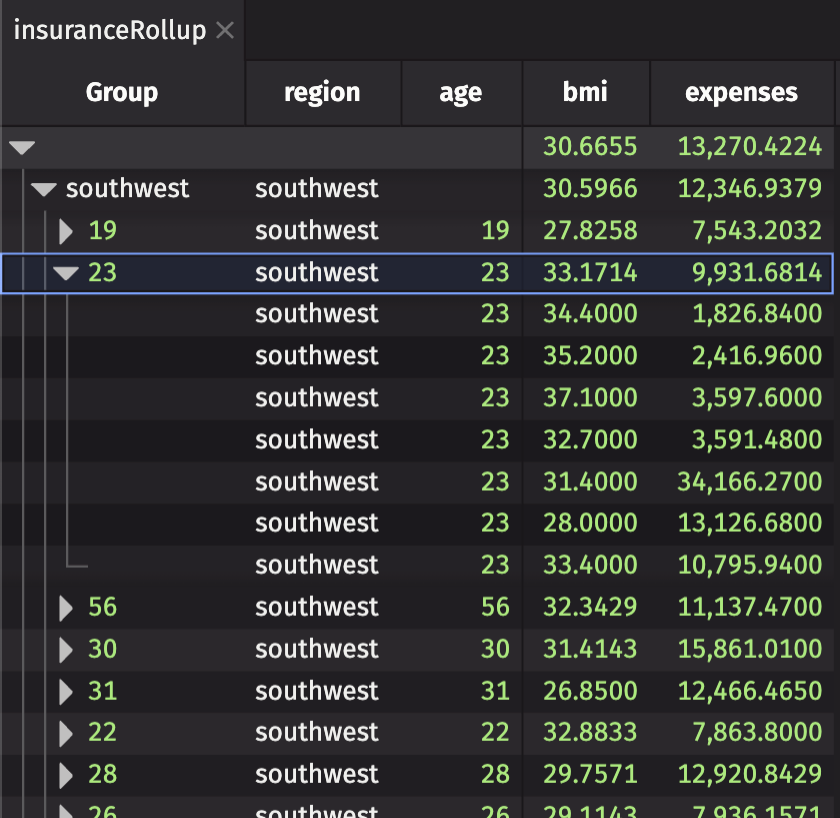
The Group column contains the rollup table's hierarchy and has UI controls for expanding and collapsing individual groups.
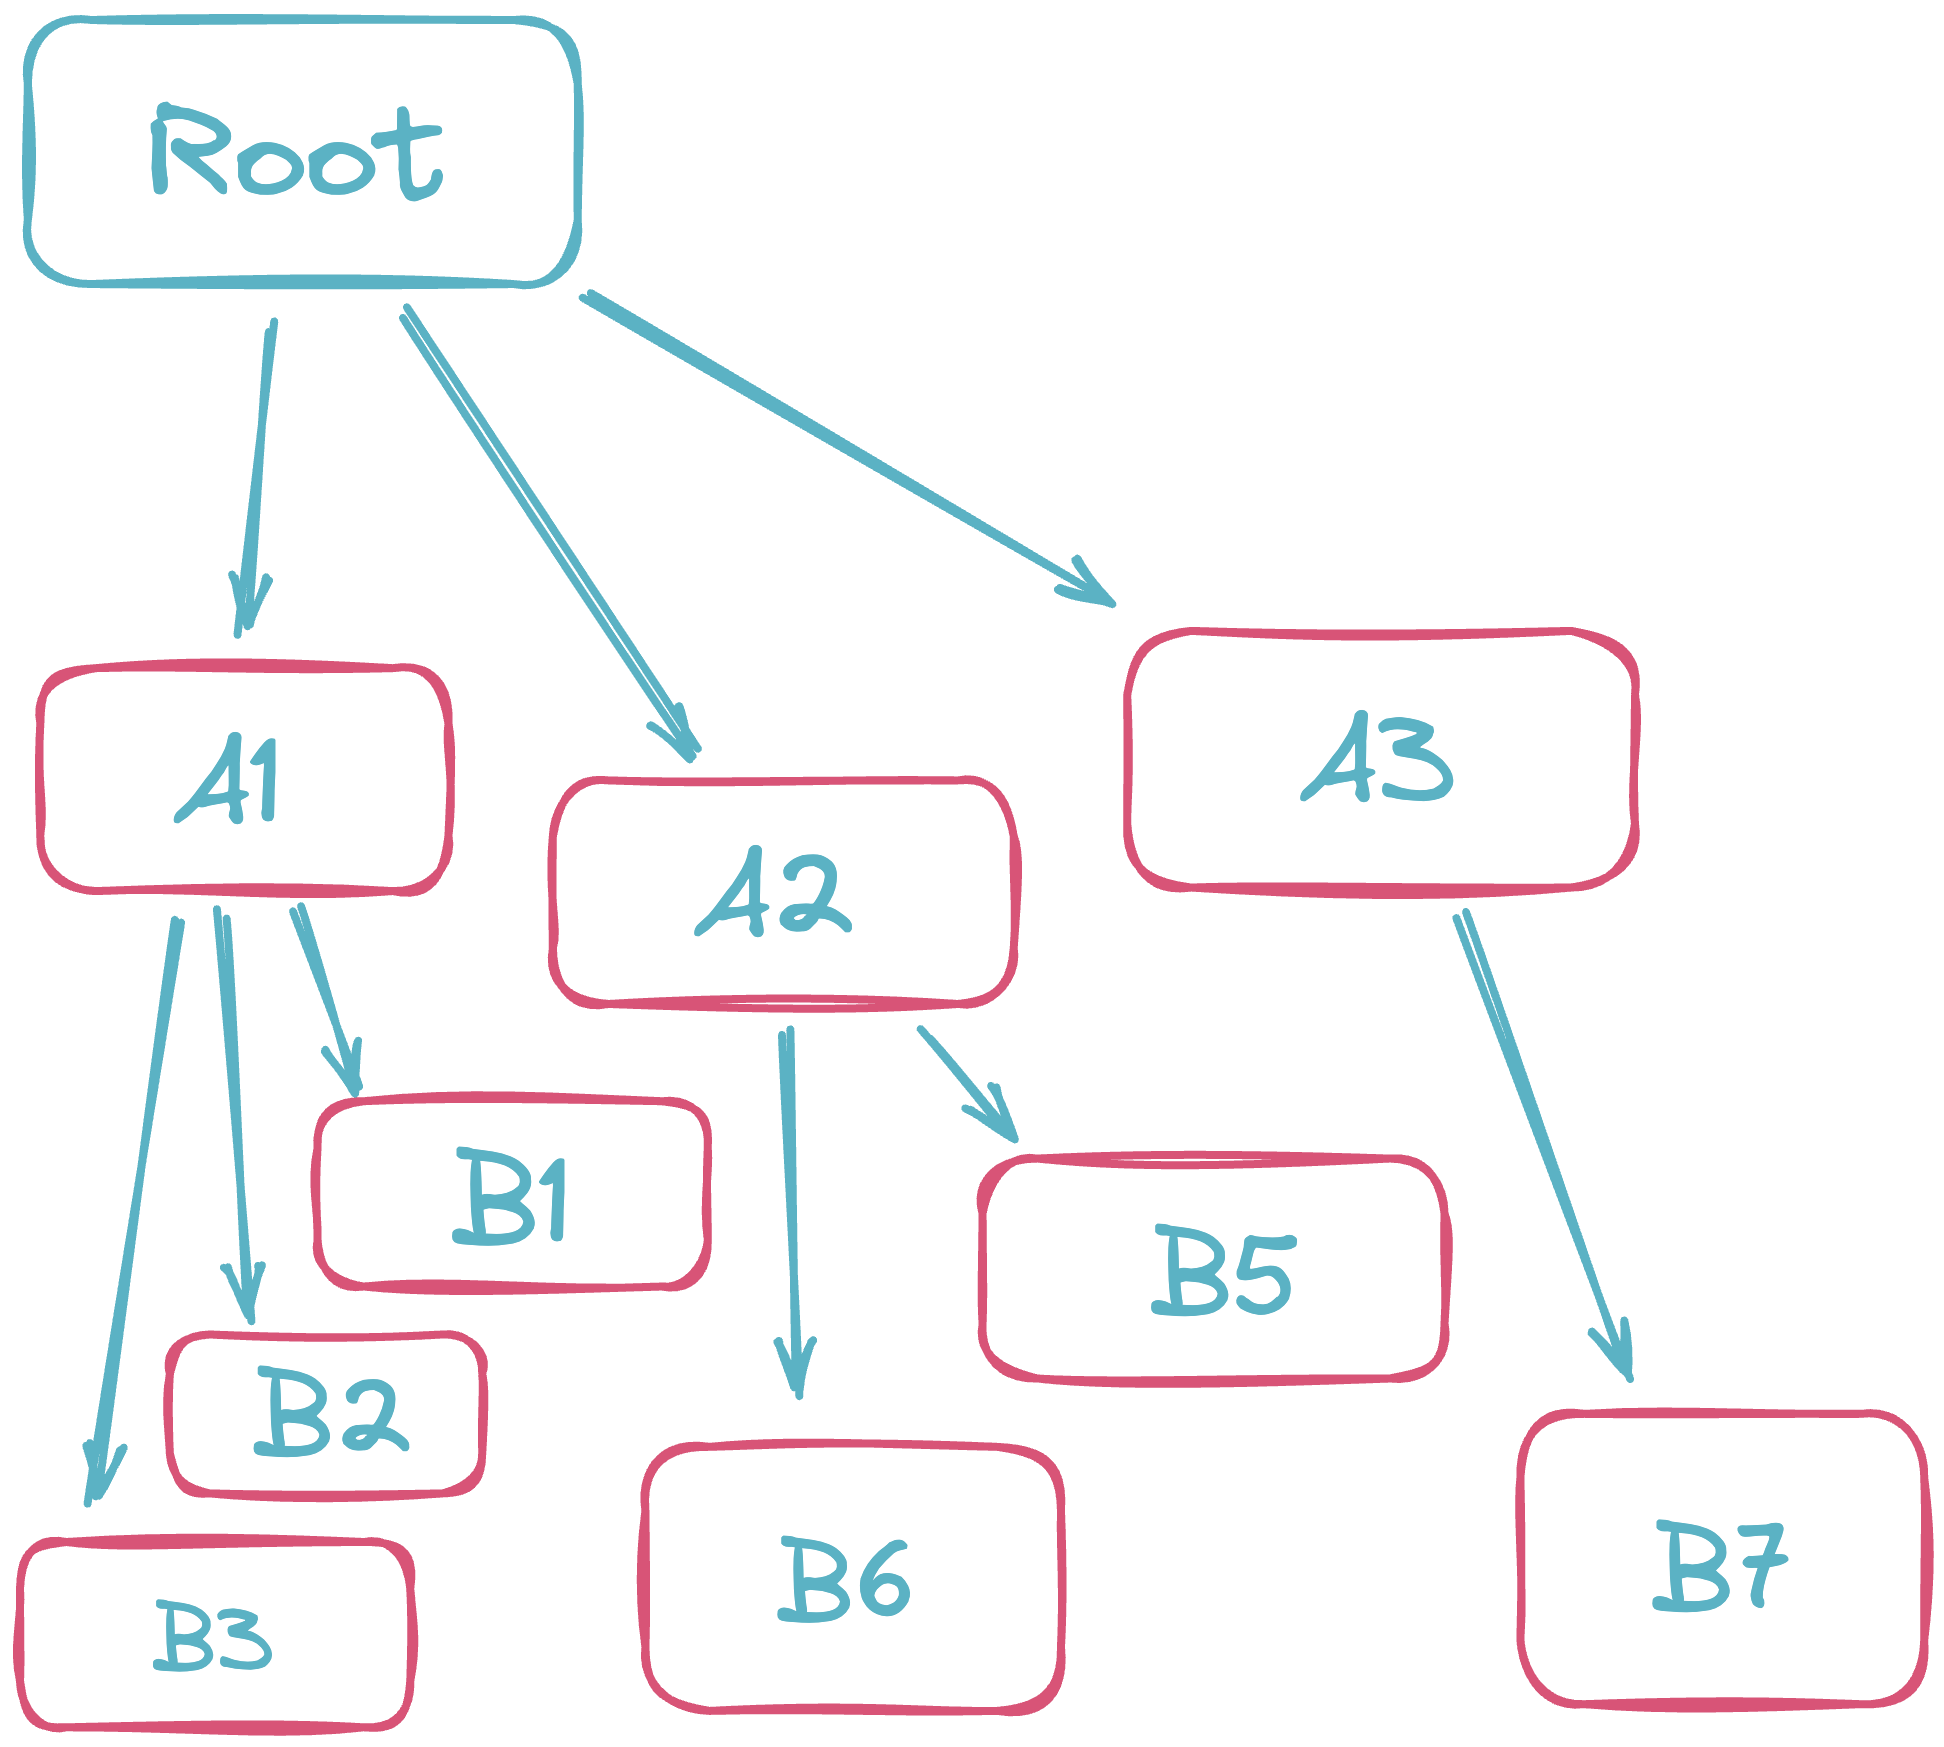
Groupings are clearly represented and easy to navigate in a rollup table. The topmost row, which contains all of the groups, is known as the root node. Members of groups are known as constituents, and the lowest-level nodes are leaf nodes.
Note
A column that is no longer part of the aggregation key is replaced with a null value on each level.
rollup
Rollup tables are created with the rollup method.
The basic syntax is as follows:
In the result table, only the first and second levels are initially expanded. Levels can be expanded by clicking on the right-facing arrow in a corresponding by column.
The rollup method takes up to three arguments. The first one is required, while the other two are optional.
aggregations: One or more aggregations.
The following aggregations are supported:
In the case of a rollup table with a single aggregation, that aggregation can be on its own or in a single-element list. When more than one aggregation is used, the aggregations must be in a list. The aggregation(s) can be defined outside of the rollup call just like with combined aggregations.
-
includeConstituents: A boolean to indicate whether or not the table will include an additional level at each leaf that displays the rows from the original table that were aggregated. The default value isfalse, so that no rows from the original table will be included in the result. -
groupByColumns: The set of columns that define the hierarchy of the table. These columns are what you will be able to expand and collapse with the arrows in the UI. The hierarchy is determined in a left-to-right order, so if the columns are specified"ColumnOne", "ColumnTwo",ColumnOnecan be expanded to show all values ofColumnTwothat belong to each unique value inColumnOne.
Examples
Static data
In our examples repository, we have an insurance dataset that can show a simple real-world use case of aggregations and hierarchy.
In this example, two rollup tables are created. The first performs zero aggregations, but creates a hierarchy from the region and age columns. The second calculates an aggregated average of the bmi and expenses columns. Each rollup table specifies include_constituents=True as the second argument to include the rows from the original table that made up each aggregation.
Real-time data
The following example creates ticking source data that simulates groups, subgroups, and values. An aggregated average and standard deviation of all the values is performed for each group and subgroup. The table is rolled up by the Group and Subgroup columns, respectively.
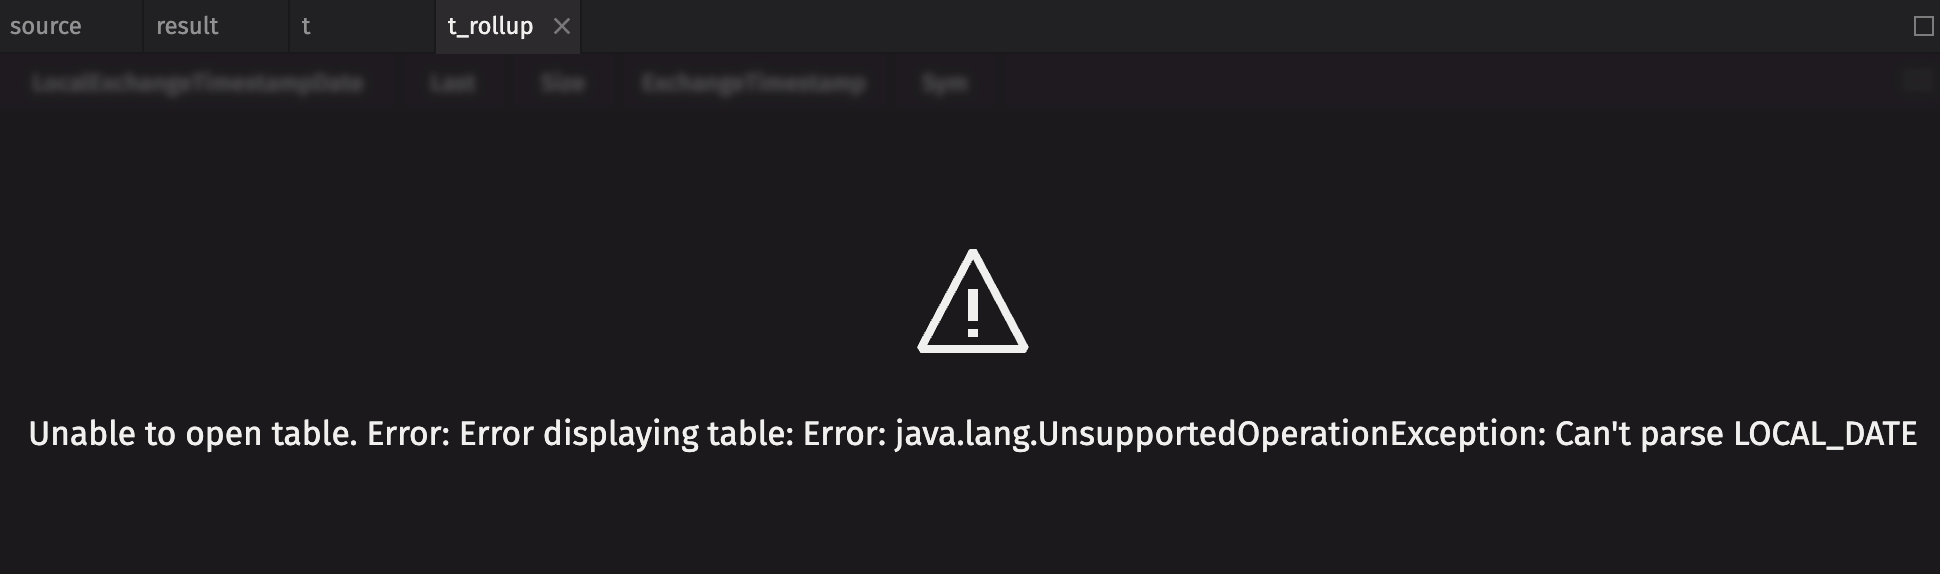
Note that rollup tables can only be created from String or primitive columns. Attempting to use a non-primitive type such as LocalDate or a Timestamp as a rollup column results in an error: