Navigate the GUI
The Deephaven user interface (GUI) offers a comprehensive suite of advanced tools to manipulate and transform data and tables with ease. This guide shows users where to find the primary context menus and tools in the platform.

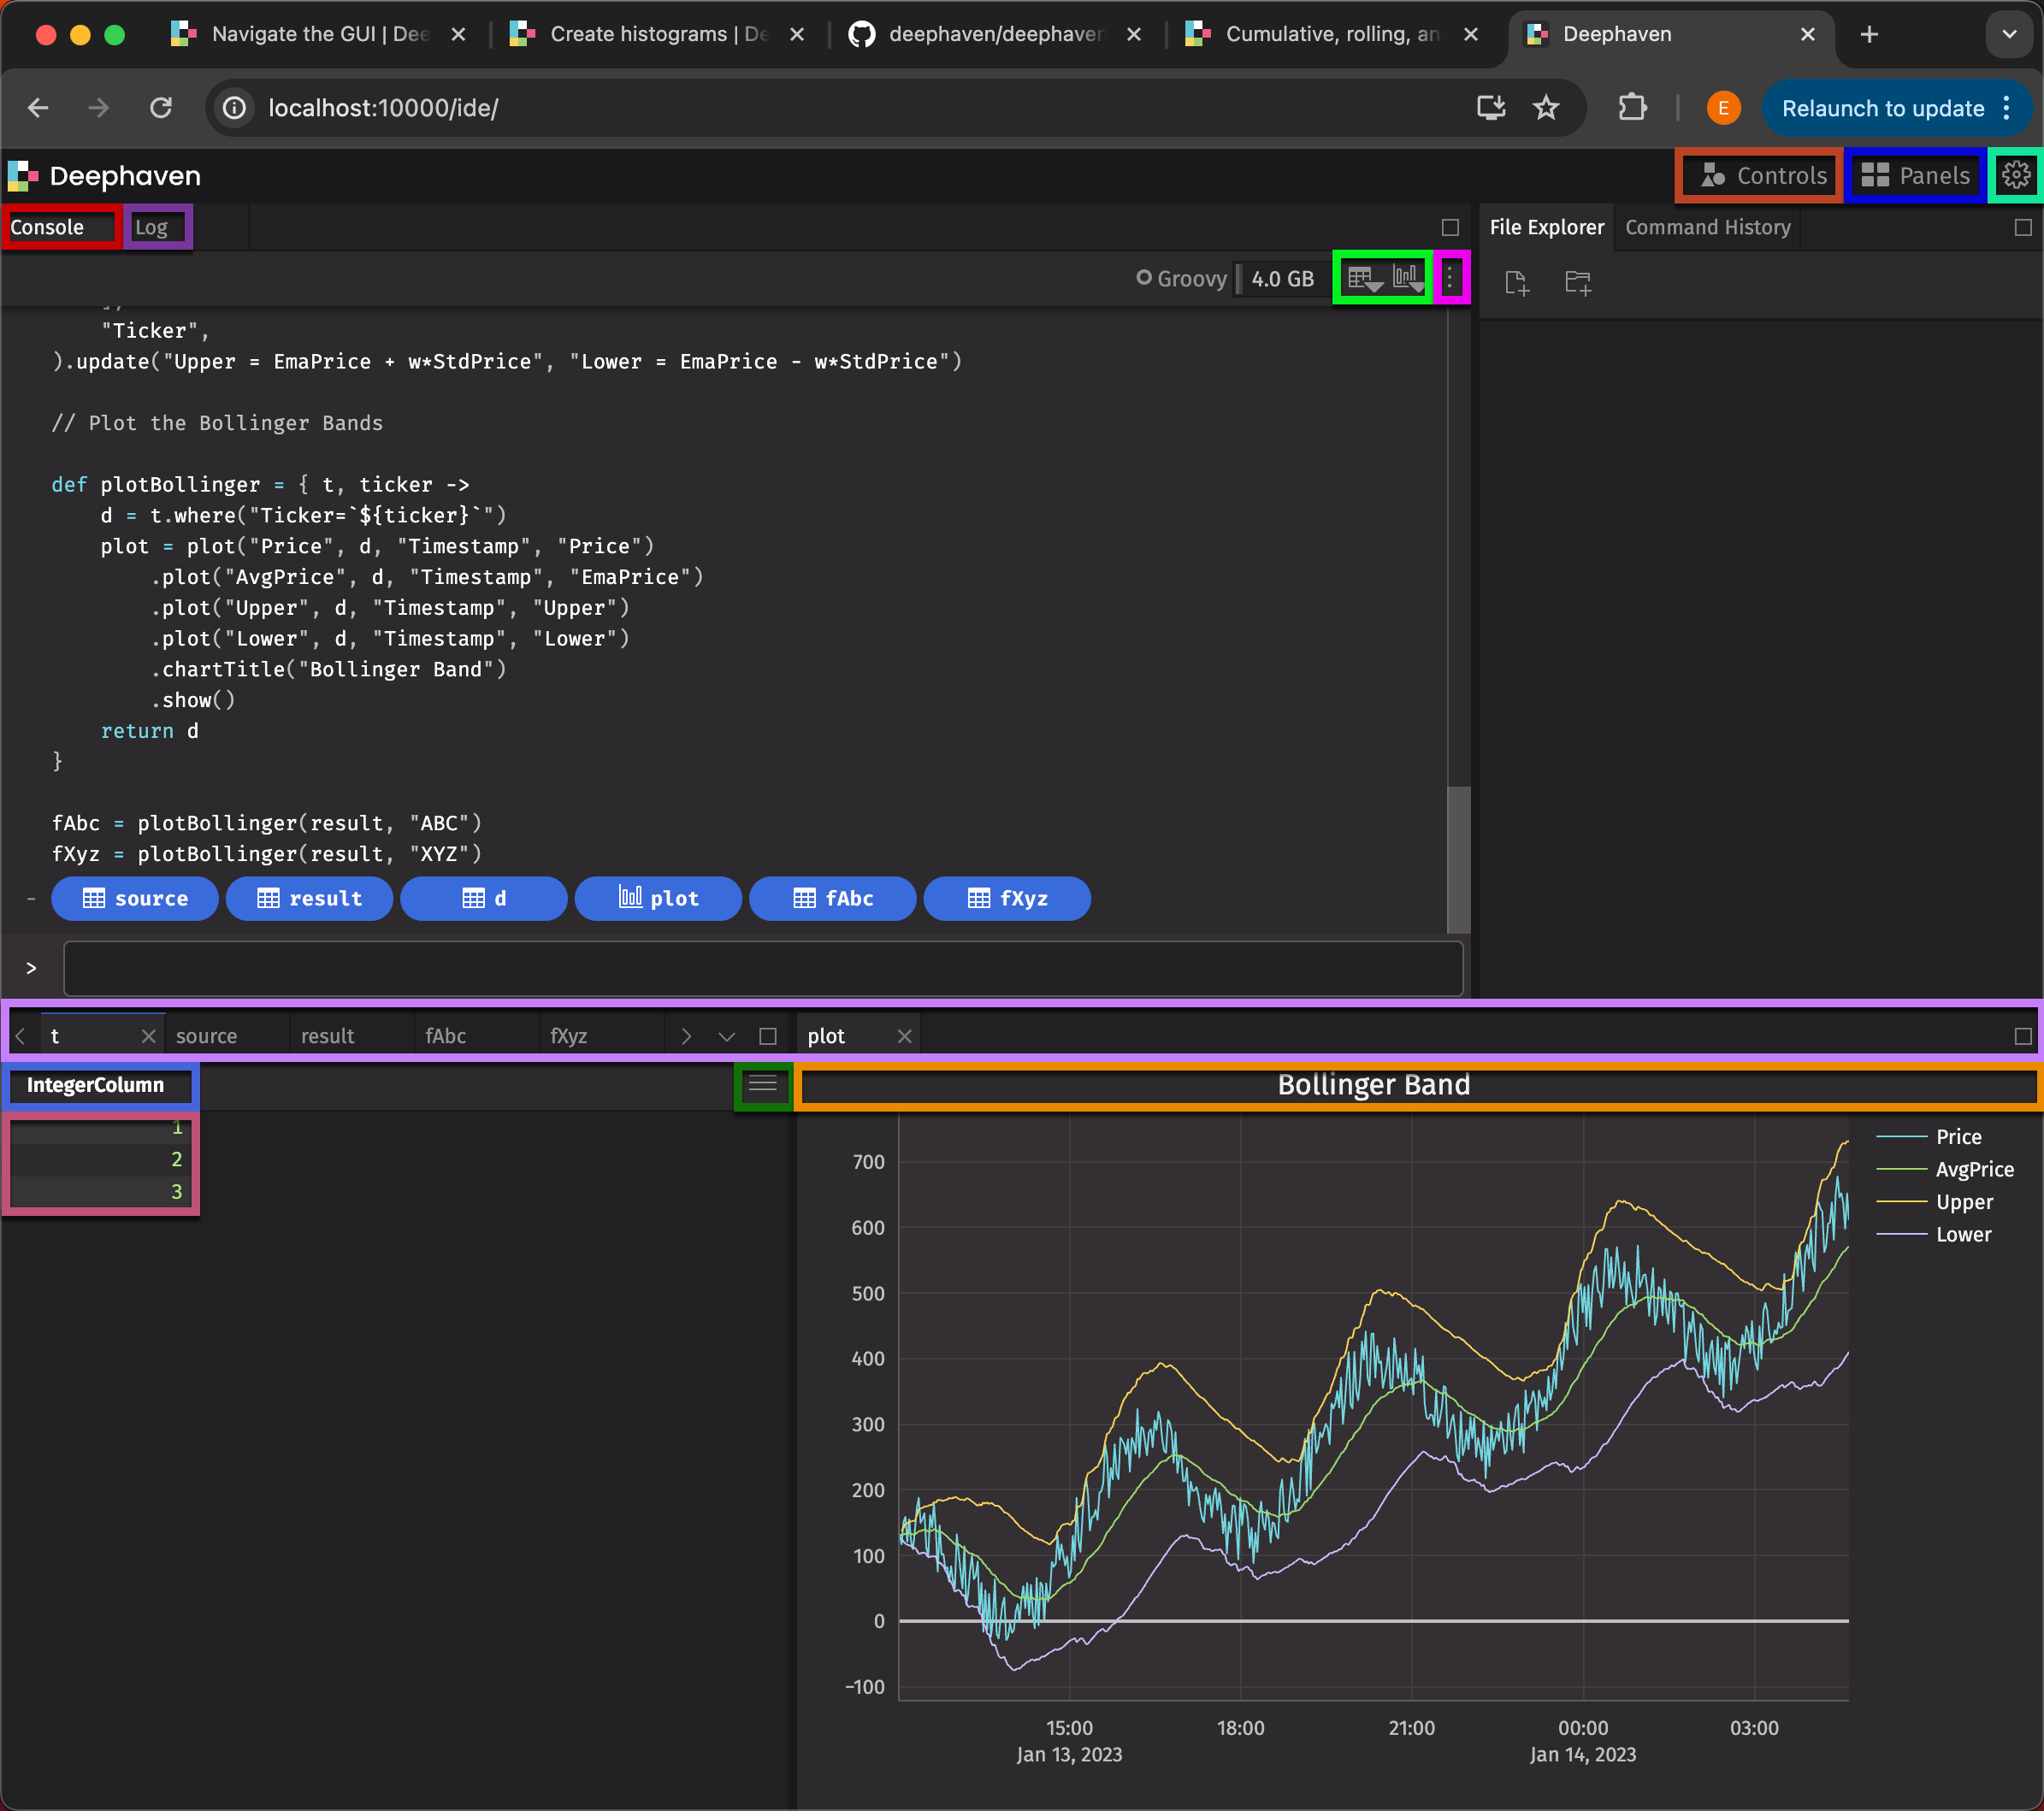
Legend
- Console: The console is where you can type and run code. Most of the work you do in Deephaven will likely be done in this panel.
- Log: Navigate to this panel to view your Deephaven instance's complete log.
- Tables and Widgets Dropdowns: These menus list all of the tables, plots, and other widgets in your Deephaven instance. Click on a table or widget to view it.
- Console Options: This menu contains options to change the console's behavior, such as whether to auto-launch panels or automatically close them upon a disconnection.
- File Explorer: Here you can upload and download files to and from your Deephaven instance.
- Command History: This panel shows a history of the commands you've run in the console.
- Controls Panel: Here you can add and remove filters, create widgets, and access the Linker tool.
- Panels Panel: Here you can search for panels in your Deephaven instance, as well as import and export layouts.
- Settings: This menu contains options to change global Deephaven settings, like time zone, integer precision, string behavior, and the theme of the UI.
- Viewing Area: This is where you can view tables, plots, and other widgets in your Deephaven instance.
- Table data context menus: Right-click on a cell in a table to reveal the cell context menu. Here you will find options to copy data, filter, and more.
- Column Header menu: Right-click on a column header to reveal the header menu. Here you will find options to freeze, filter, sort, and more.
- Table options menu: Click on the hamburger icon in the top right corner of a table to reveal the table options menu. Here you will find tools to organize columns, perform conditional formatting, perform aggregations, download a CSV of the table data, and more.
- Plot menu: Hover over the title of a plot to reveal the plot menu. Here you will find options to save the plot as an image, zoom in and out, and more.