Deephaven Community Core Quickstart
Deephaven Community Core can be installed with Docker or the production application. If you are familiar with Docker or already have it installed, the single-line Docker command is an easy way to get started with Deephaven. If you prefer not to use Docker, use the production application.
1. Install and launch Deephaven
With Docker
Install and launch Deephaven via Docker with a one-line command:
Caution
Replace YOUR_PASSWORD_HERE with a secure password of your own. The -Dauthentication.psk option sets the password (a pre-shared key) that you use to log in to Deephaven.
The -v option mounts the data folder in your current directory at /data inside the container, so files that Deephaven writes to /data appear in that folder on your machine. Docker creates the folder if it doesn't exist.
For additional configuration options, see the install guide for Docker.
With native Deephaven
Download the Deephaven server-jetty-<version>.tar file from the assets of the latest release using your browser or the command line, unpack the tar file, and start Deephaven. The commands below use a DH_VERSION environment variable. Replace LATEST_VERSION_HERE with the version number of the latest release, without the leading v.
Caution
Replace YOUR_PASSWORD_HERE with a secure password of your own.
For more details, see the production application guide.
2. The Deephaven IDE
Navigate to http://localhost:10000/ and enter your password in the token field:
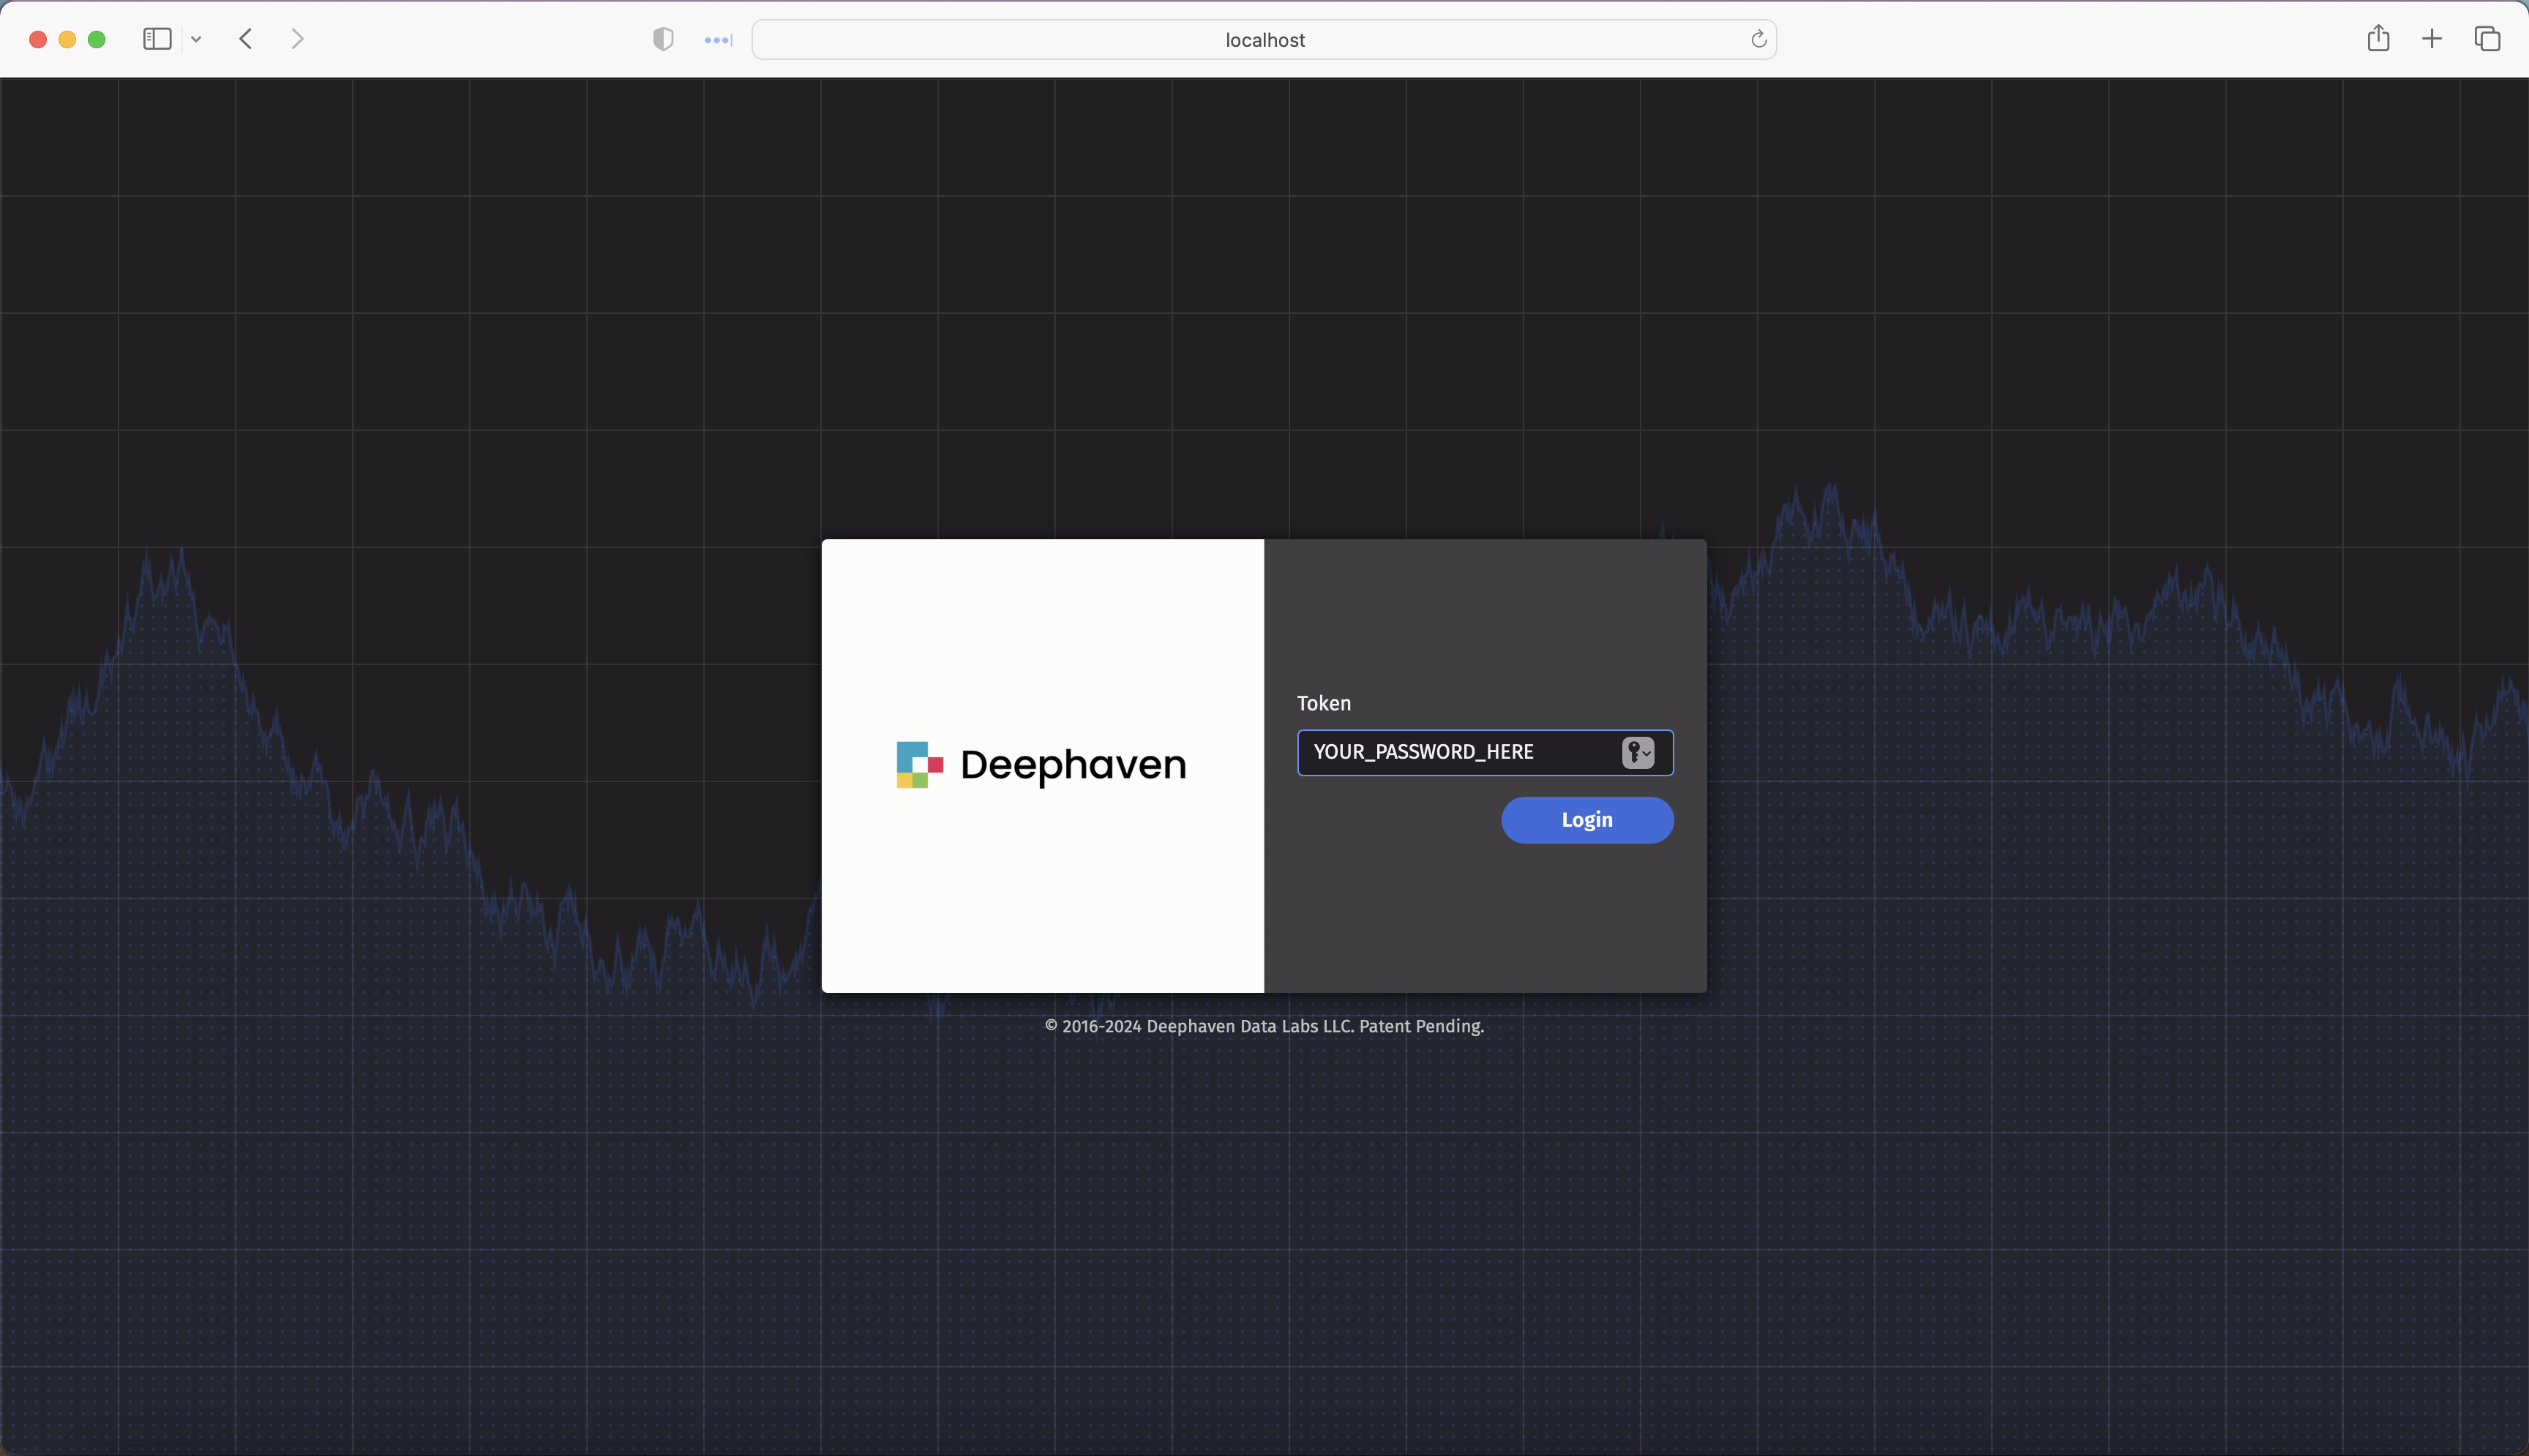
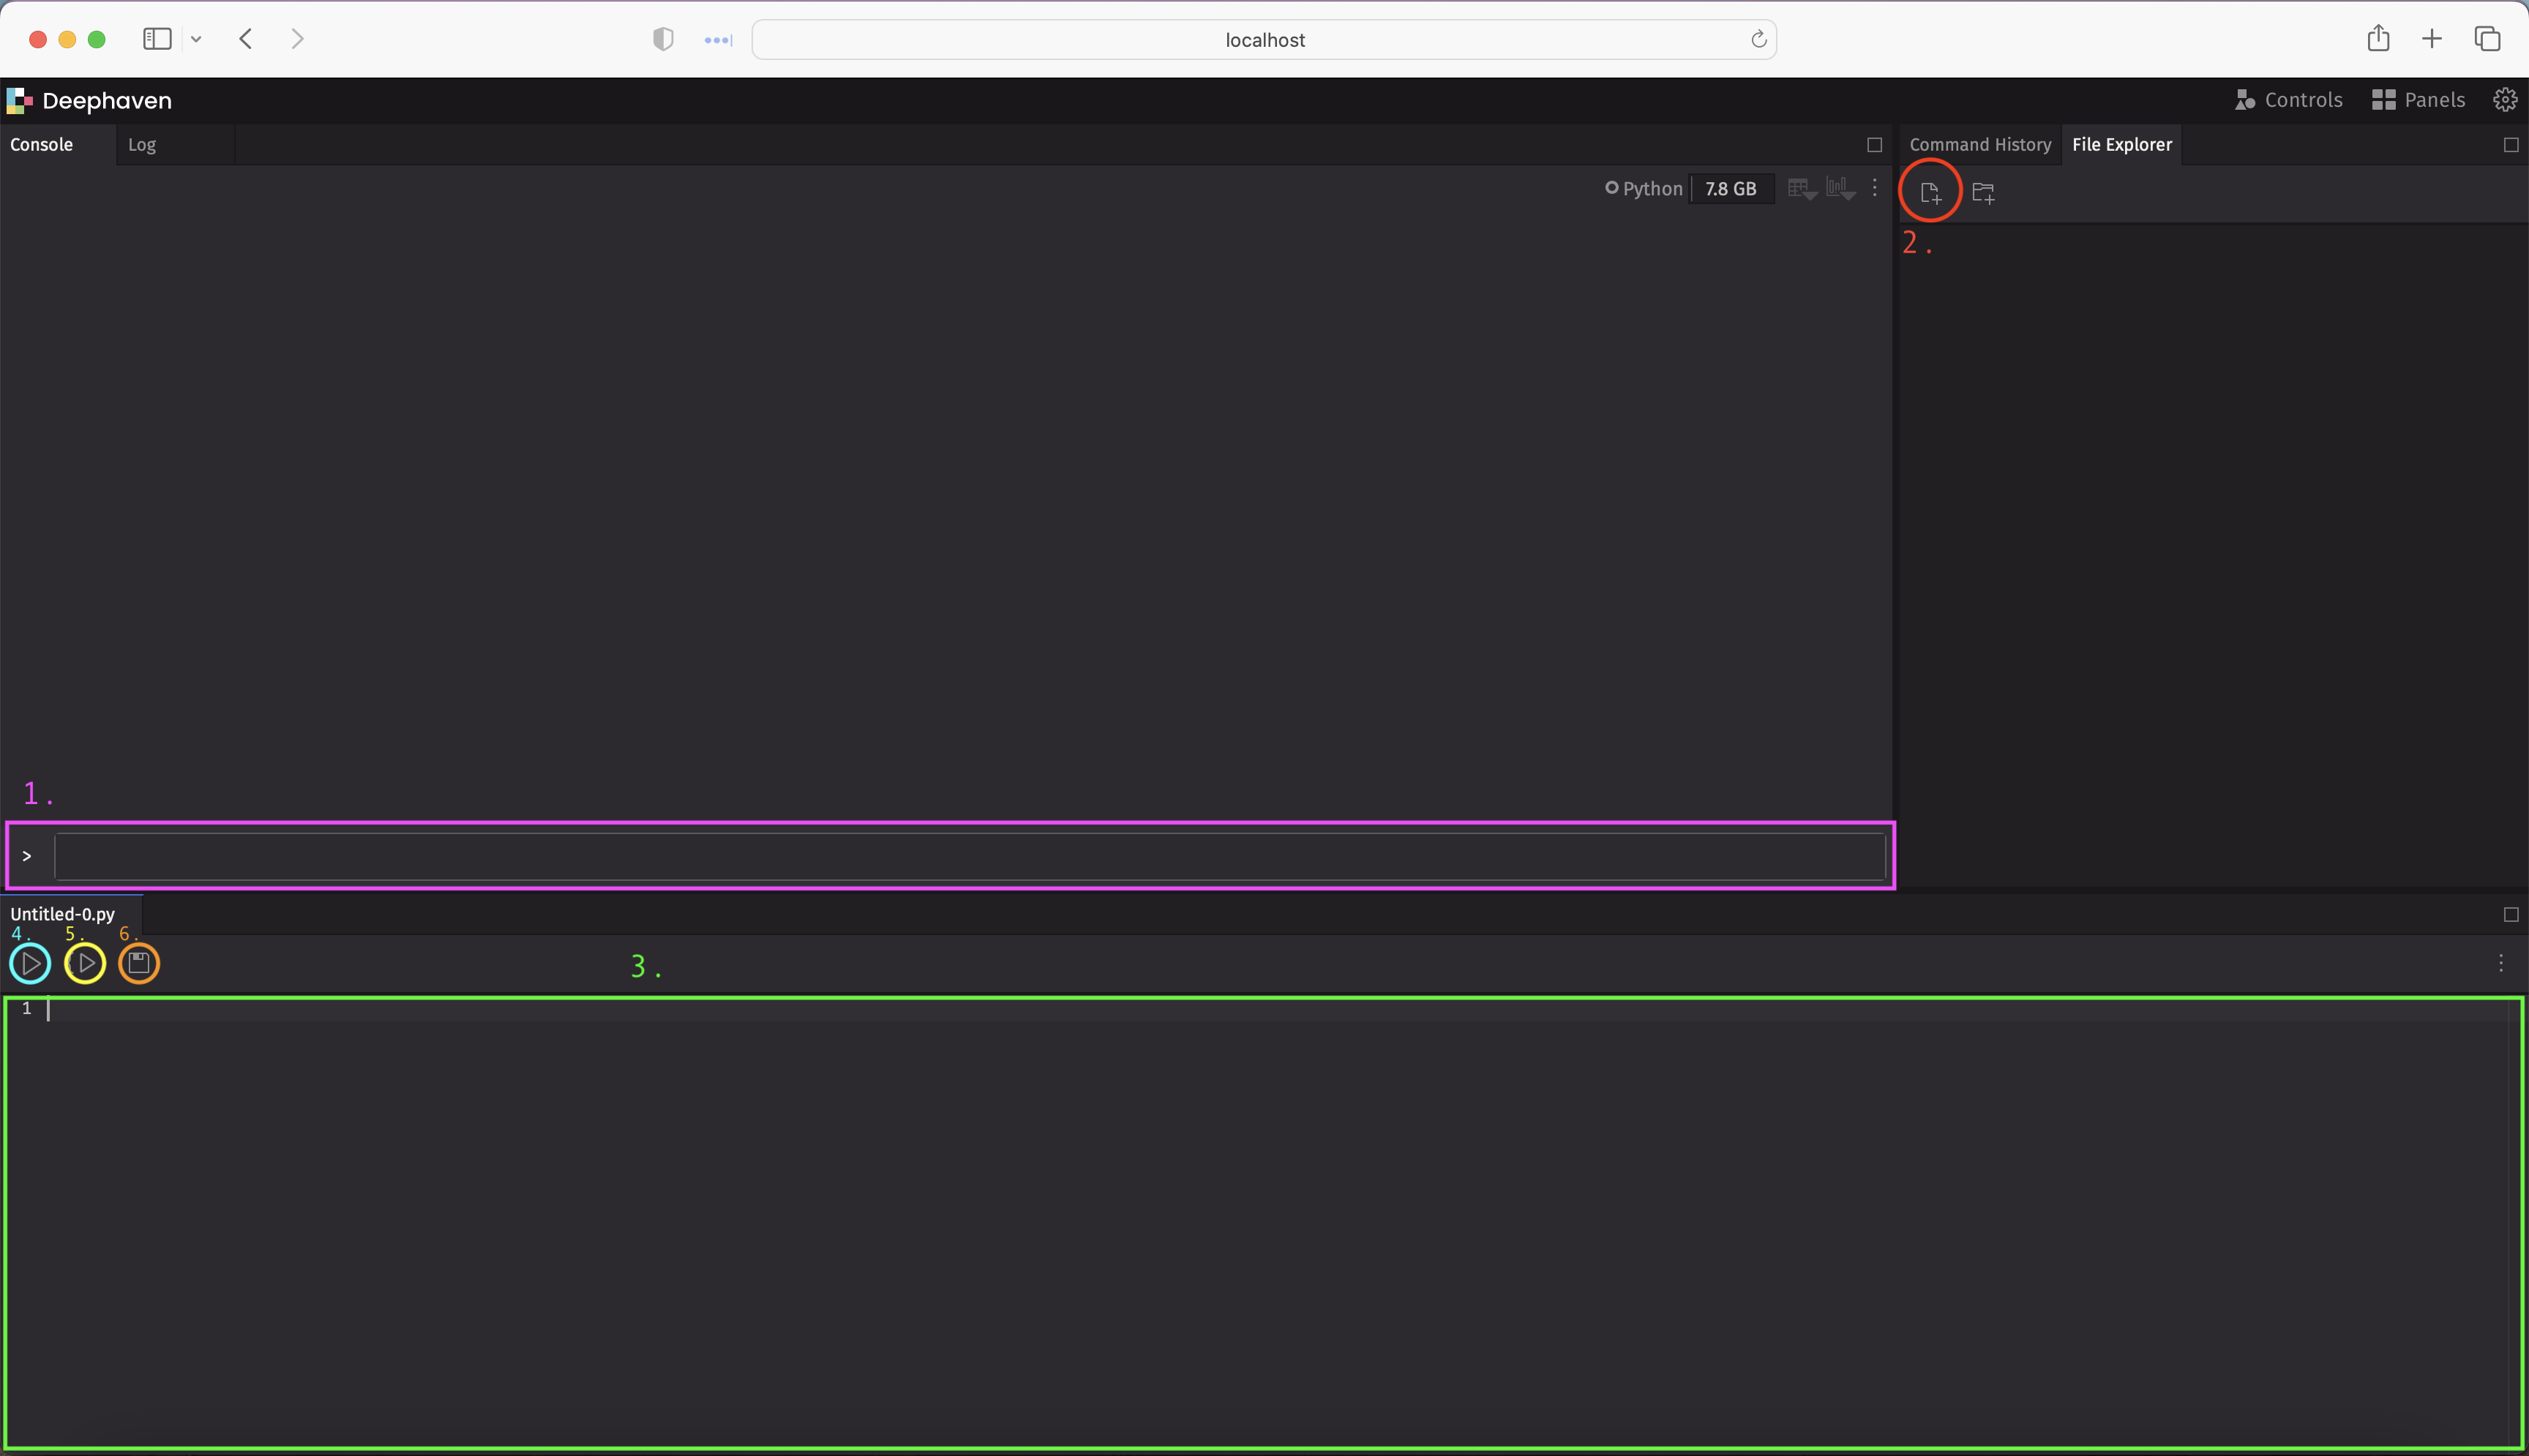
You're ready to go. The Deephaven IDE is a full scripting environment. Here's a brief overview of its basic features.
-
Write and execute commands
Use this console to write and execute Groovy and Deephaven commands.
-
Create new notebooks
Click this button to create new notebooks where you can write scripts.
-
Edit active notebook
Edit the currently active notebook.
-
Run entire notebook
Click this button to execute all of the code in the active notebook, from top to bottom.
-
Run selected code
Click this button to run only the selected code in the active notebook.
-
Save your work
Save your work in the active notebook. Do this often!
To learn more about the Deephaven IDE, check out the guide to navigating the GUI for a tour of the menus and tools. Then, take a look at the accompanying guides on graphical column manipulation, the IDE chart-builder, and more.
Now that you have Deephaven installed and open, the rest of this guide briefly highlights some key features of Deephaven.
3. Import static and streaming data
Deephaven works with both static and streaming data. It can ingest data from CSV files, Parquet files, and Kafka streams.
Load a CSV
Run the command below inside a Deephaven console to ingest a million-row CSV of crypto trades. All you need is a path or URL for the data:
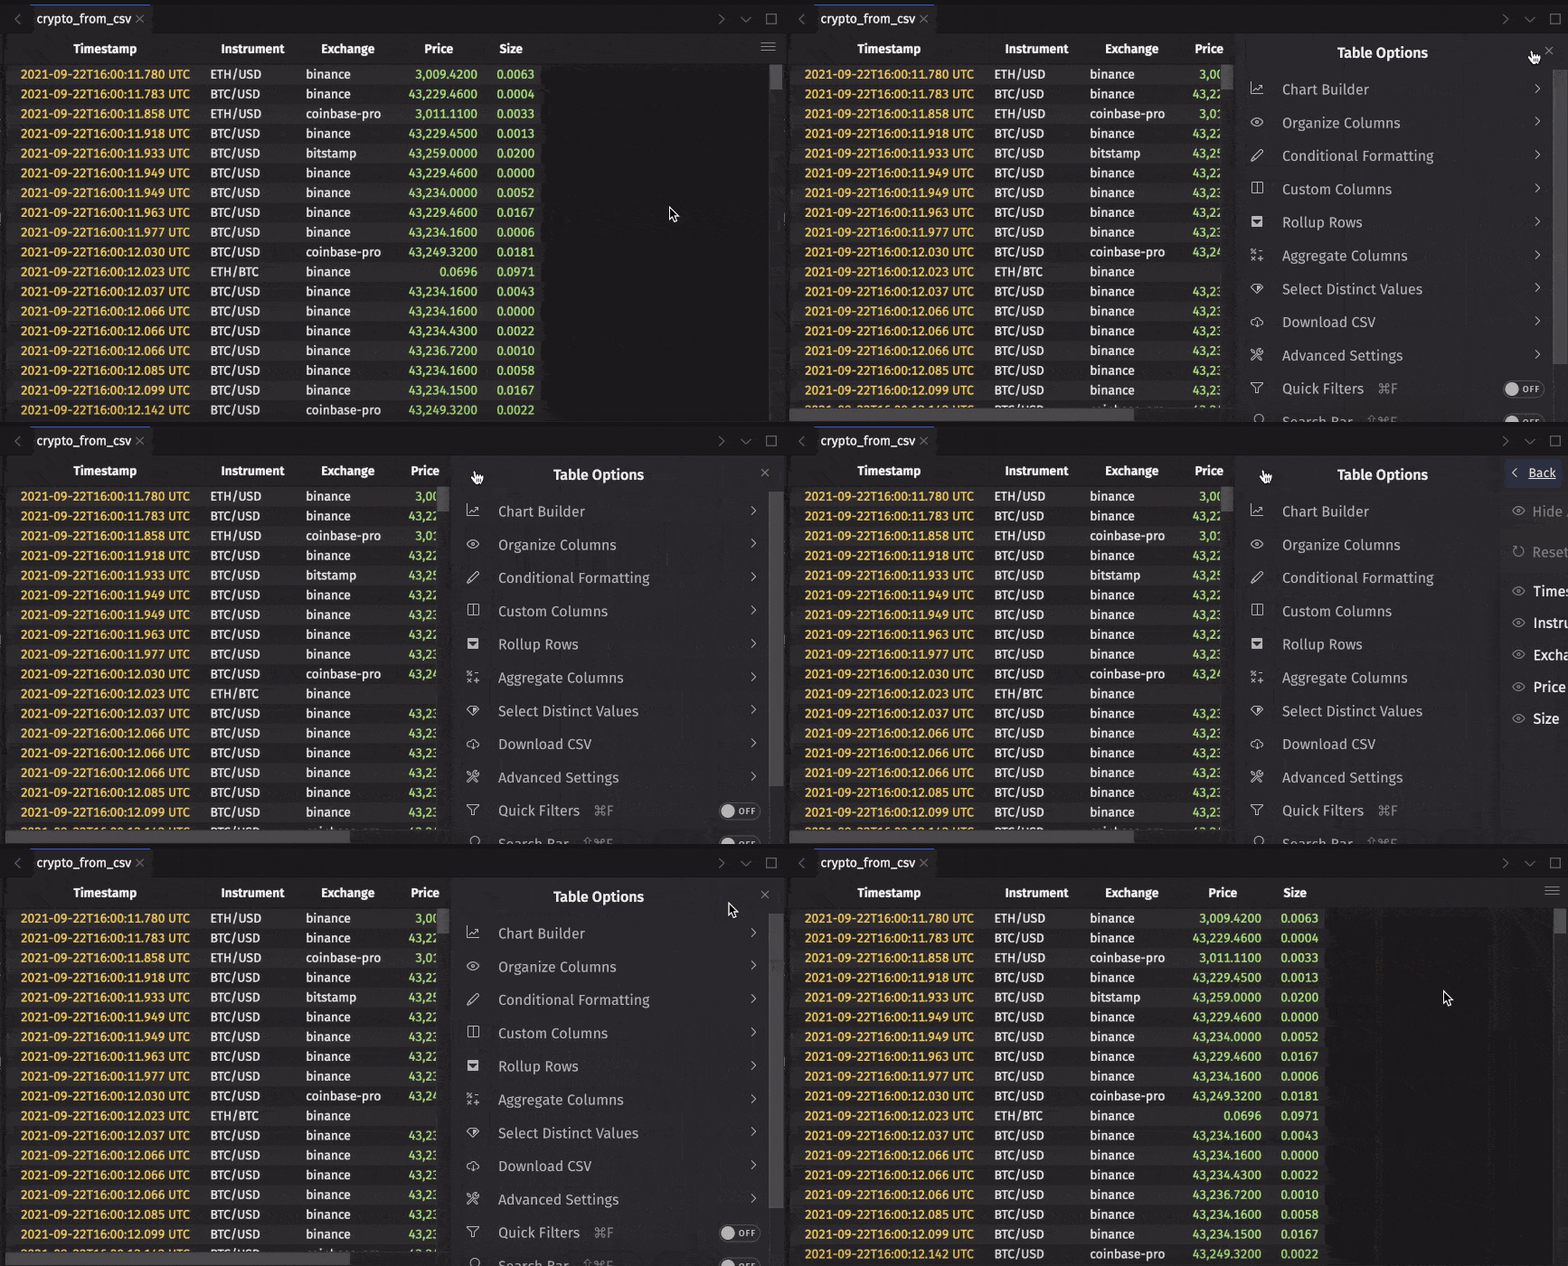
The table widget now in view is highly interactive:
- Click on a table and press Ctrl + F (Windows) or ⌘ + F (Mac) to open quick filters.
- Click the funnel icon in the filter field to create sophisticated filters or use auto-filter UI features.
- Hover over column headers to see data types.
- Right-click headers to access more options, like adding or changing sorts.
- Click the Table Options hamburger menu at right to plot from the UI, create and manage columns, and download CSVs.
Replay historical data
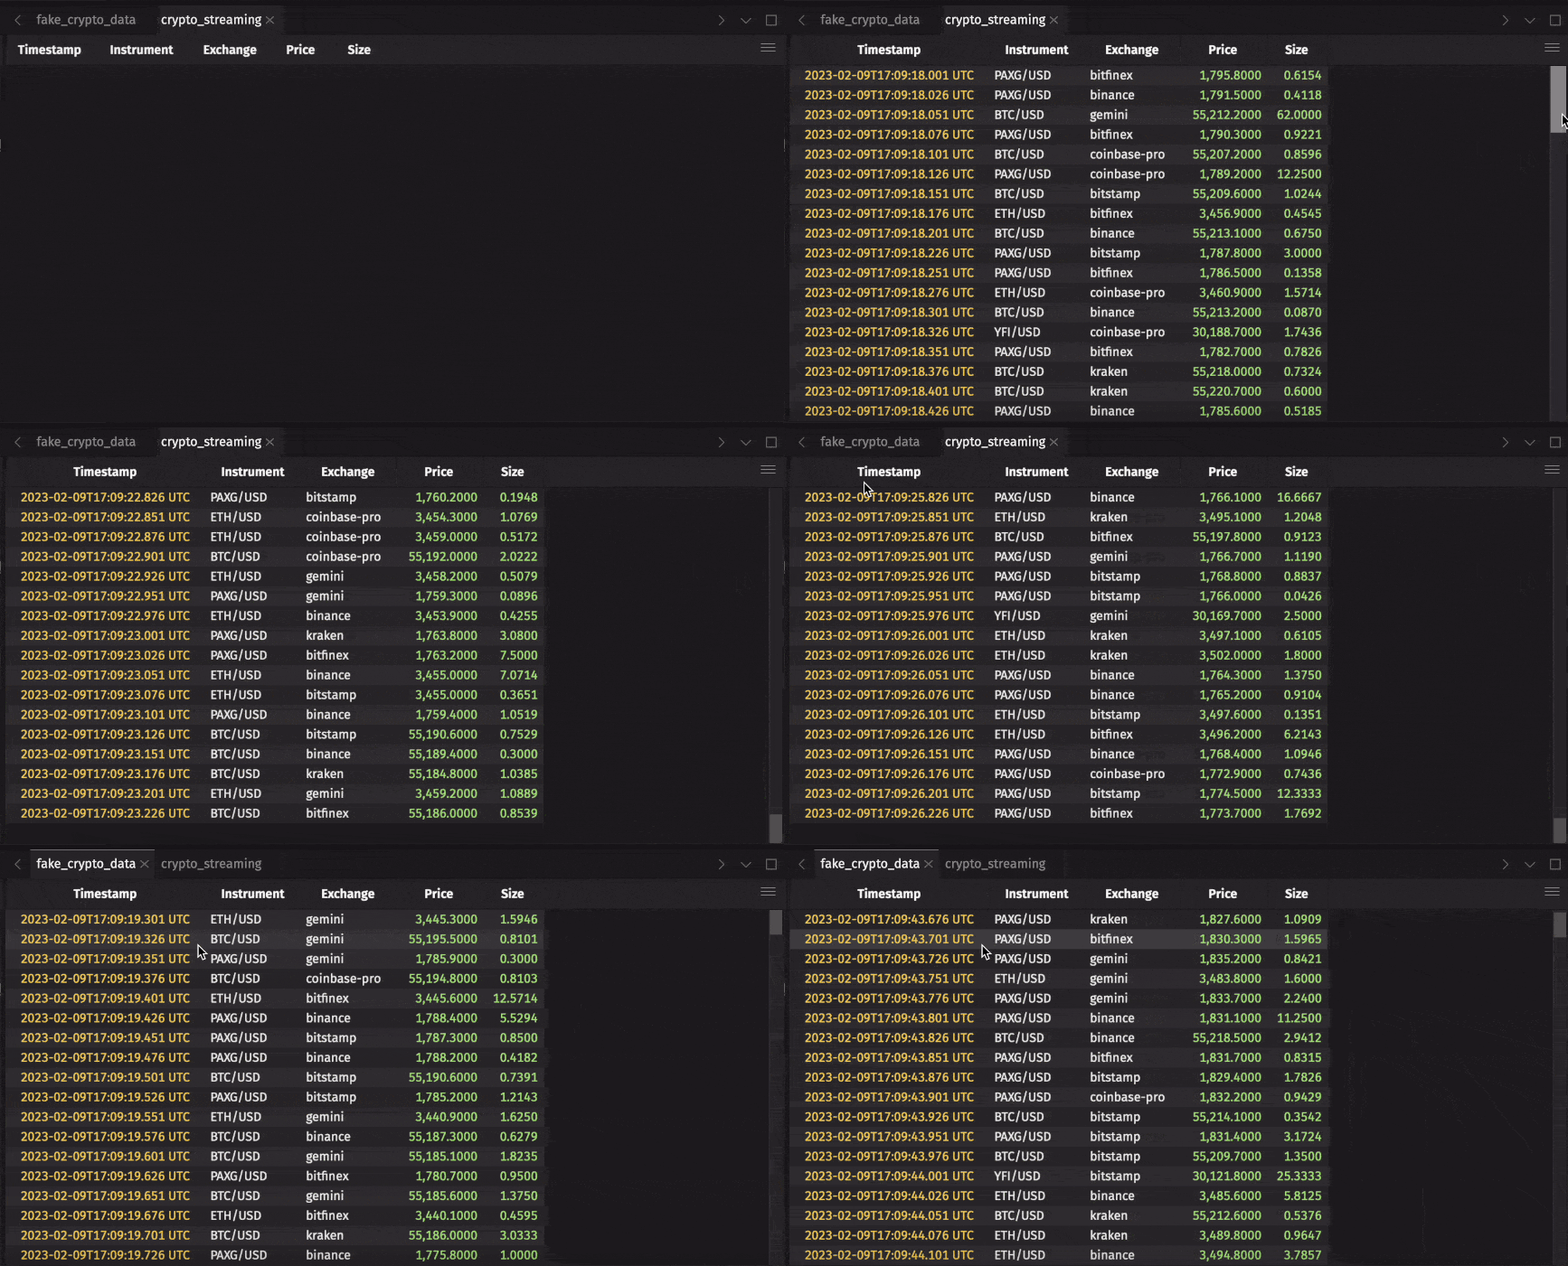
Ingesting real-time data is one of Deephaven's core strengths, and you can learn more about supported formats from the links at the end of this guide. However, streaming pipelines can be complicated to set up and are outside the scope of this guide. For a streaming data example, this guide uses Deephaven's Replayer to replay historical cryptocurrency data in real time.
The following code takes fake historical crypto trade data from a CSV file and replays it in real time based on timestamps. This is only one of multiple ways to create real-time data in just a few lines of code. Replaying historical data is a great way to test real-time algorithms before deployment into production.
4. Working with Deephaven tables
In Deephaven, static and dynamic data are represented as tables. New tables can be derived from parent tables, and data efficiently flows from parents to their dependents. See the concept guide on the table update model if you're interested in what's under the hood.
Deephaven represents data transformations as operations on tables. This is a familiar paradigm for data scientists using pandas, Polars, R, MATLAB, and more. Deephaven's table operations have one key difference — they work the same way whether the underlying data is static or streaming. This means that code written for static data also works on live data.
There are many table operations to cover, so this guide keeps it short and covers the highlights.
Manipulating data
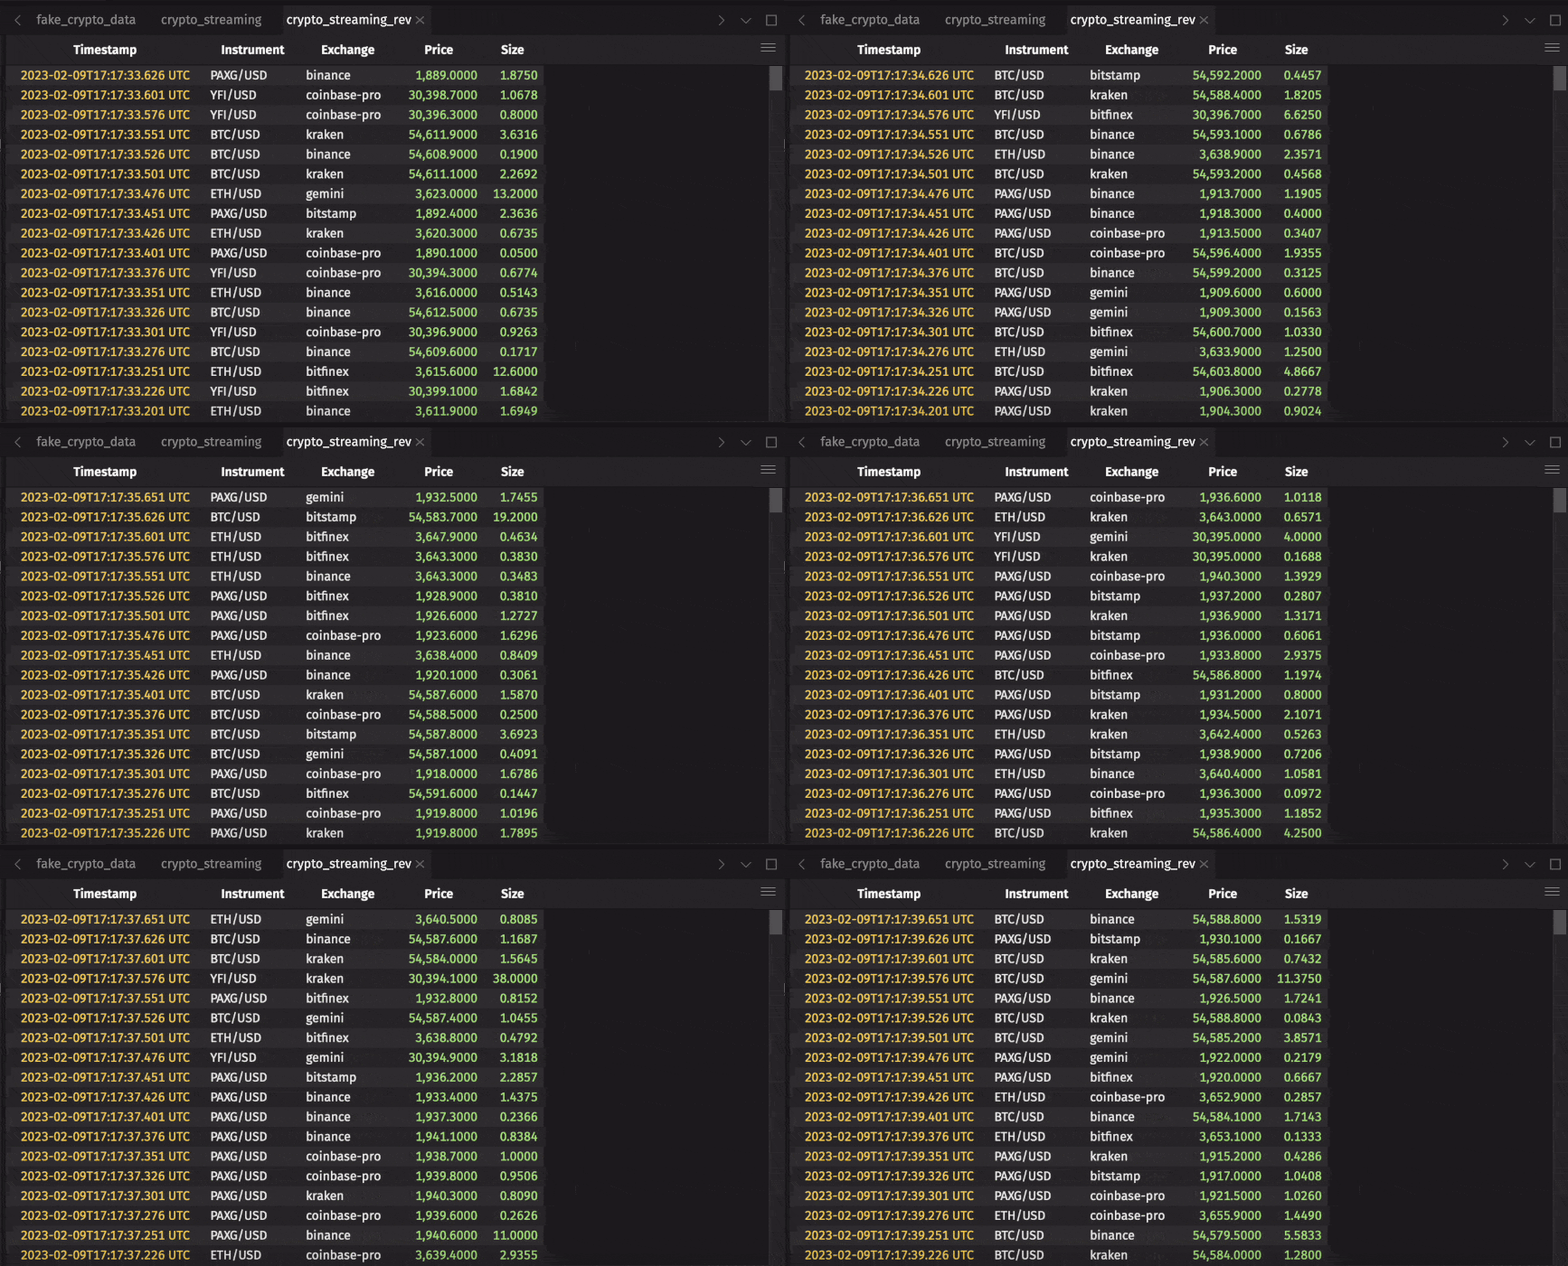
First, reverse the ticking (live-updating) cryptoStreaming table with reverse so that the newest data appears at the top:
Tip
Many table operations can also be done from the UI. For example, right-click on a column header in the UI and choose Reverse Table.
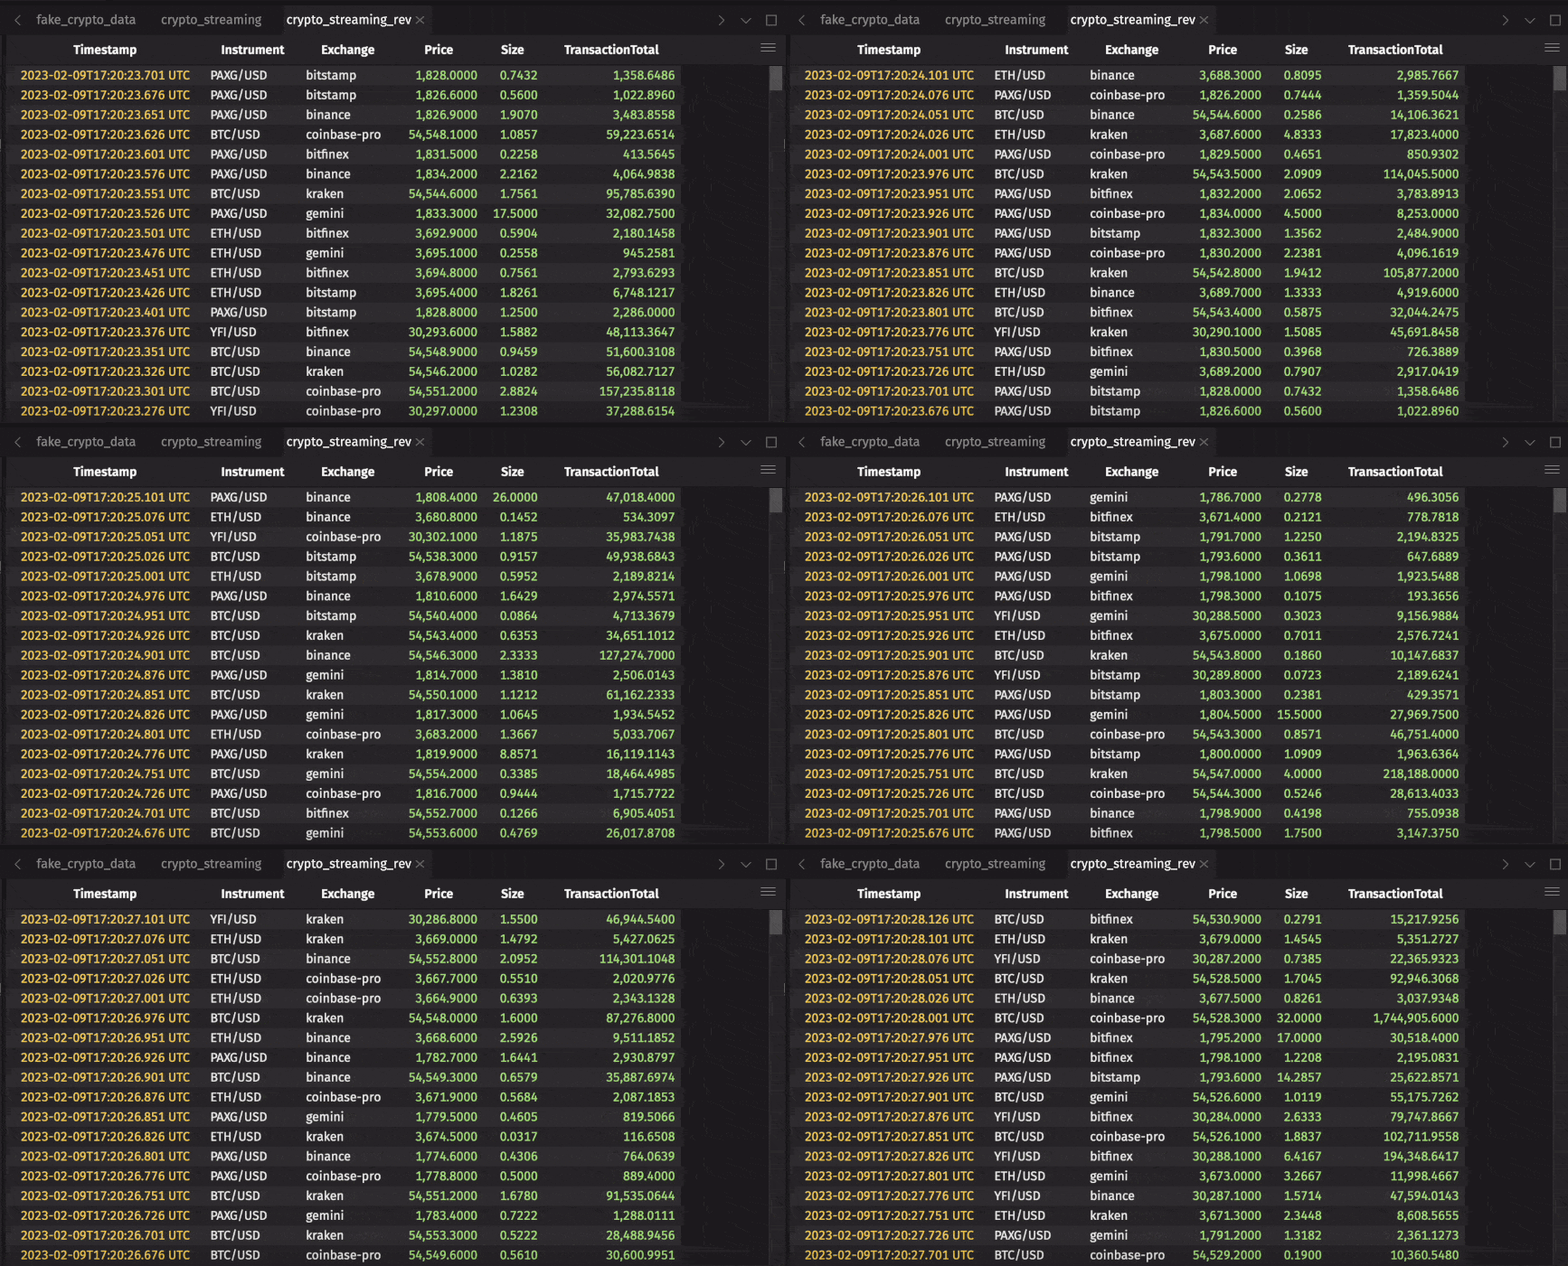
Add a column with update:
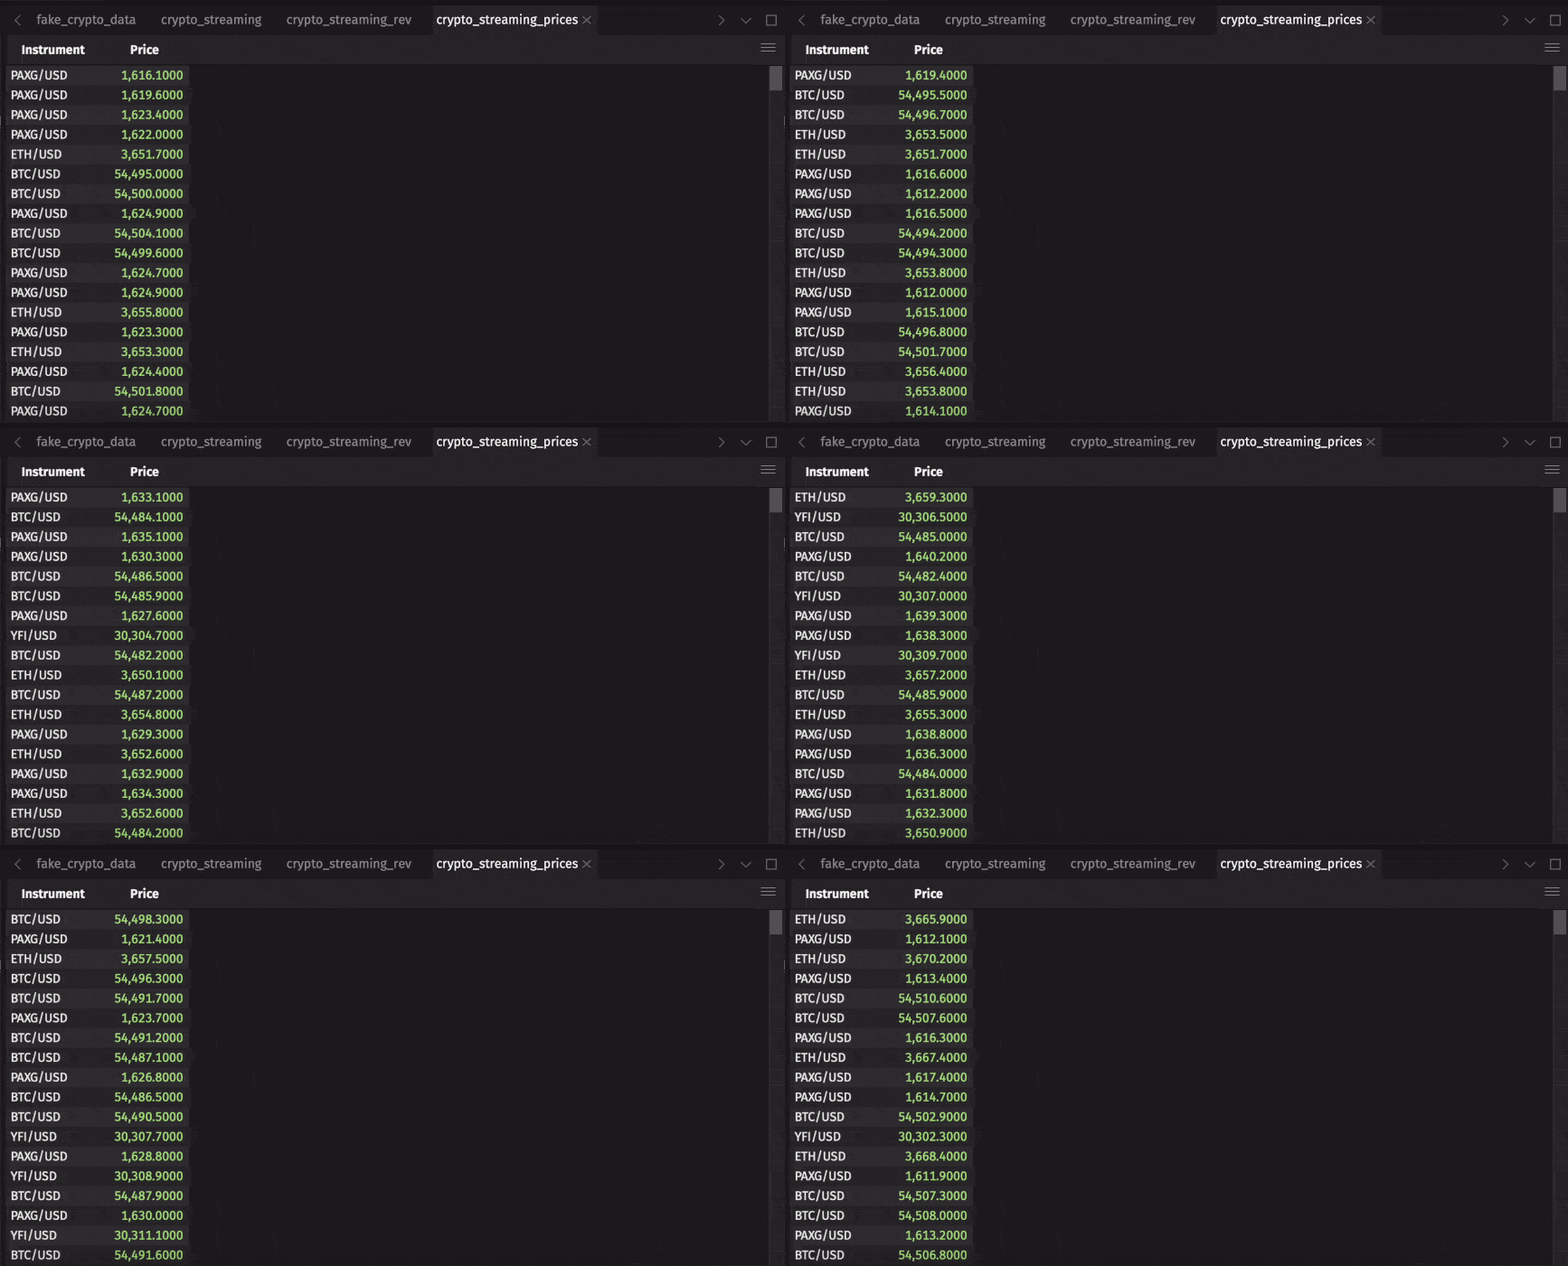
Use select or view to pick out particular columns:
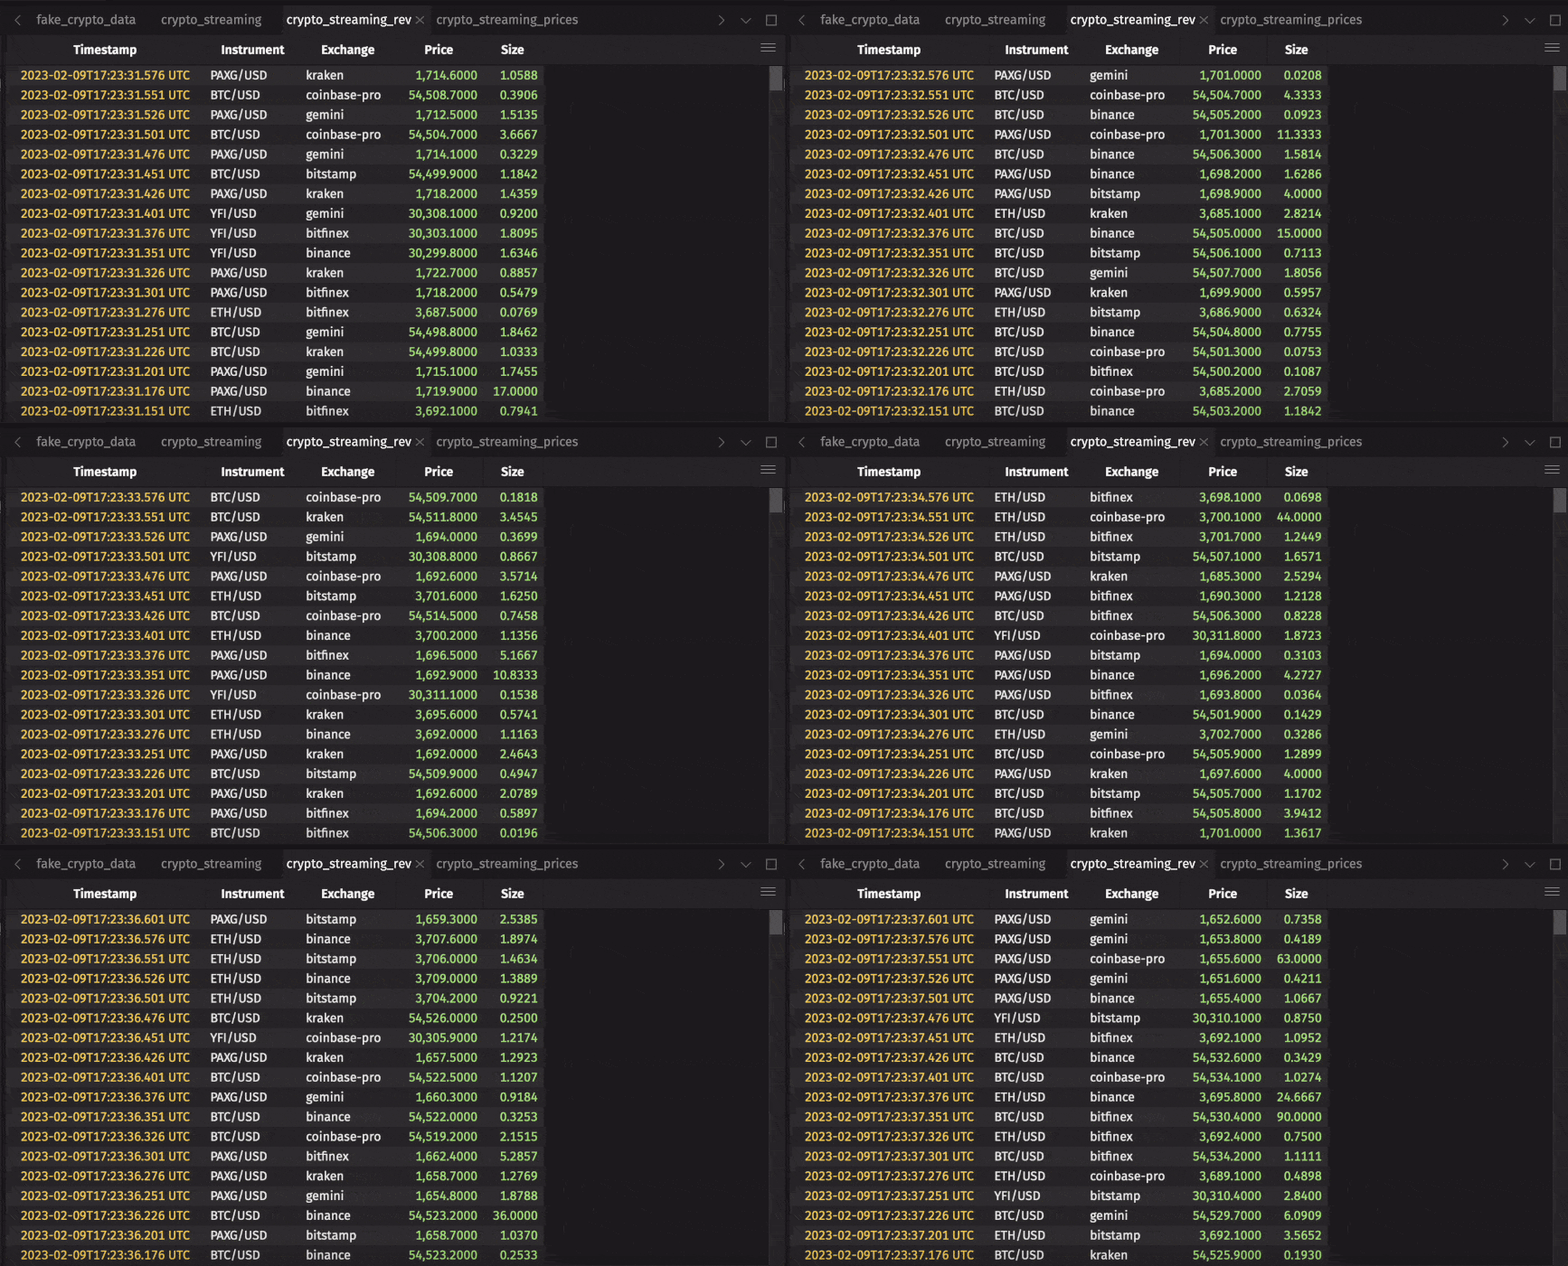
Remove columns with dropColumns:
Deephaven offers many operations for filtering tables, including where, whereIn, whereNotIn, and more.
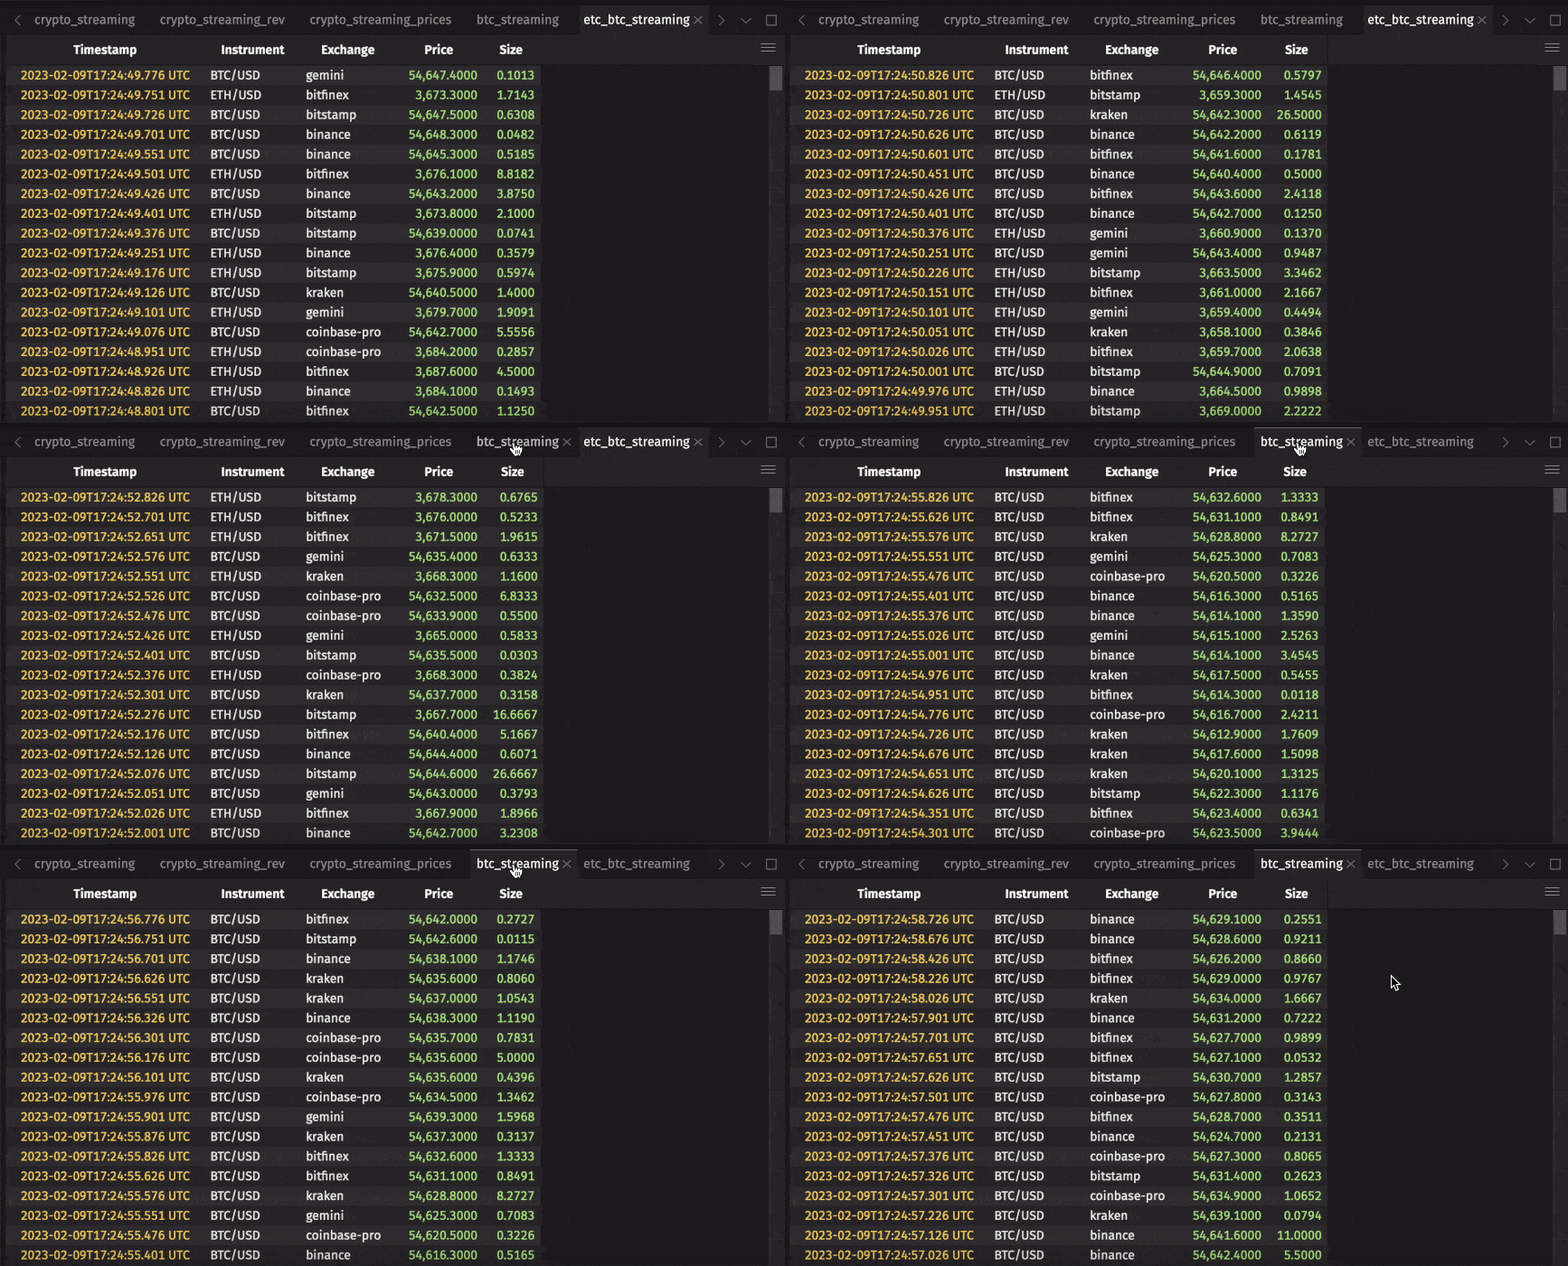
The following code uses where to filter for only Bitcoin transactions, and then for Bitcoin and Ethereum transactions:
Aggregating data
Deephaven's dedicated aggregations suite provides a number of table operations that enable efficient column-wise aggregations. These operations also support aggregations by group.
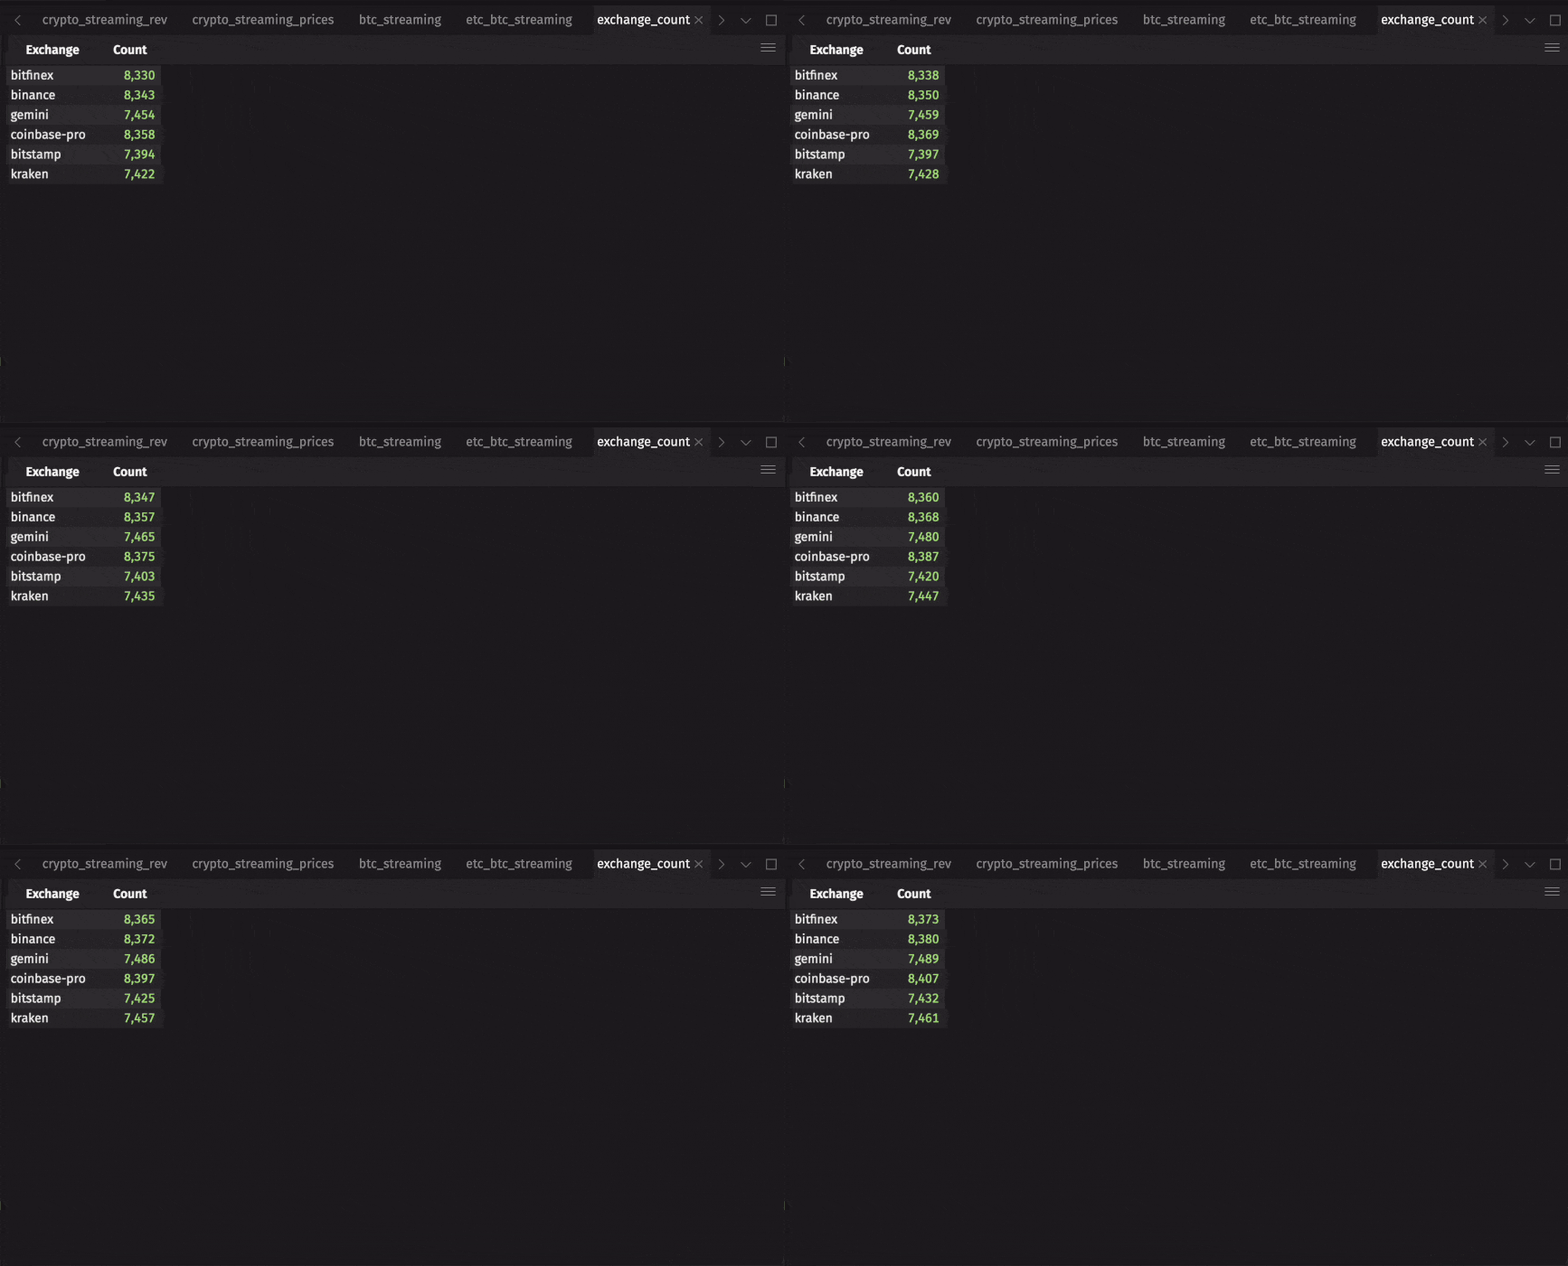
Use countBy to count the number of transactions from each exchange:
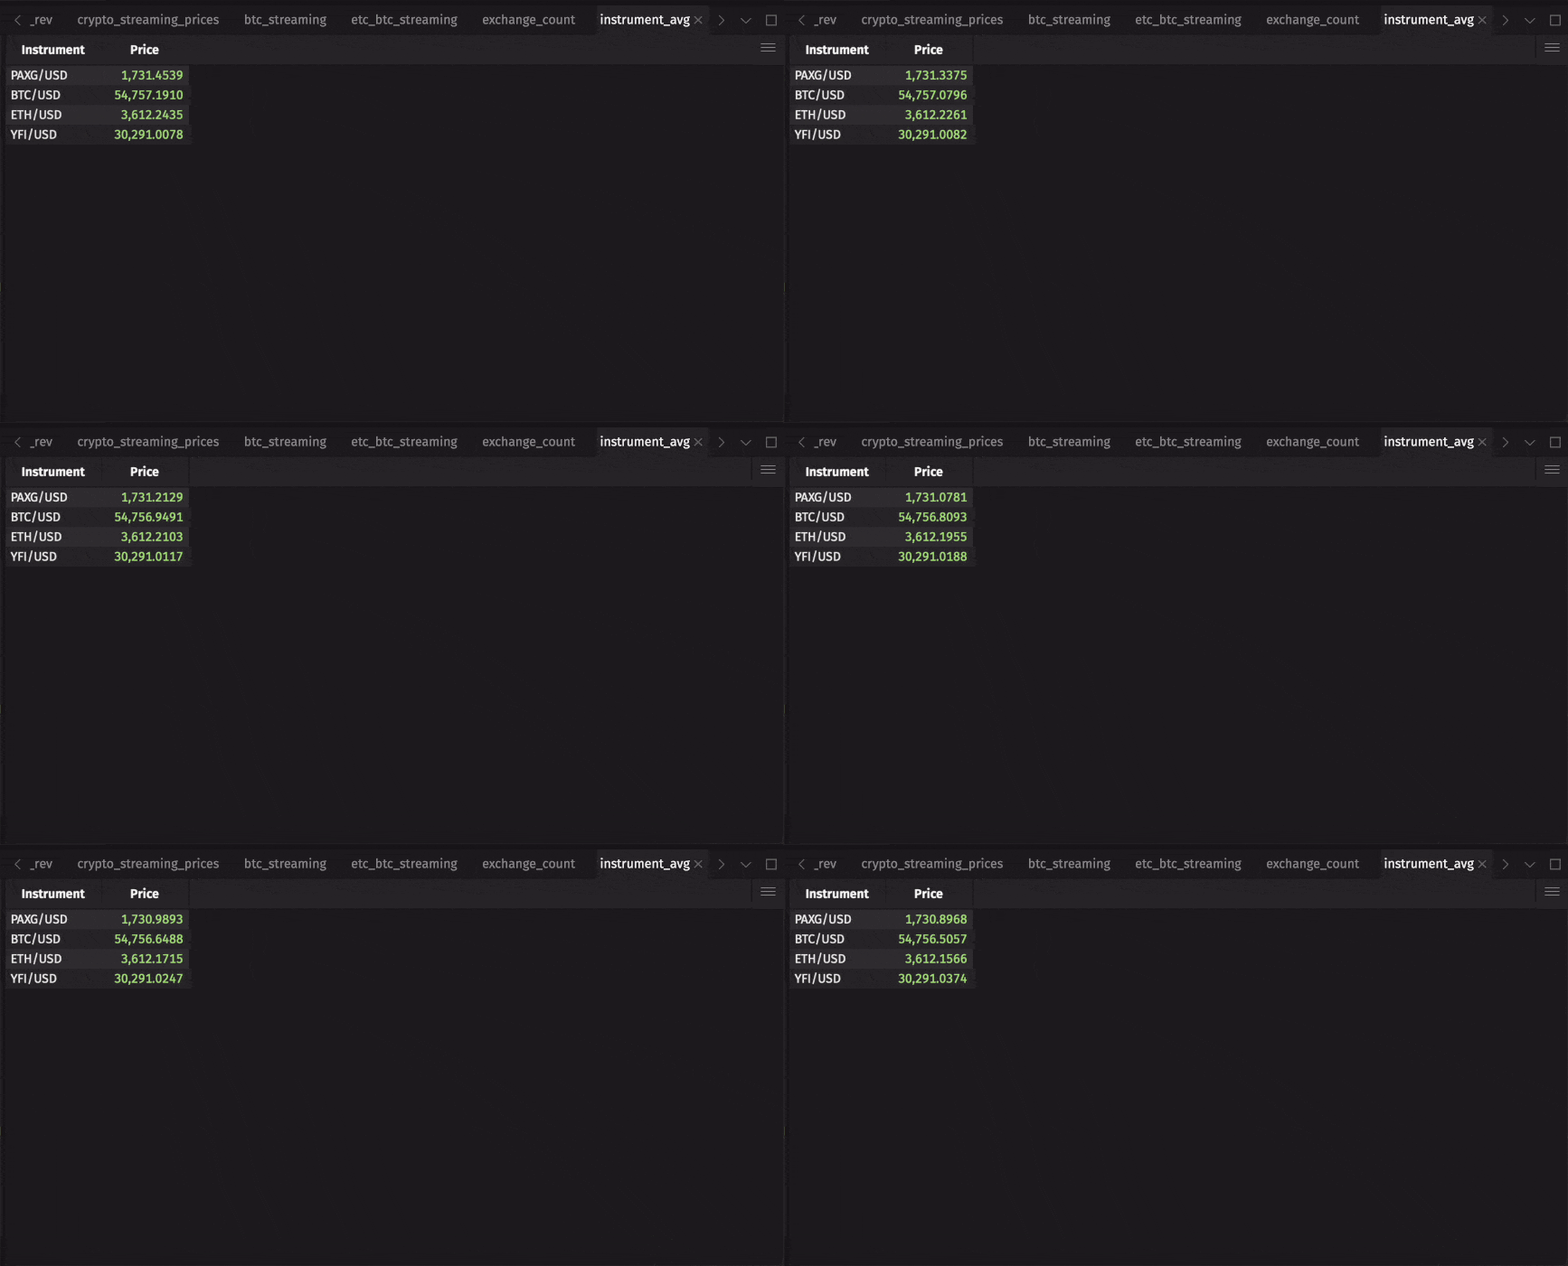
Then, get the average price for each instrument with avgBy:
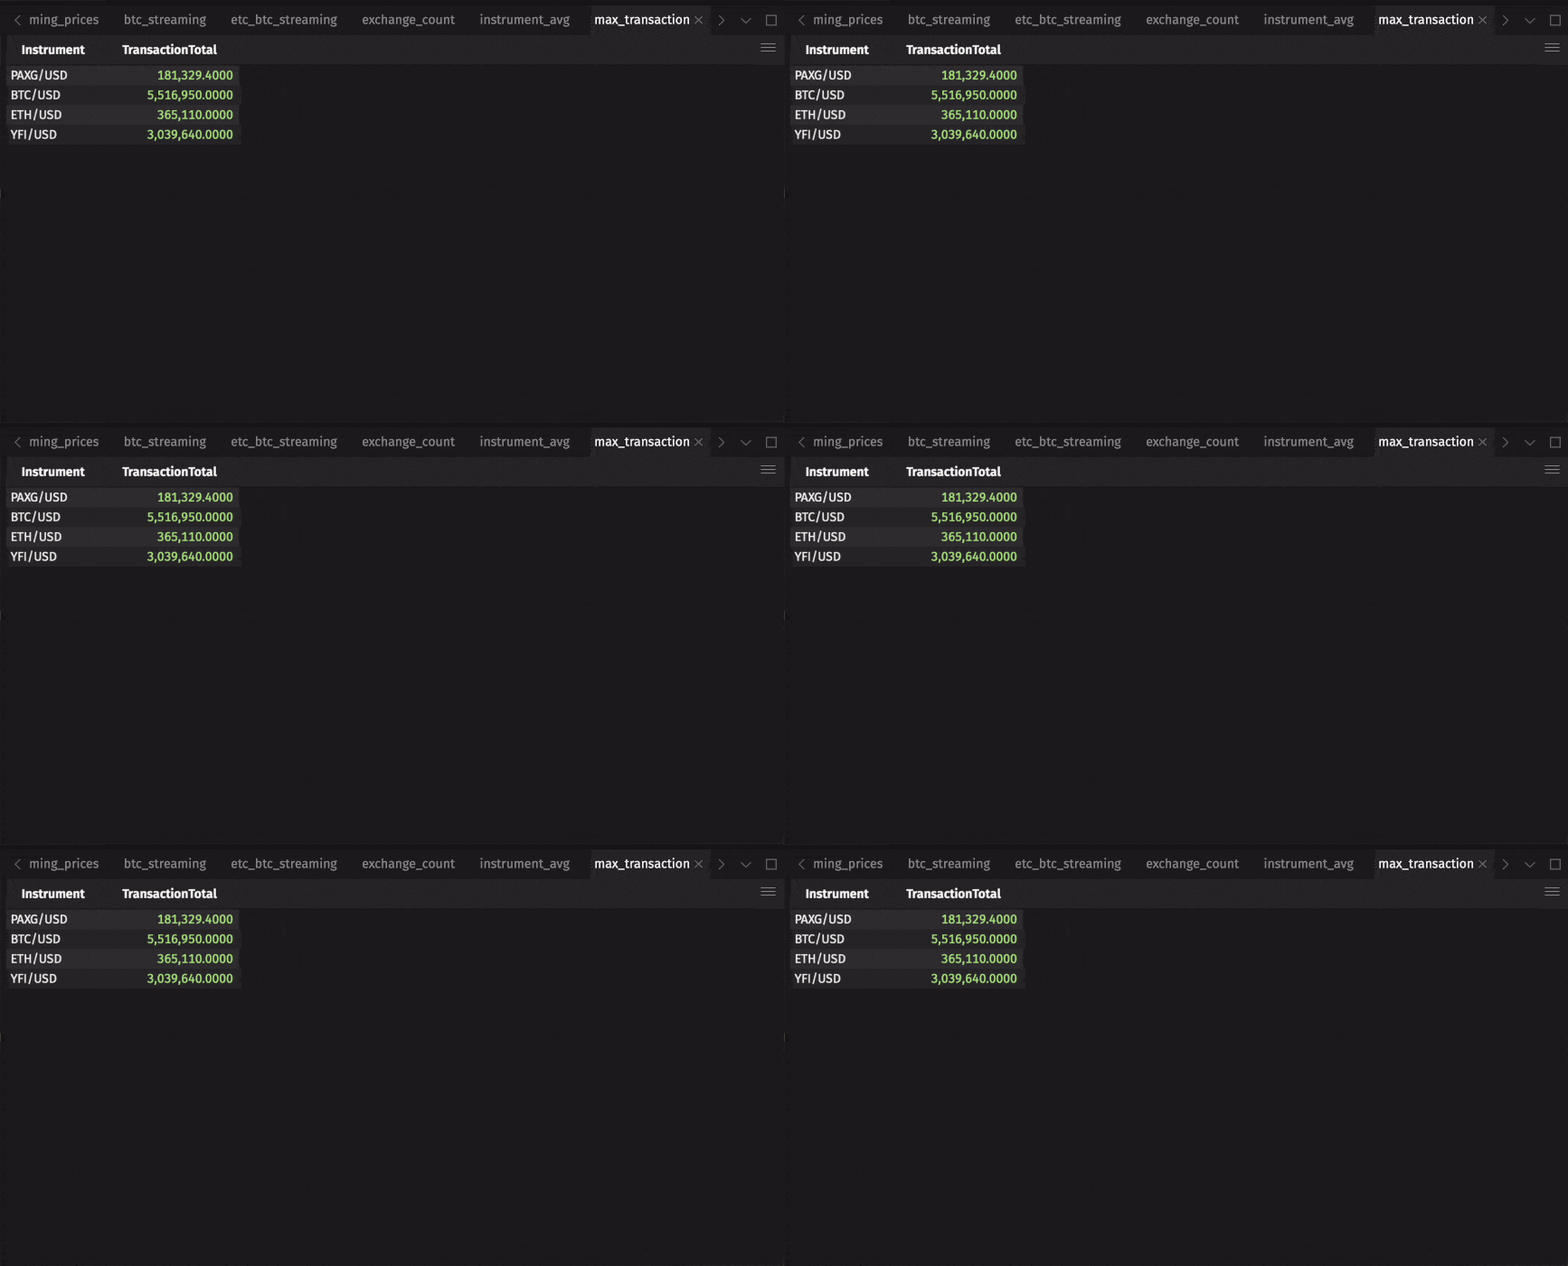
Find the largest transaction per instrument with maxBy:
While dedicated aggregations are powerful, they only enable you to perform one aggregation at a time. However, you often need to perform multiple aggregations on the same data. For this, Deephaven provides the aggBy table operation and the io.deephaven.api.agg.Aggregation Java API.
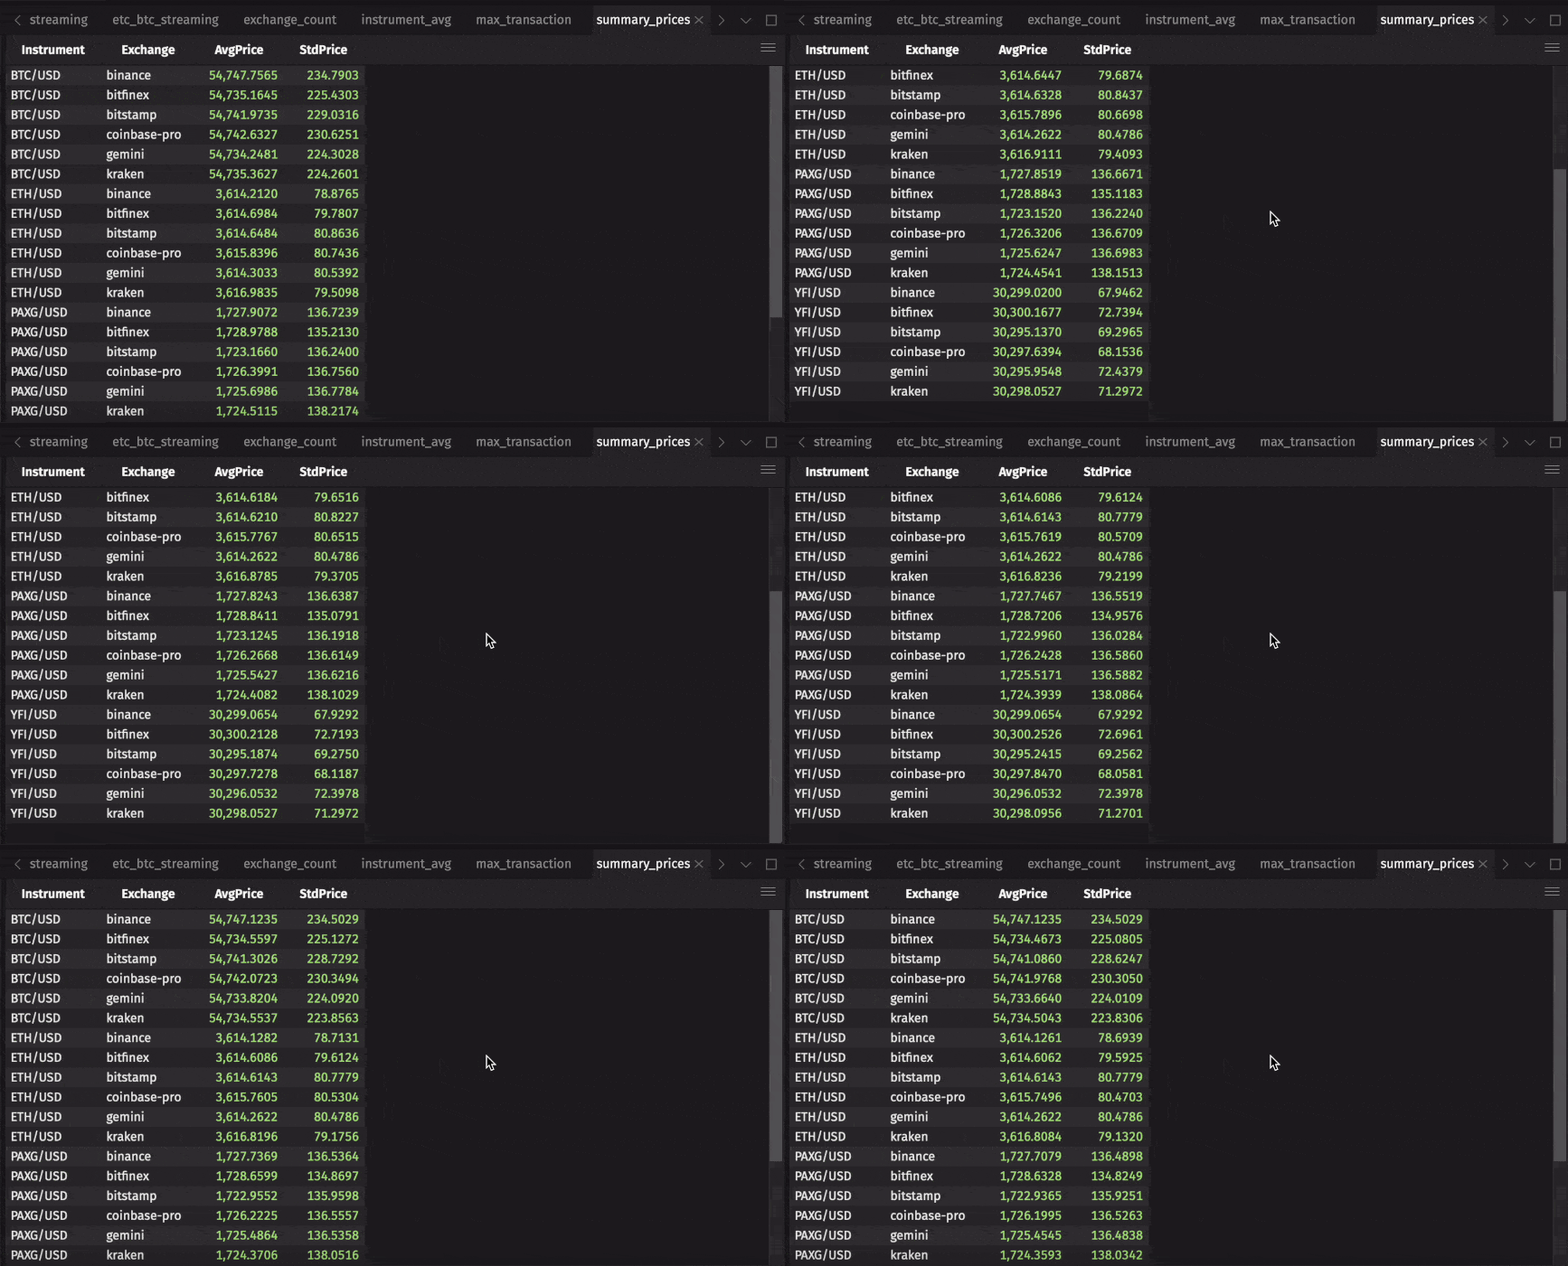
First, use aggBy to compute the mean and standard deviation of the price, grouped by instrument and exchange:
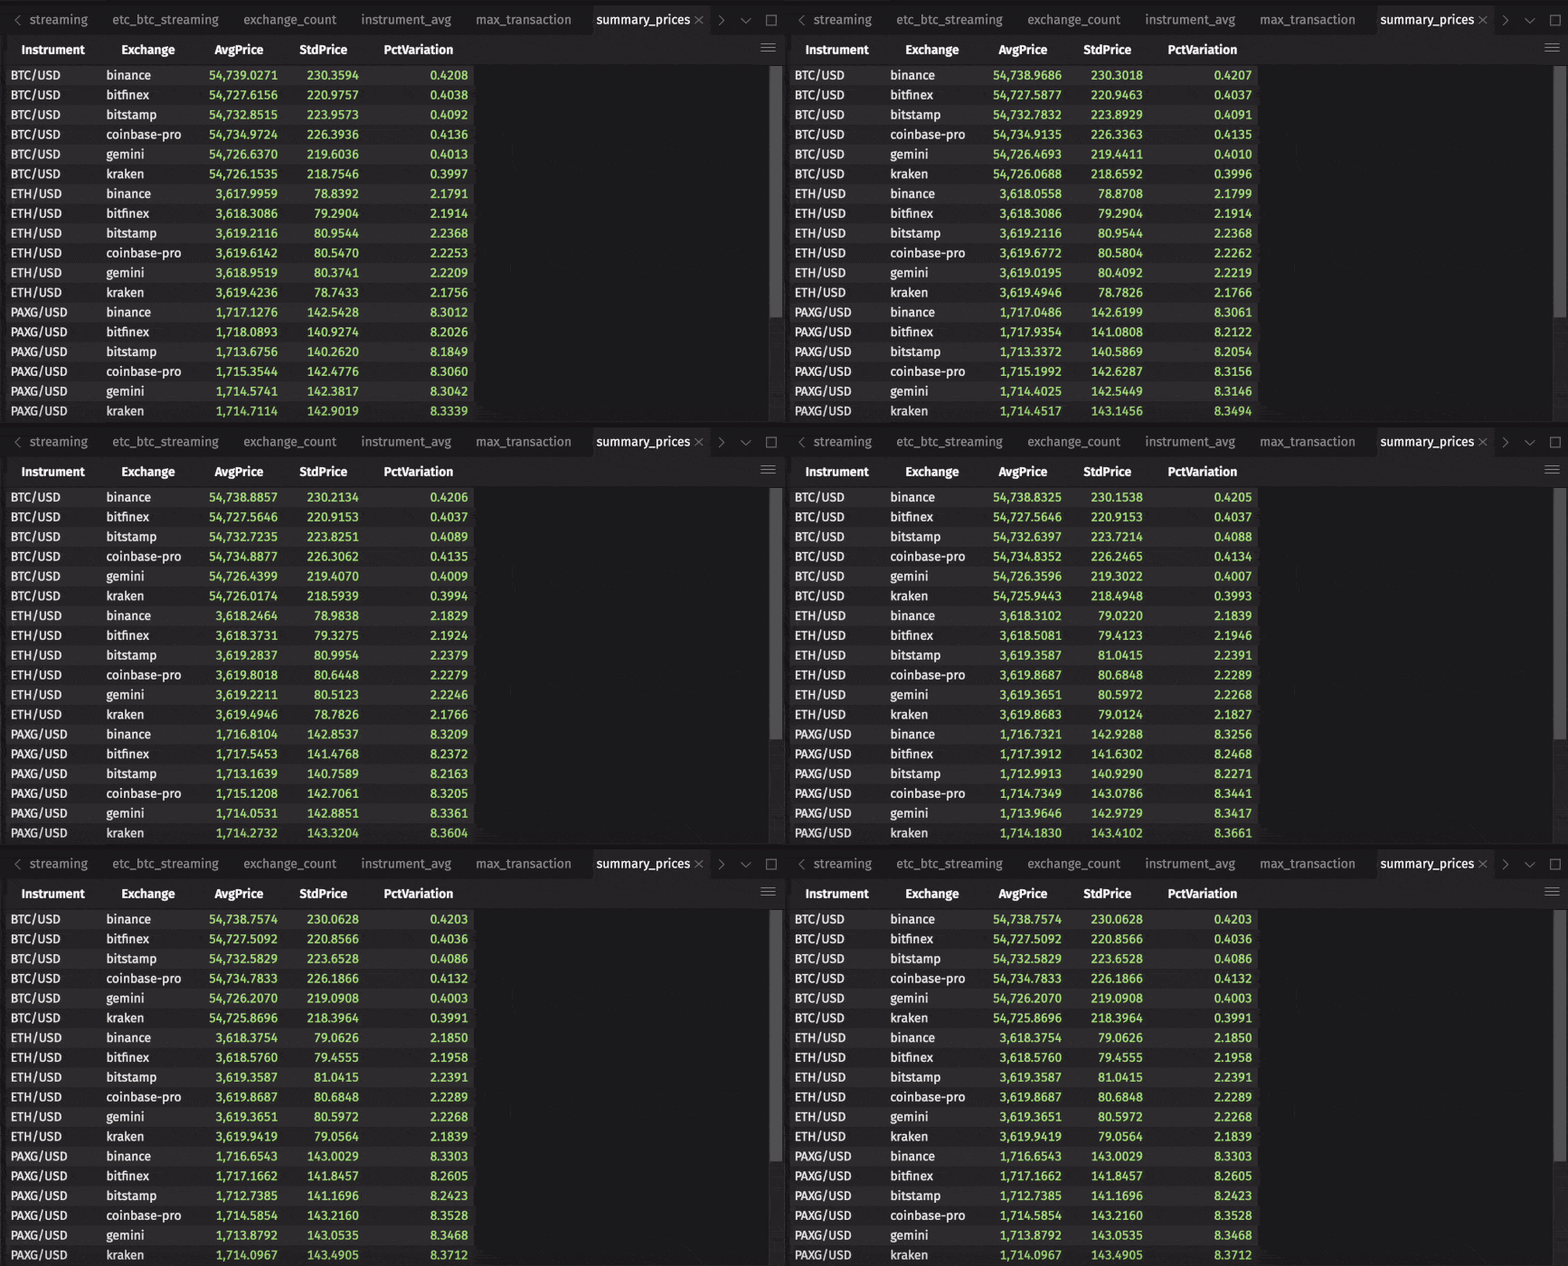
Then, add a column containing the coefficient of variation for each instrument and exchange, measuring the relative risk of each:
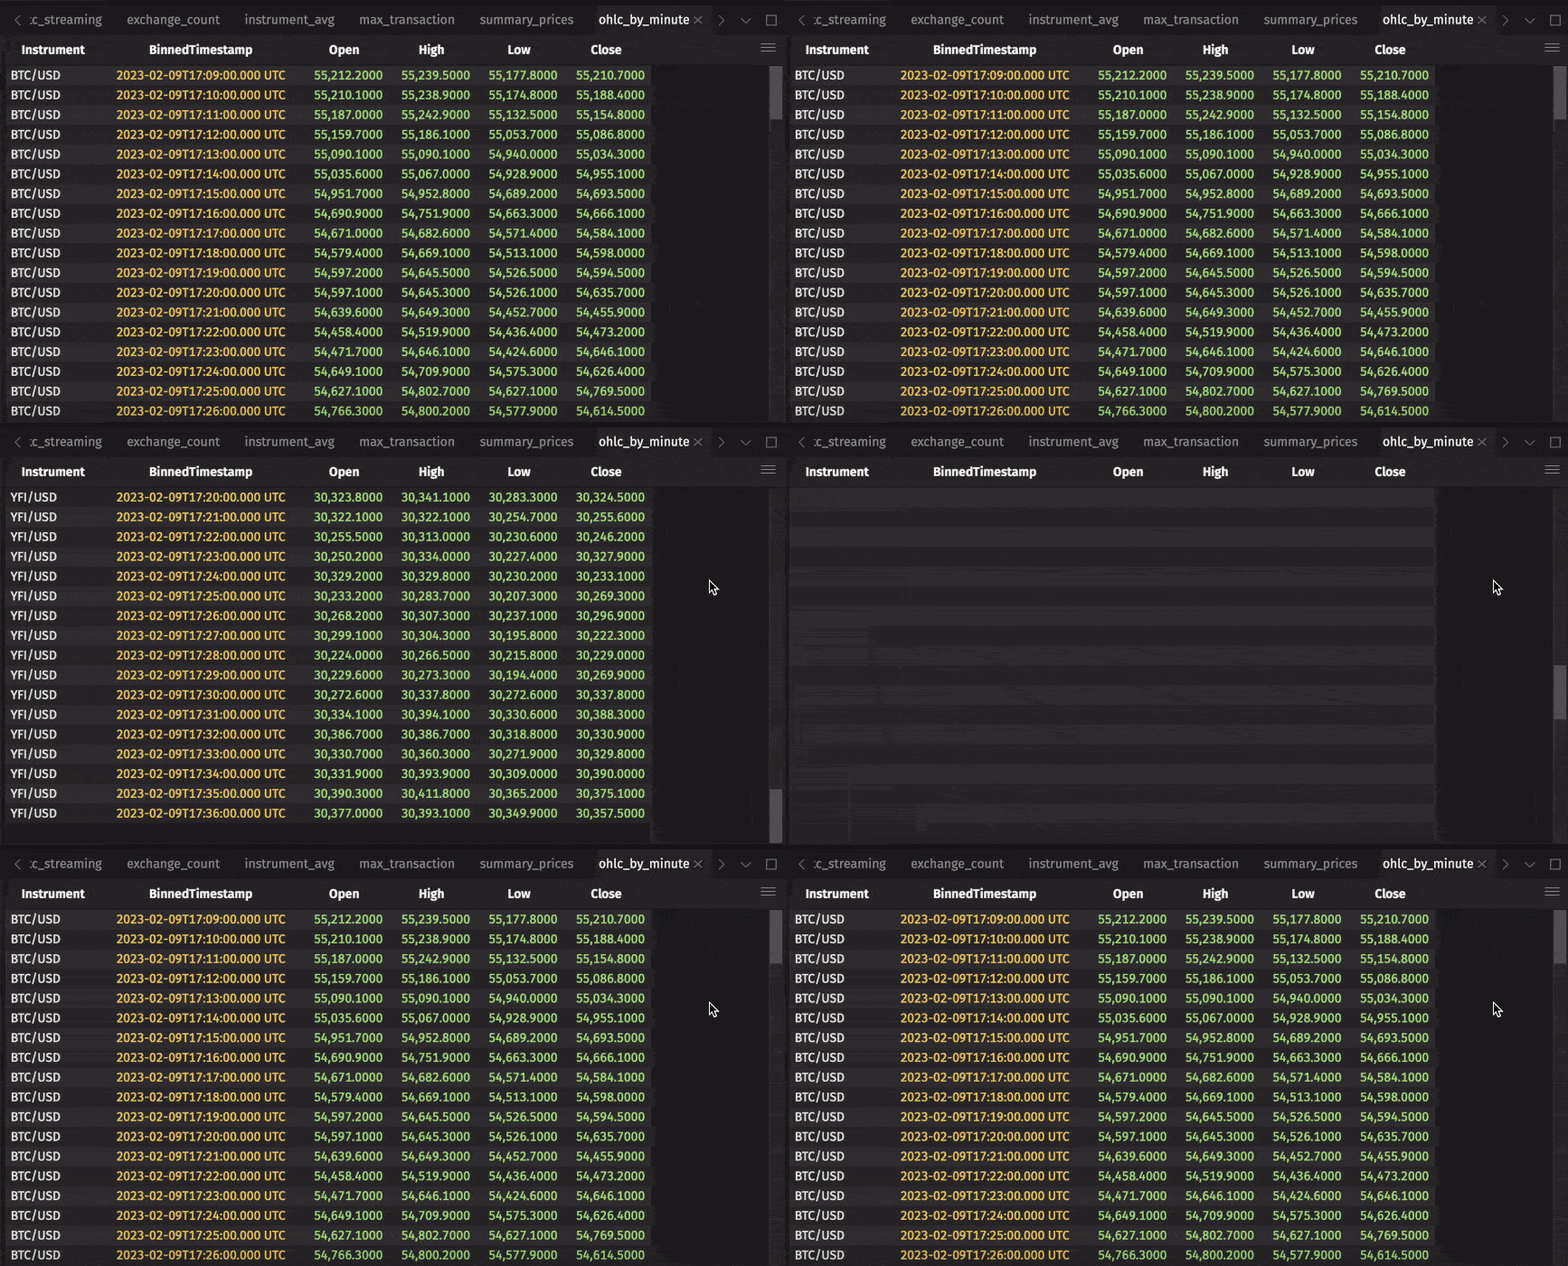
Finally, create a minute-by-minute Open-High-Low-Close table using the lowerBin built-in function along with AggFirst, AggMax, AggMin, and AggLast:
Window calculations
You may want to perform window-based calculations, compute moving or cumulative statistics, or look at pair-wise differences. Deephaven's updateBy table operation is the right tool for the job.
Compute the moving average and standard deviation of each instrument's price using rollingAvg and rollingStd:
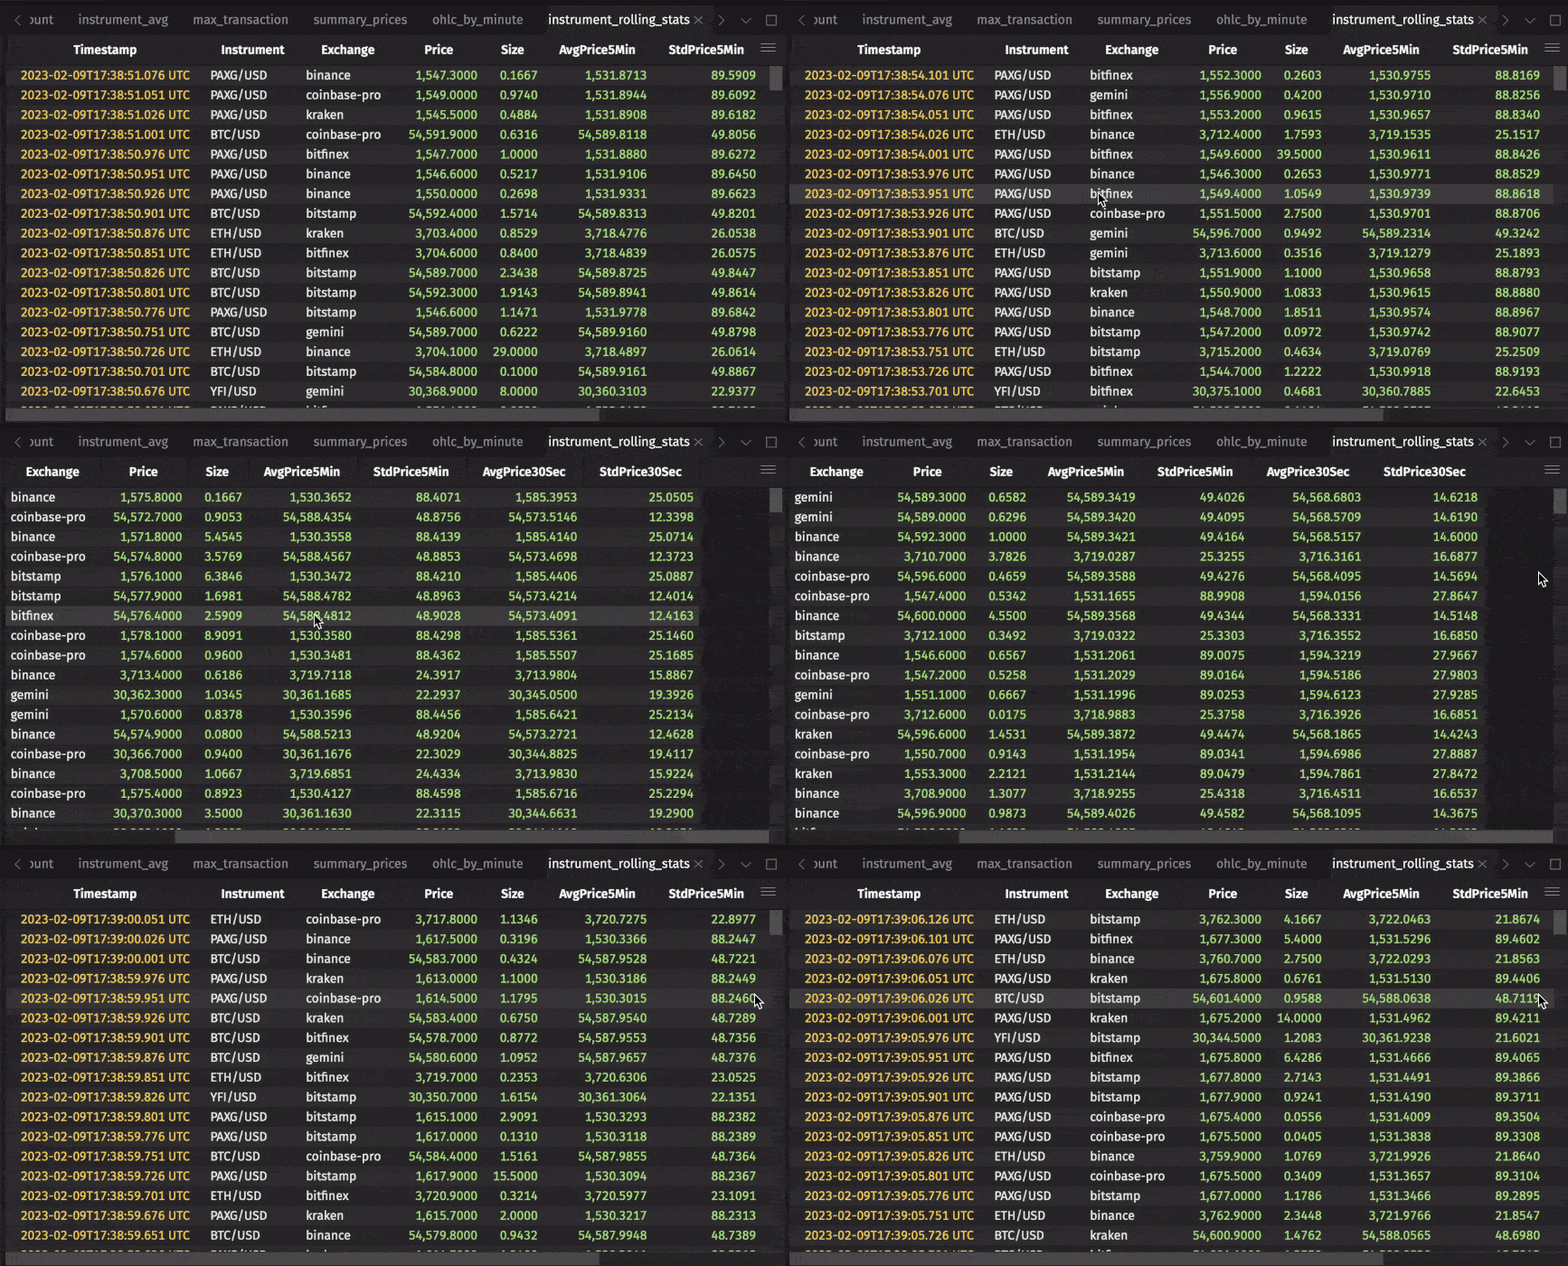
These statistics can be used to determine "extreme" instrument prices, where the instrument's price is significantly higher or lower than the rolling average over the window that ends at that row's timestamp:
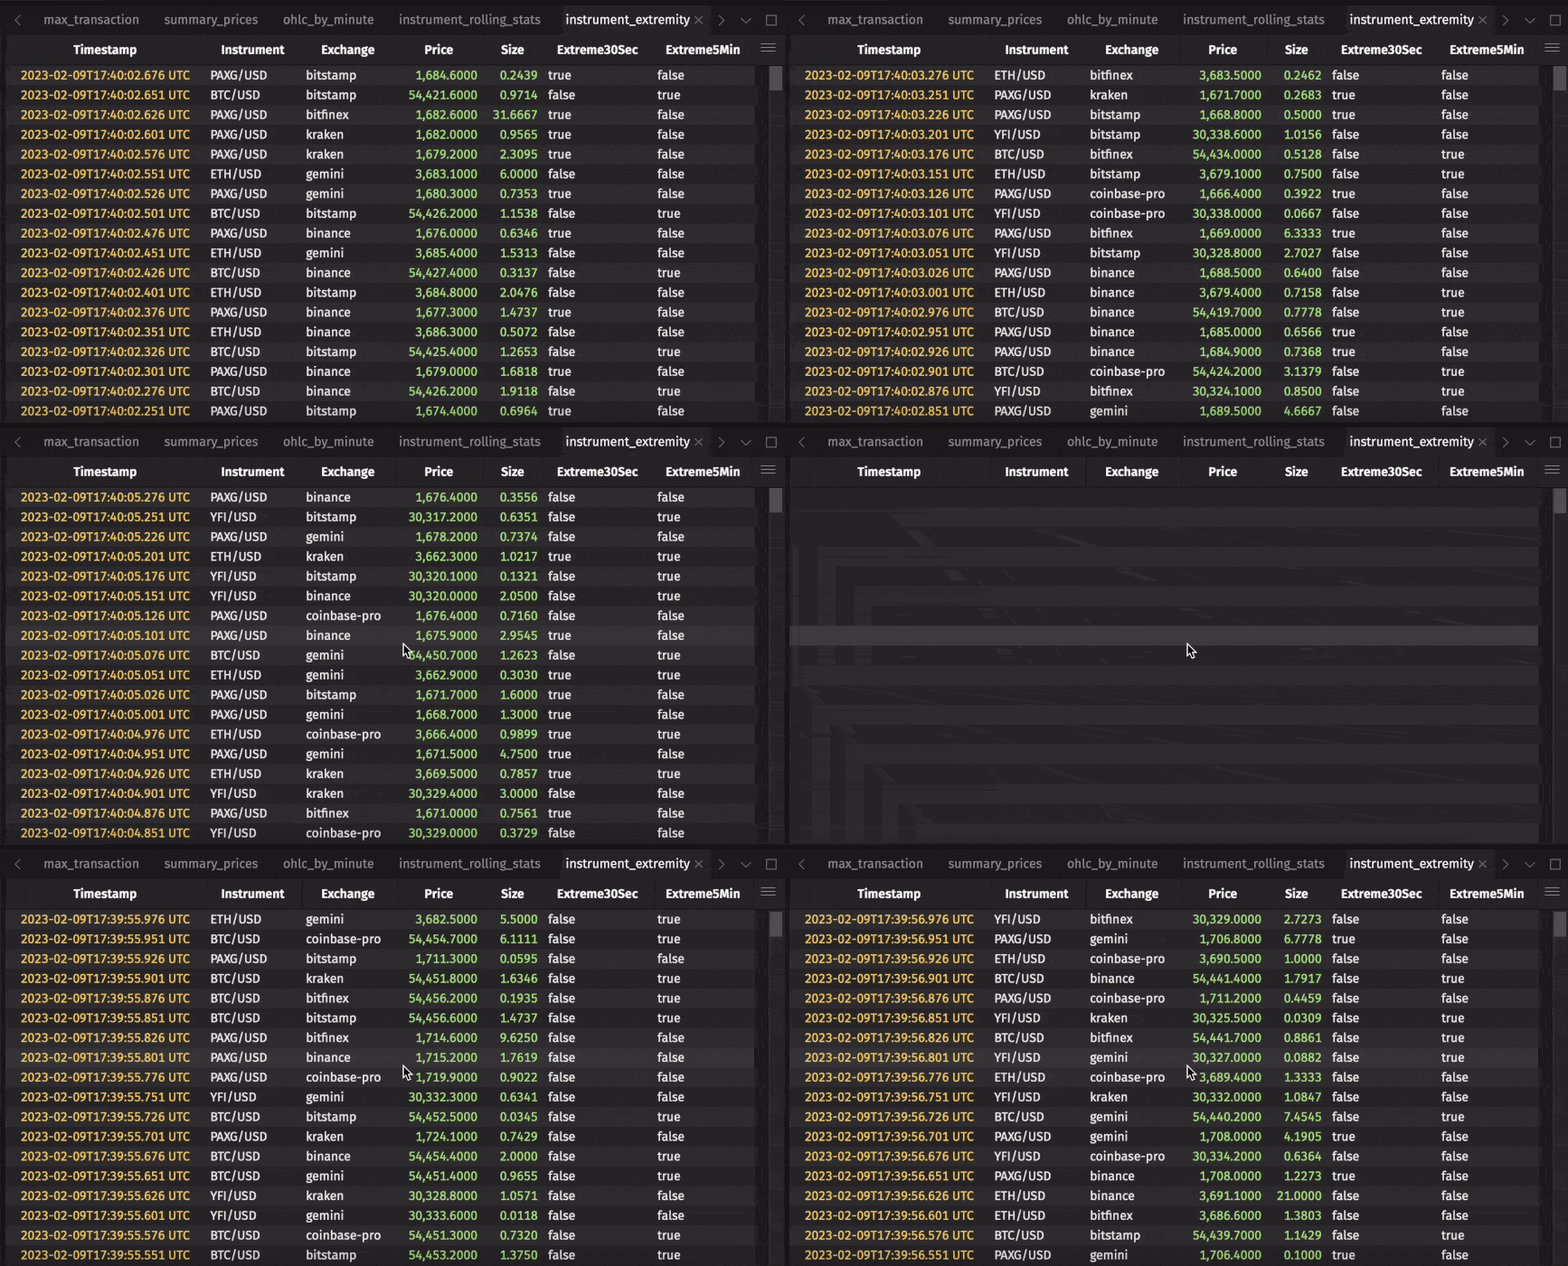
There's a lot more to updateBy. See the guide on rolling aggregations for more information.
Combining tables
Combining datasets can often yield powerful insights. Deephaven offers two primary ways to combine tables — the merge and join operations.
The merge operation stacks tables on top of one another. This is ideal when several tables have the same schema. They can be static, ticking, or a mix of both:
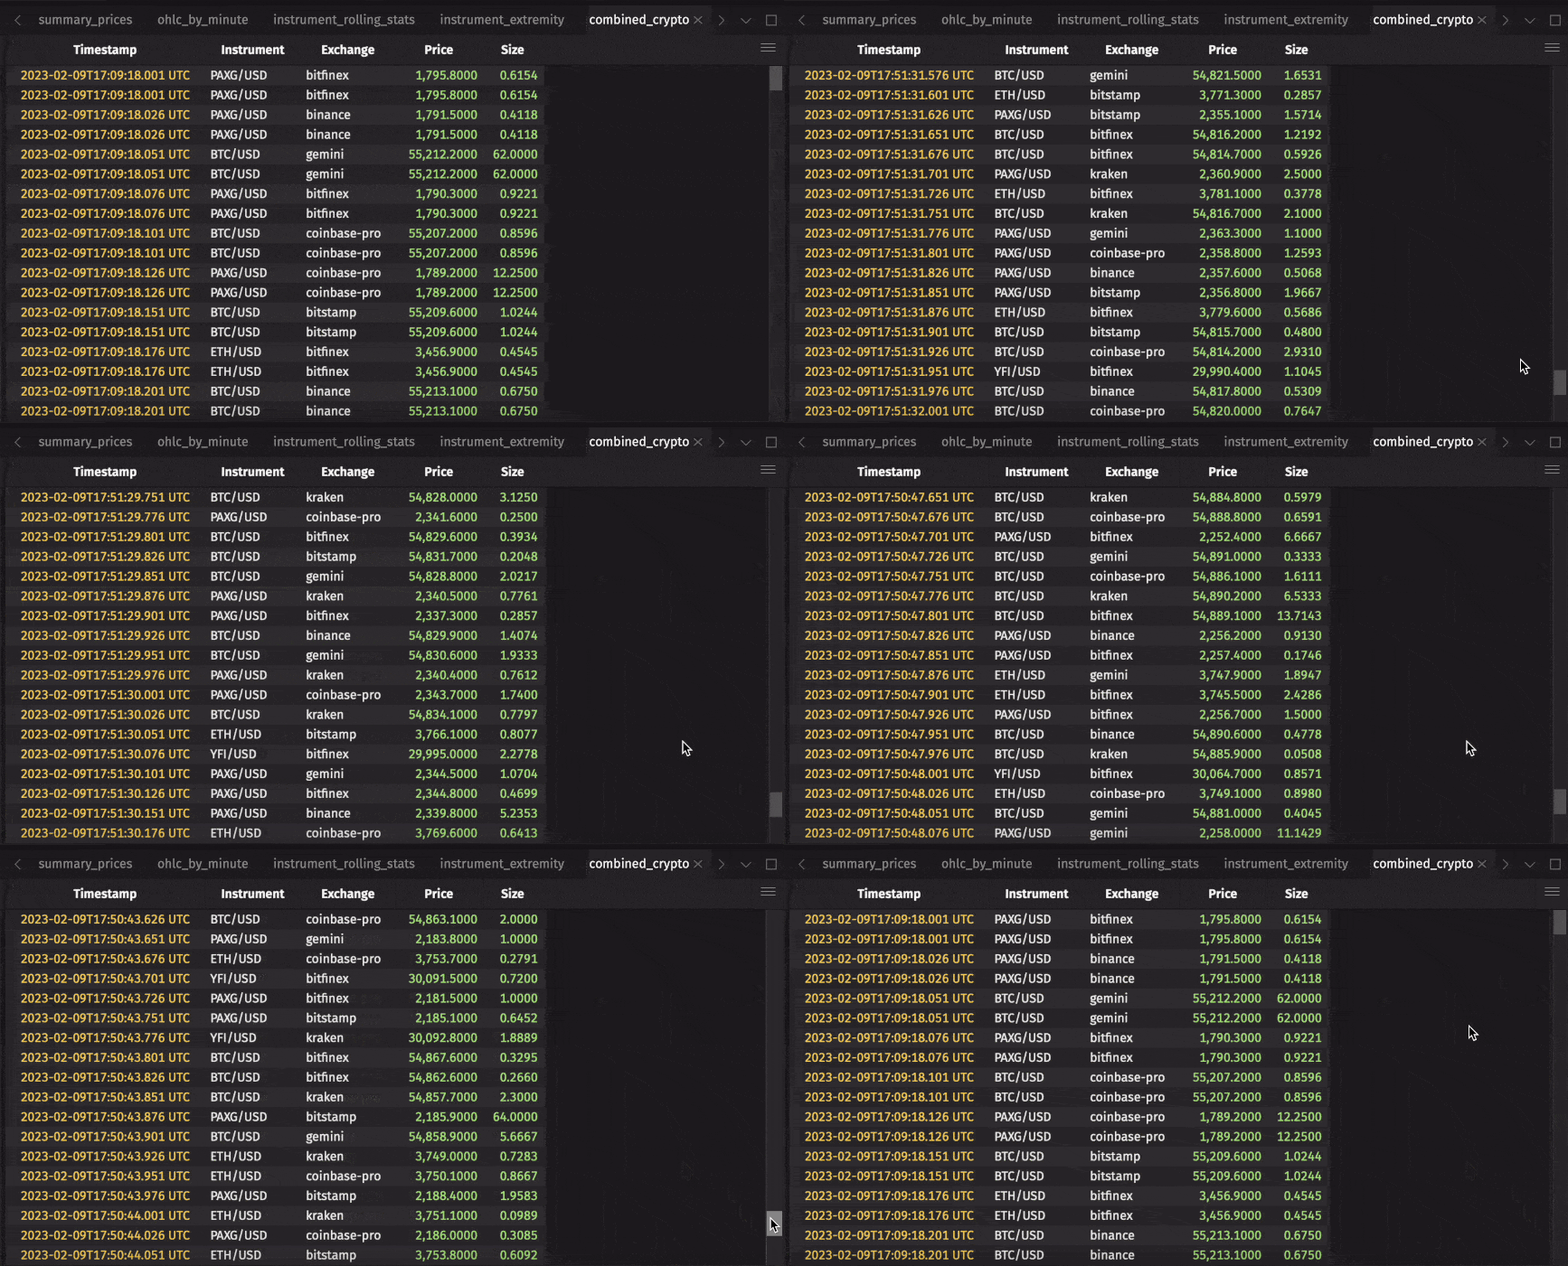
The ubiquitous join operation is used to combine tables based on columns that they have in common. Deephaven offers many variants of this operation such as join, naturalJoin, exactJoin, and many more.
For example, summarize the older September 2021 trades in cryptoFromCsv, the table you loaded at the start of this guide. Then, use join to combine the aggregated prices to see how current prices compare to those in the past:
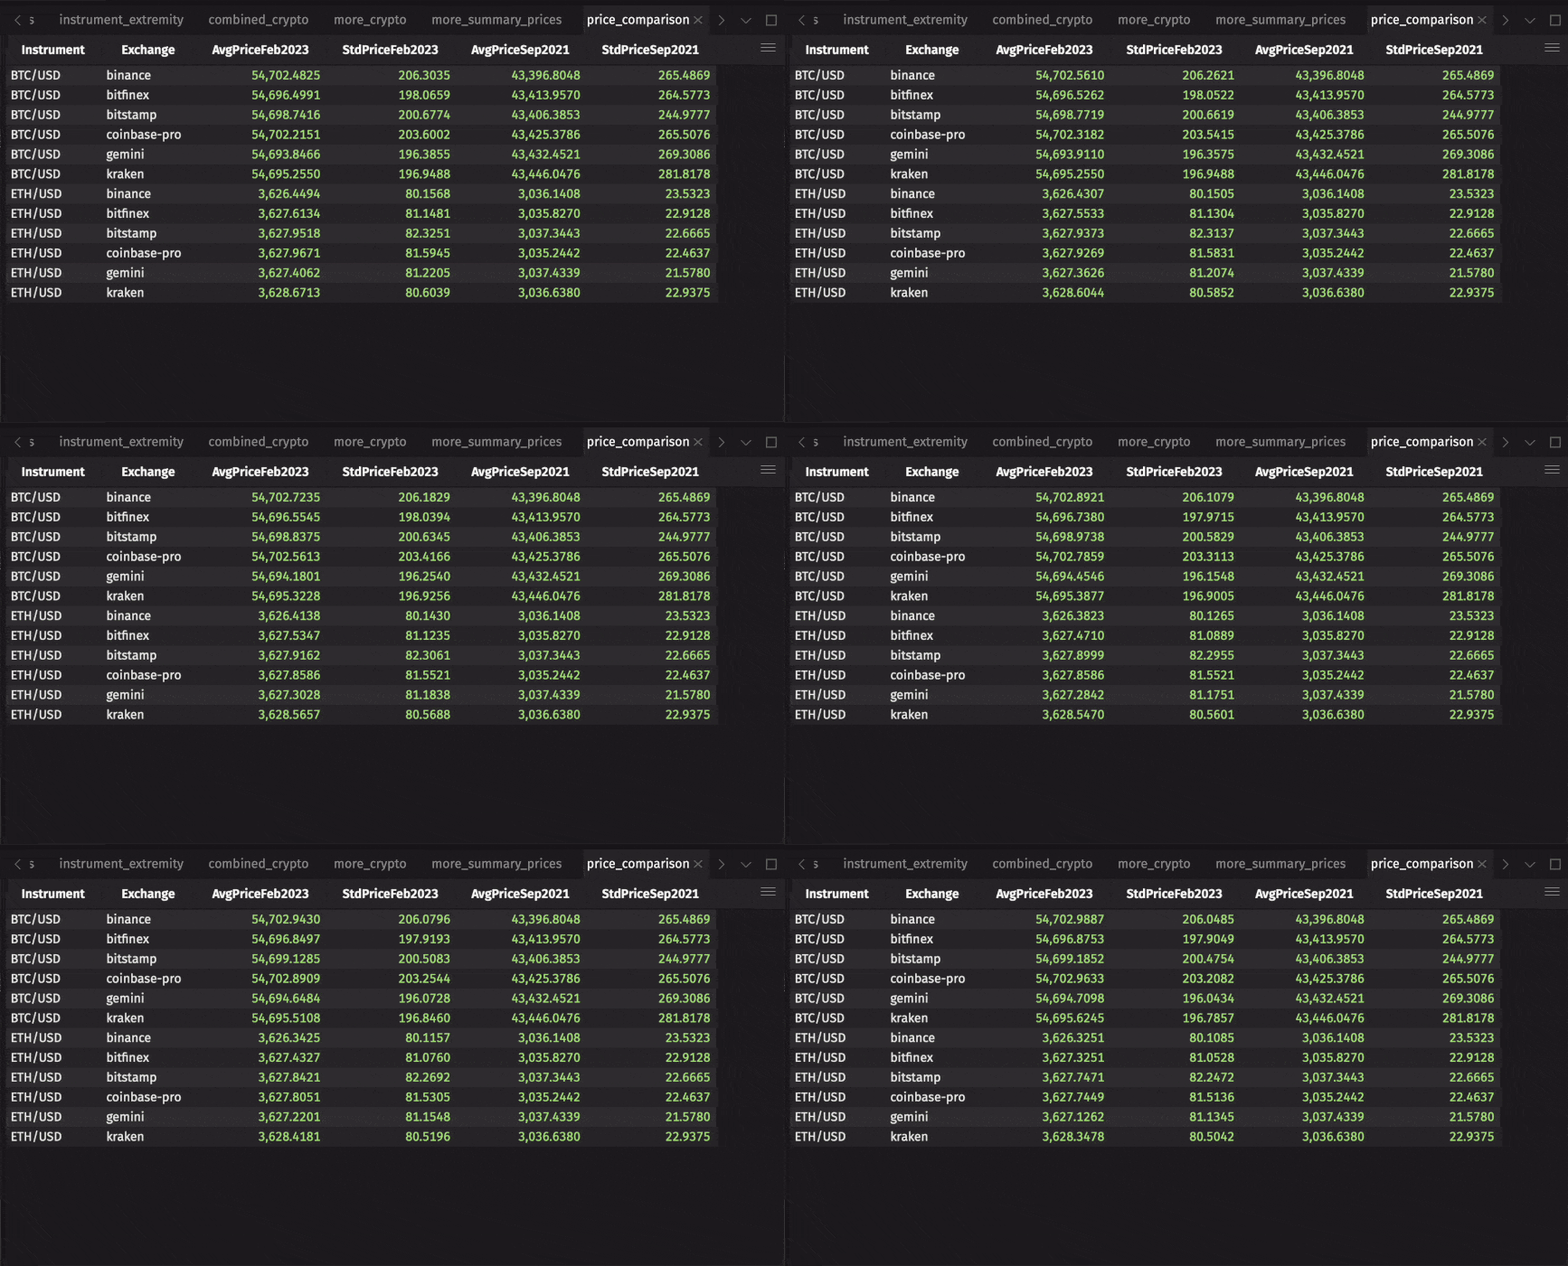
In many real-time data applications, data needs to be combined based on timestamps. Traditional join operations often fail this task, as they require exact matches in both datasets. To remedy this, Deephaven provides time series joins, such as aj and raj, that can join tables on timestamps with approximate matches.
Here's an example where aj is used to find the Ethereum price at or immediately preceding a Bitcoin price:
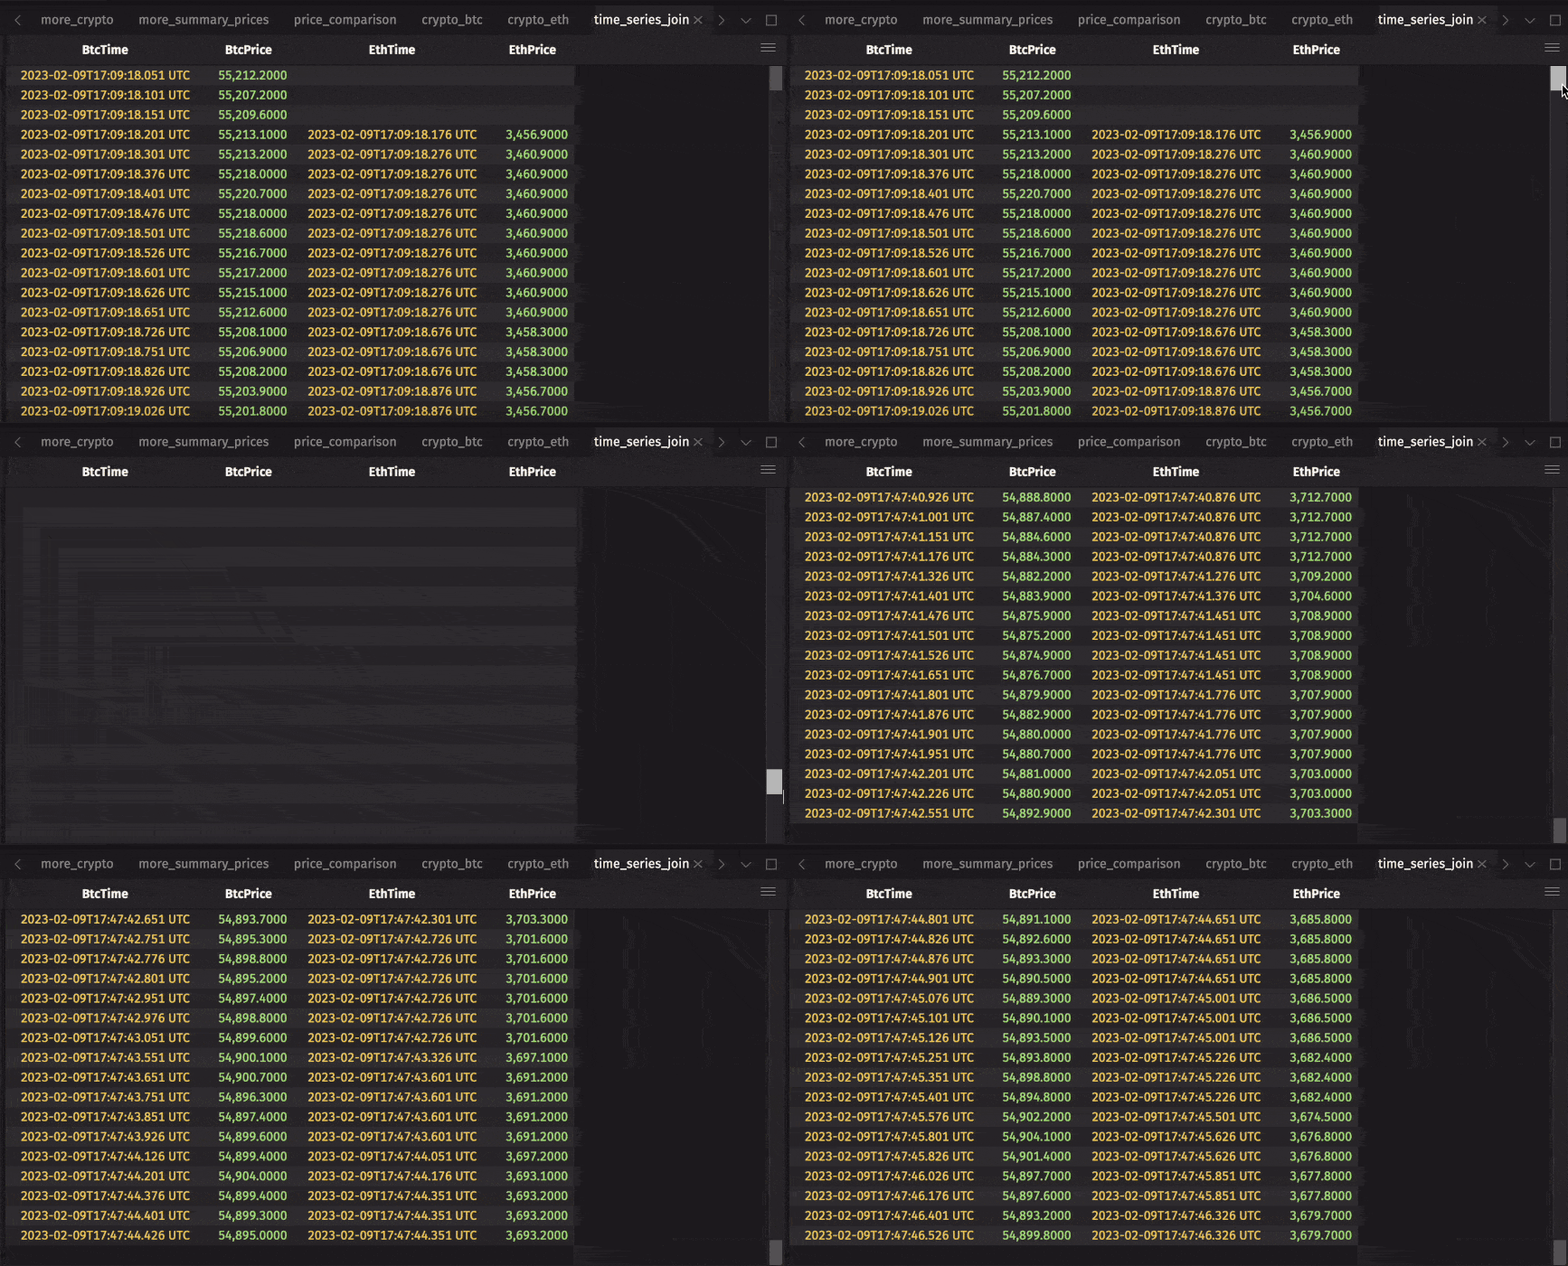
To learn more about Deephaven's join methods, see the guides on exact and relational joins and time-series and range joins.
5. Plot data via query or the UI
Deephaven has a rich plotting API that supports updating, real-time plots. It can be called programmatically:
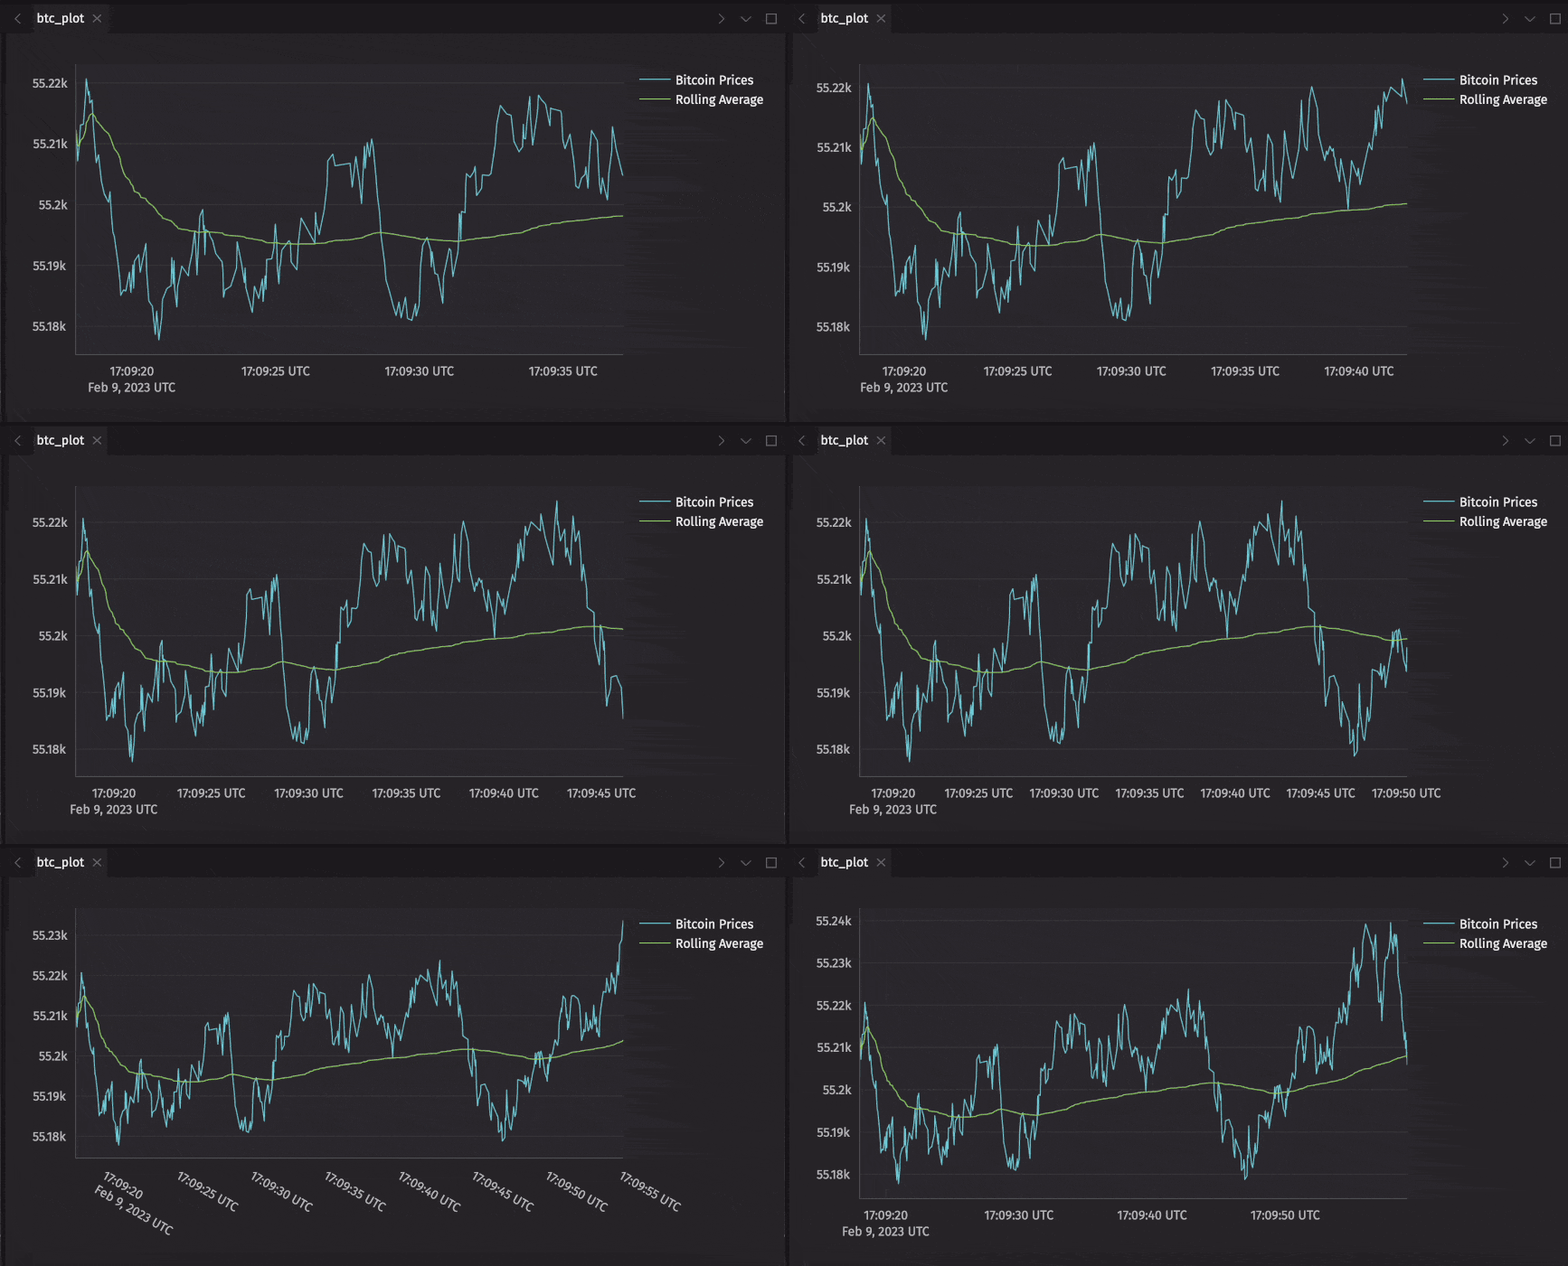
Or with the web UI:
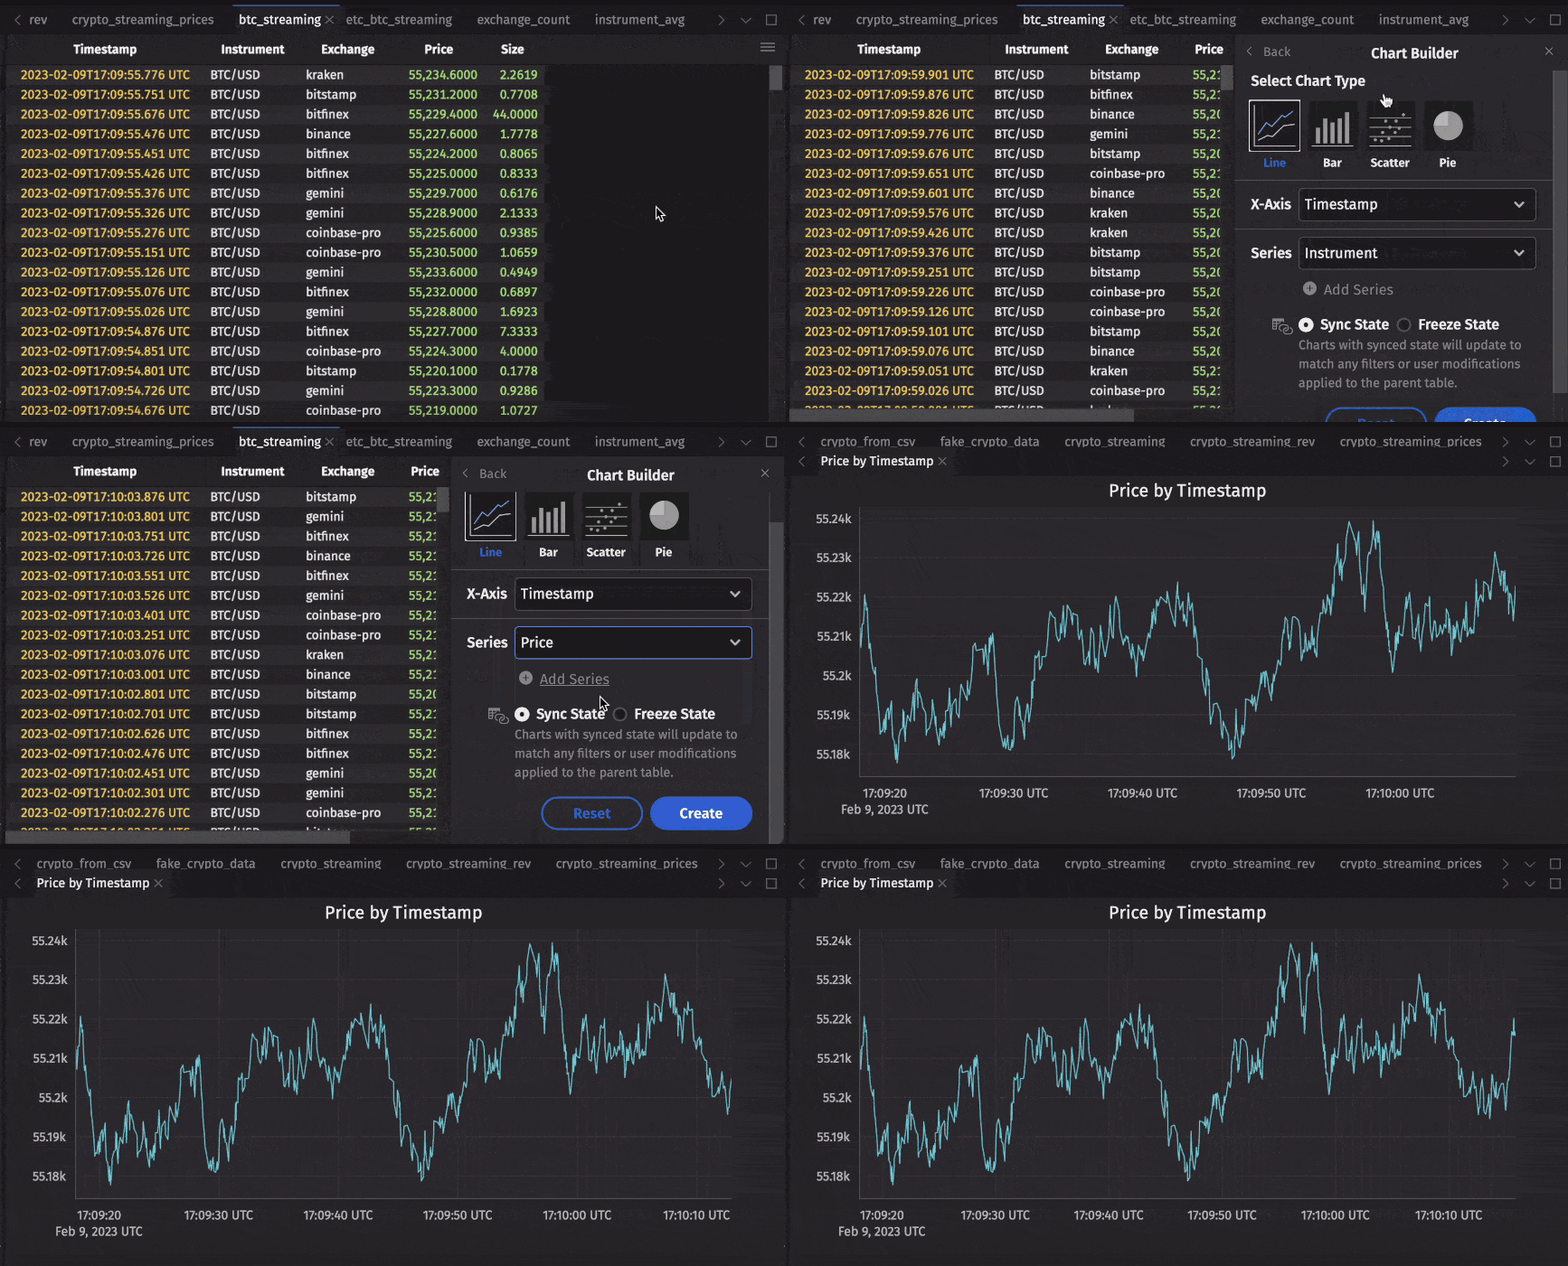
6. Export data to popular formats
You can export your data from Deephaven to popular open formats.
To export a table to a CSV file, use the writeCsv method with the table and the path where you want to save the file. The examples below write to /data, the data directory in the Deephaven Docker image. If you started Deephaven with the Docker command above, the files appear in the data folder of the directory where you ran it. See the guide on Docker data volumes to learn more about how Deephaven uses volumes. If you run Deephaven natively from the tar file, replace /data with a directory on your machine that you can write to.
Similarly, use writeTable to export a Parquet file:
If a table is ticking, each exported file captures the table's state at the moment the script runs.
7. What to do next
Now that you've imported data, created tables, and manipulated static and real-time data, we suggest heading to the Crash Course in Deephaven for a more in-depth introduction to Deephaven's design and APIs.
To go further with the topics in this guide, see: