Real-time Plots
Whether your data is static or updating in real time, Deephaven supports plotting in Groovy via multiple its built-in plot package.
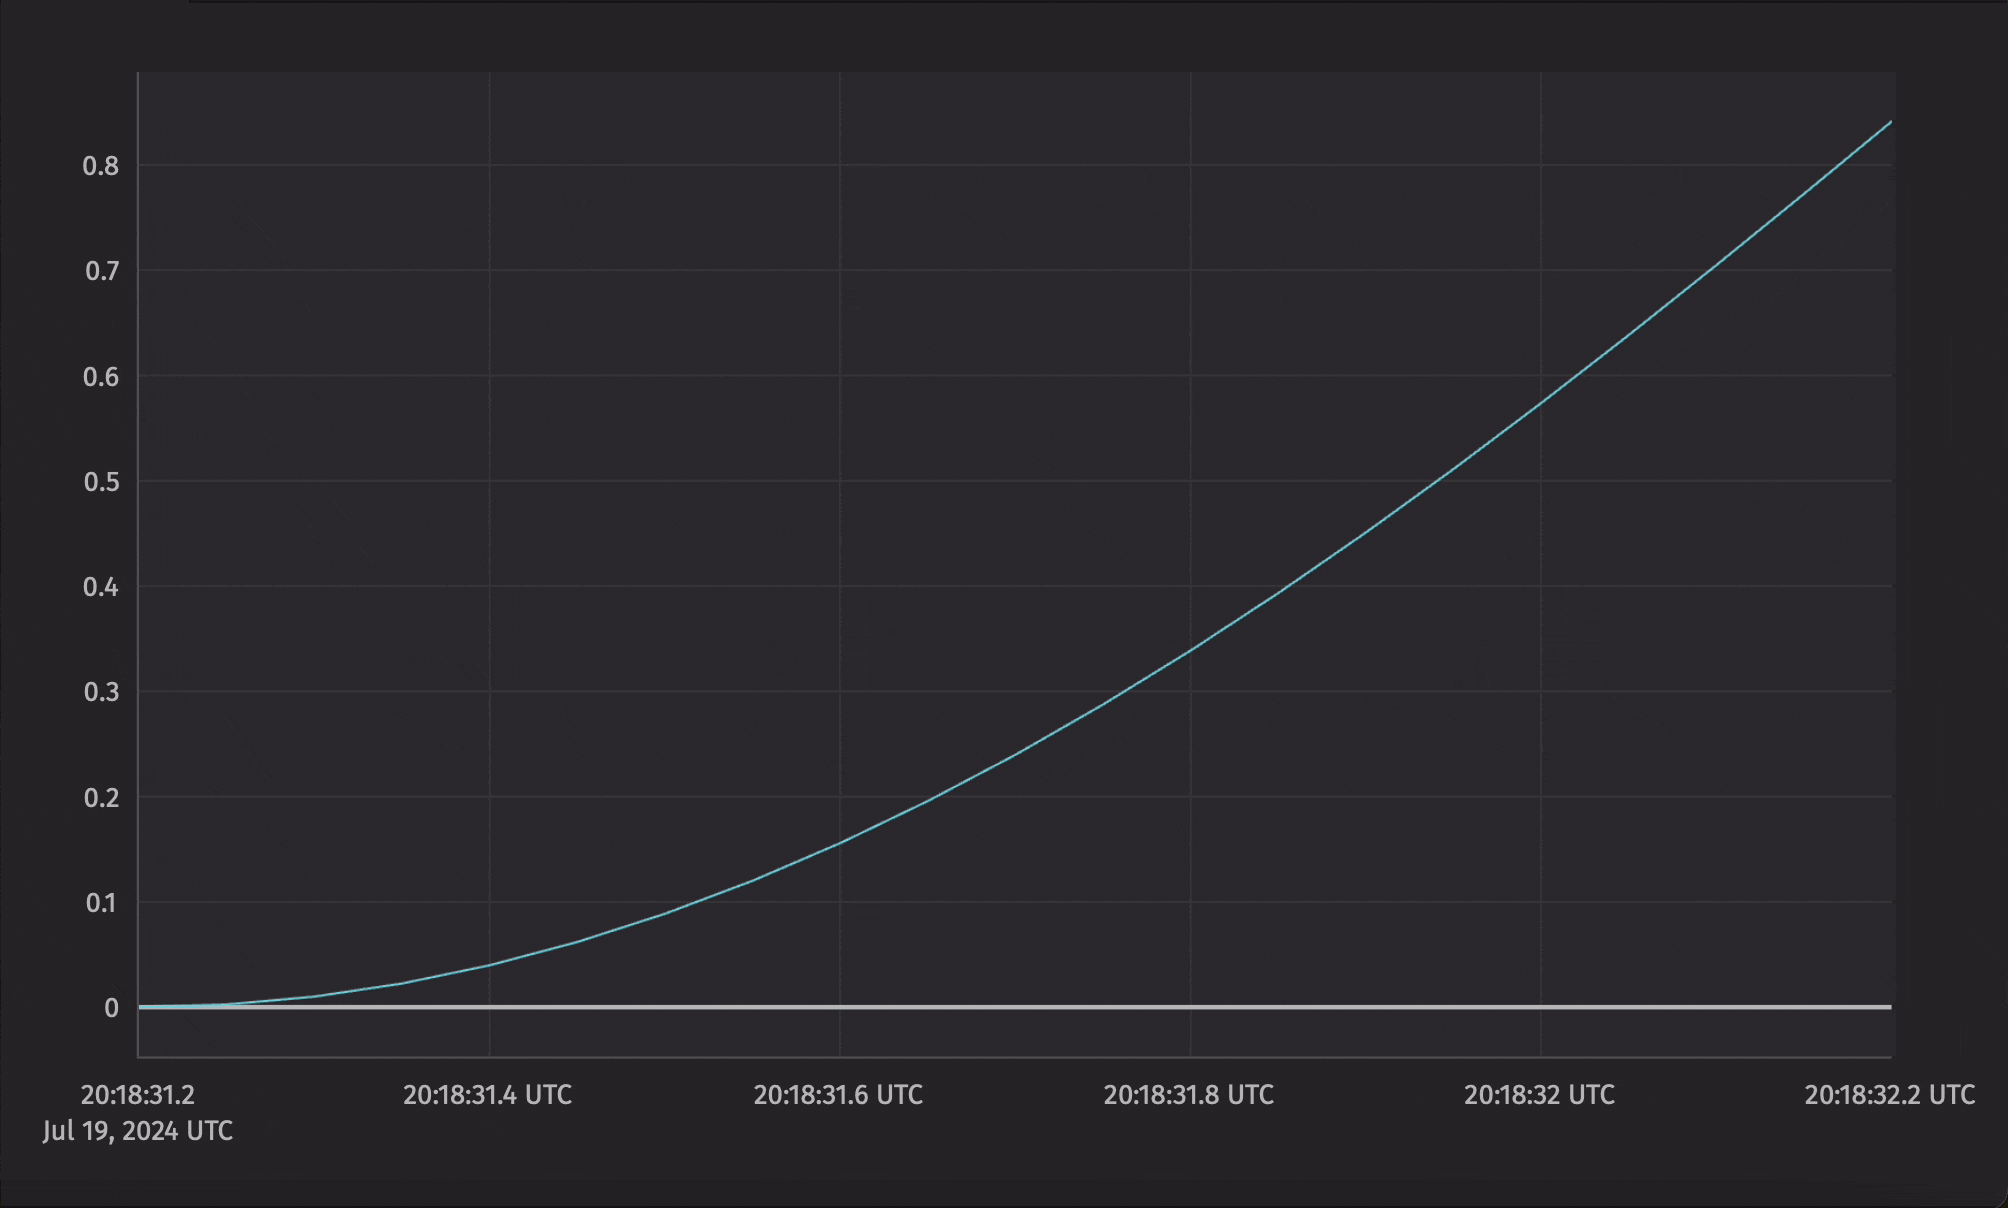
Basic plots
Deephaven's native plotting library supports many common plot types. To create a simple line plot that ticks in lock-step with the source table:
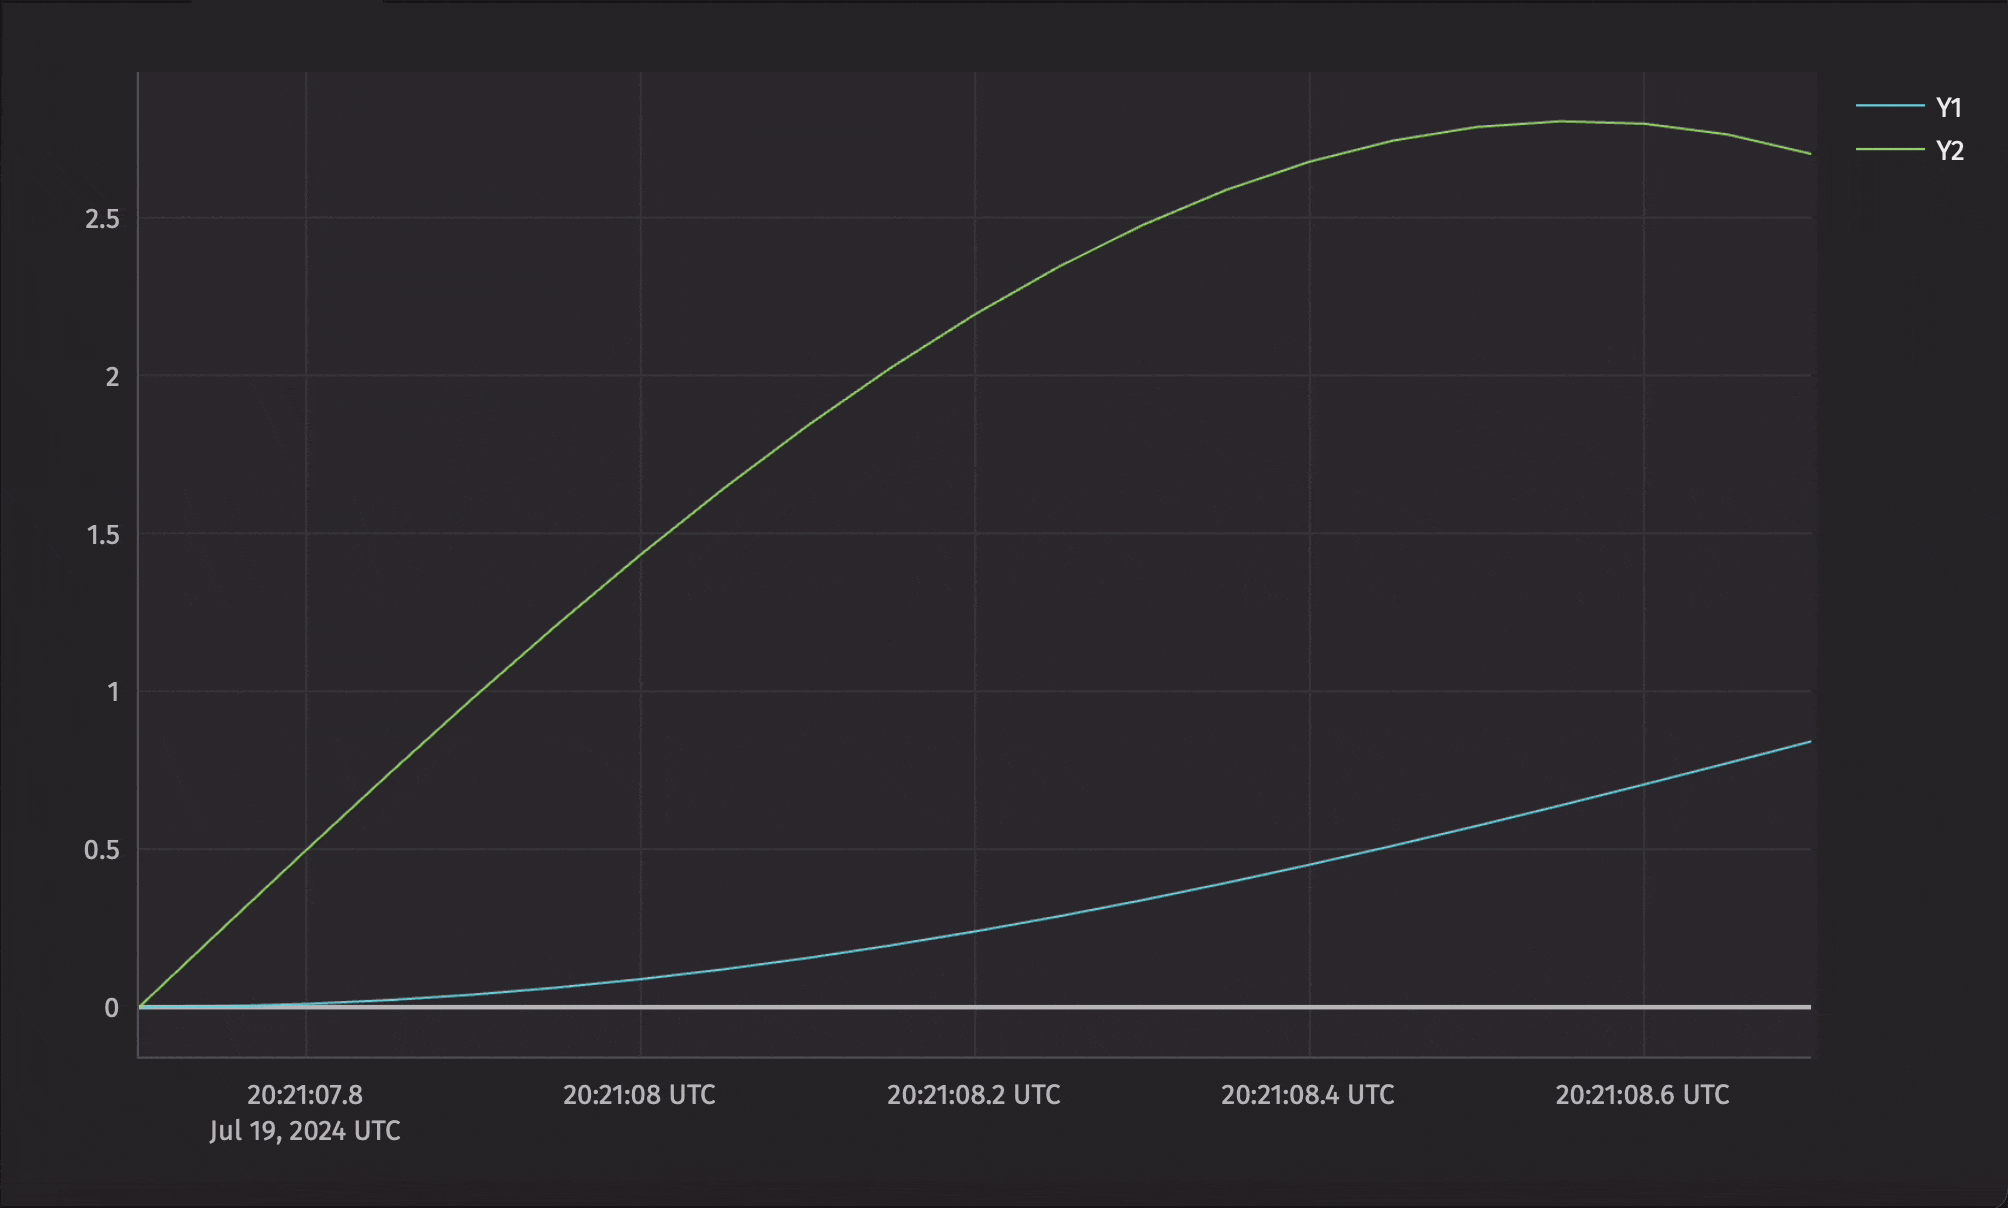
Multiple series can be plotted together in the same figure.
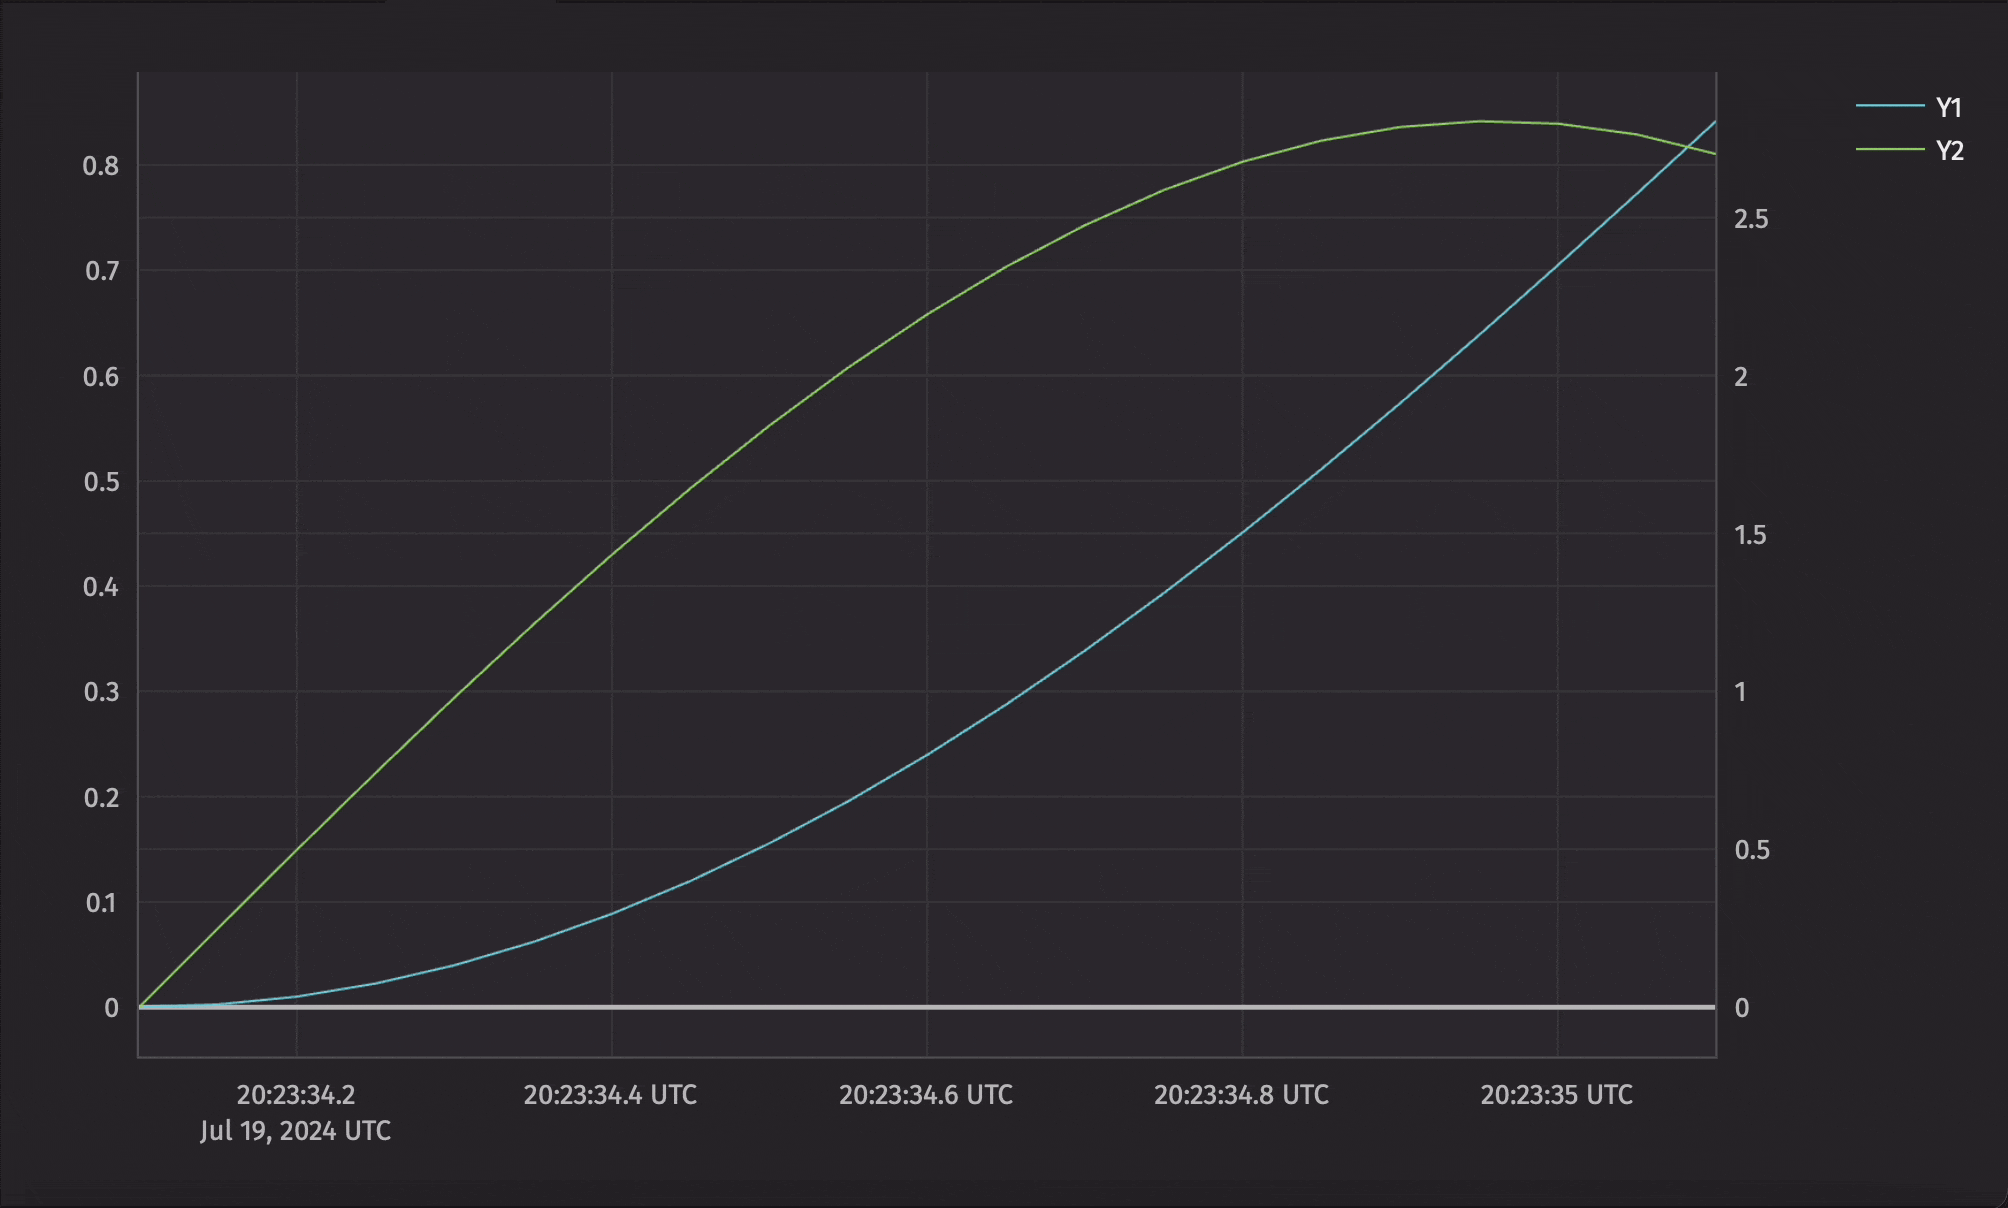
Plots with multiple axes
twinX and twinY allow you to create plots with multiple x or y axes. For example, you can use twinX to create a plot with two different y axes but a shared x axis.
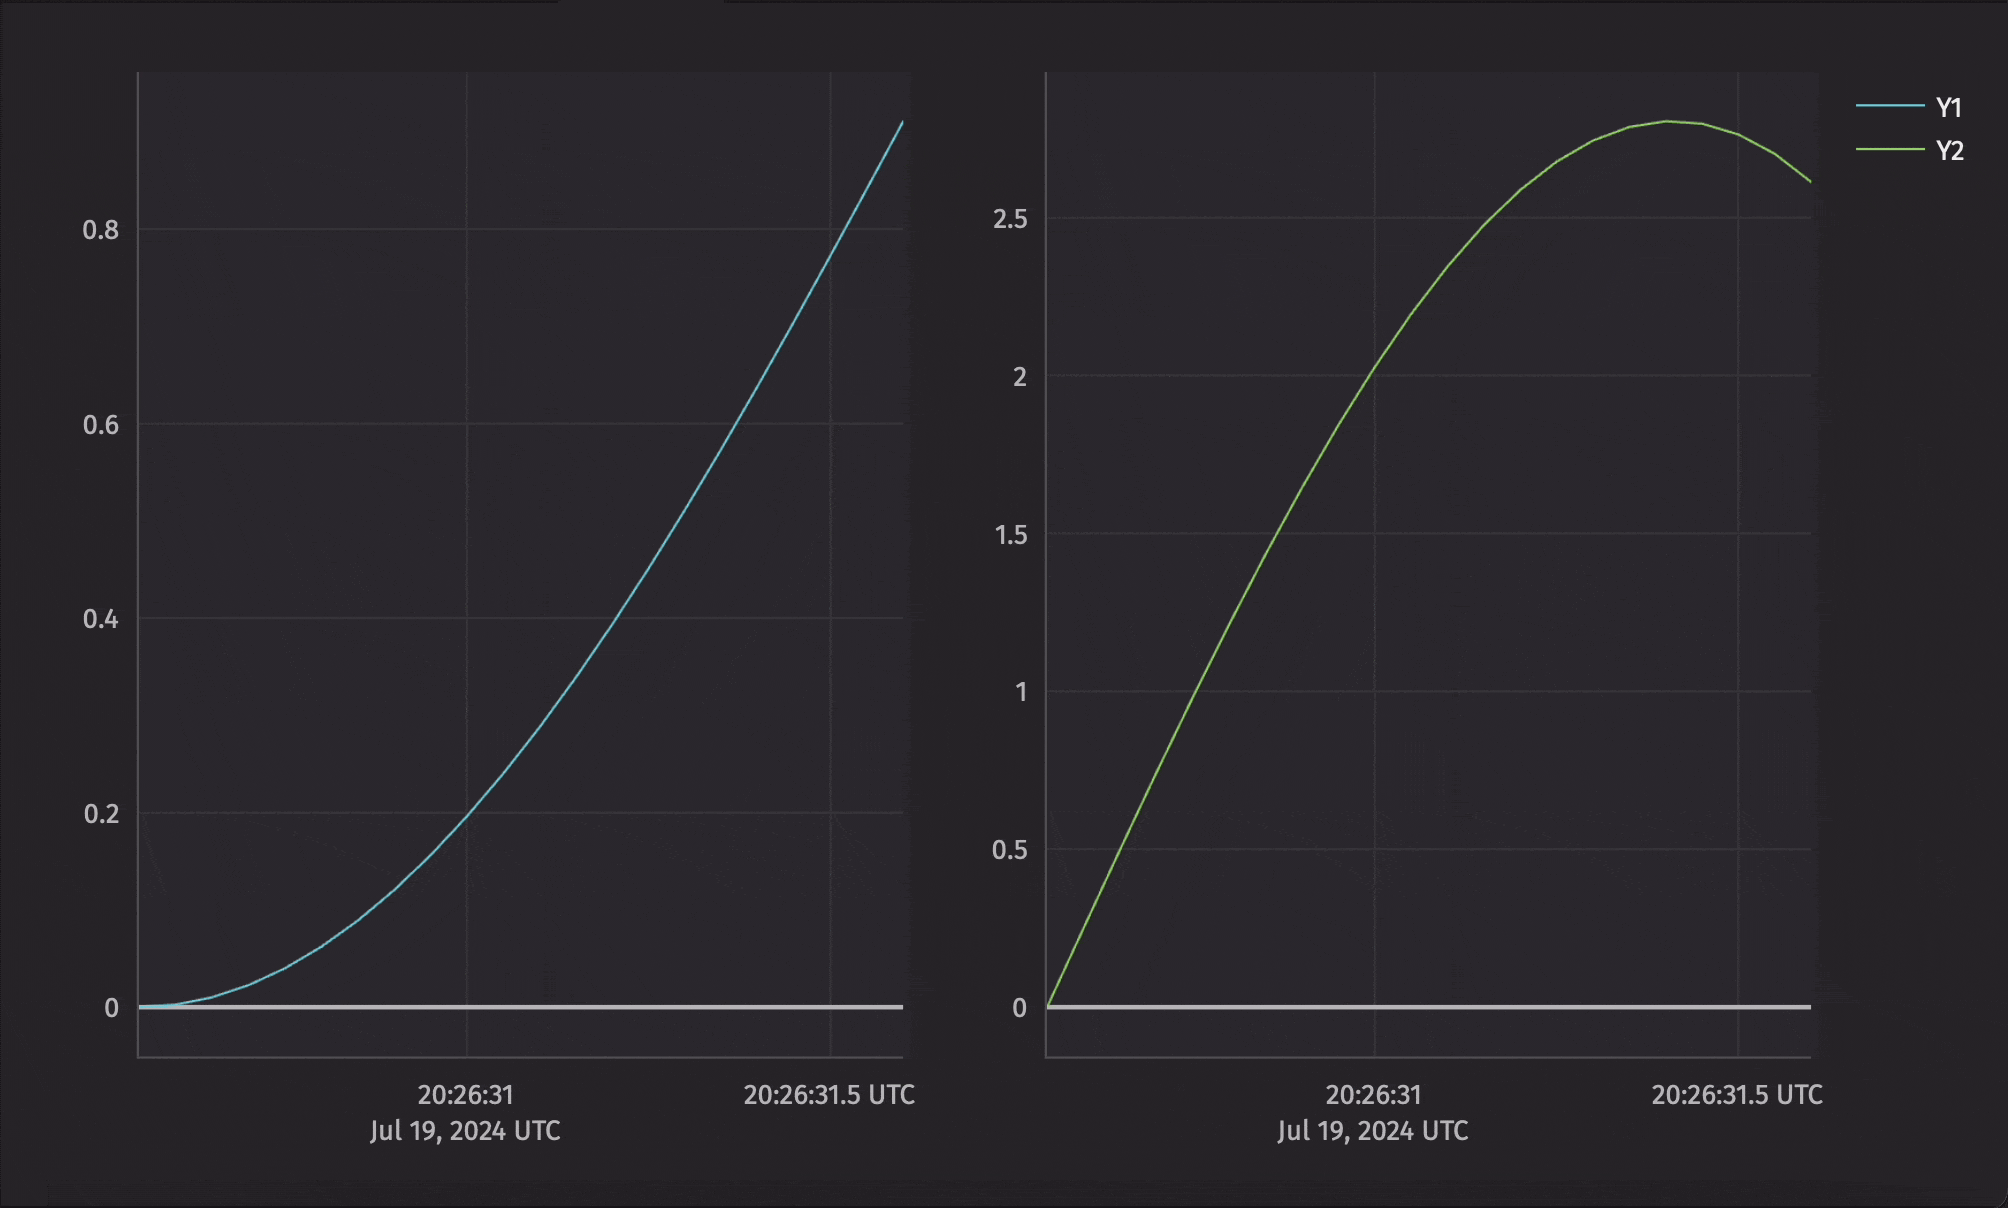
Subplots
Figures can also contain more than just one plot. For instance, a single figure could contain two plots stacked on top of one another, side by side, four plots in a 2x2 grid, and so on. These subplots are arranged into a grid, and then placed into specific locations in the grid with newChart.
The example below creates a figure with two subplots side-by-side.
Far more plots are available, including histograms, pie charts, scatter plots, and more.