Debug Docker-run Deephaven with IntelliJ IDEA
This guide shows you how to connect IntelliJ IDEA's remote debugger to Deephaven running in a Docker container.
When Deephaven runs in Docker, the engine and user code execute inside a Docker container. Debugging uses JDWP (Java Debug Wire Protocol), which is built into the JVM. You expose the debug port from the container and connect IntelliJ IDEA to it.
Both IntelliJ IDEA Community and Ultimate editions support remote JVM debugging.
1. Configure Docker for debugging
To enable JDWP, make two changes to your docker-compose.yml:
- Expose the debug port (5005) from the container.
- Add the
-agentlib:jdwpJVM option toSTART_OPTS.
The following docker-compose.yml includes both changes:
Note
START_OPTS should only appear once in the environment section, but can include multiple JVM options.
Warning
Anonymous authentication is required for this setup. The -DAuthHandlers setting above enables it.
The -agentlib:jdwp sub-options used here:
server=y— the JVM listens for debugger connections (rather than connecting to a debugger).suspend=n— the JVM starts immediately without waiting for a debugger to connect. Set toyto pause startup until a debugger attaches, which is useful for debugging initialization issues.address=*:5005— listen on port 5005 on all network interfaces. The*:prefix is required when the JVM is inside Docker, so that connections from outside the container are accepted.
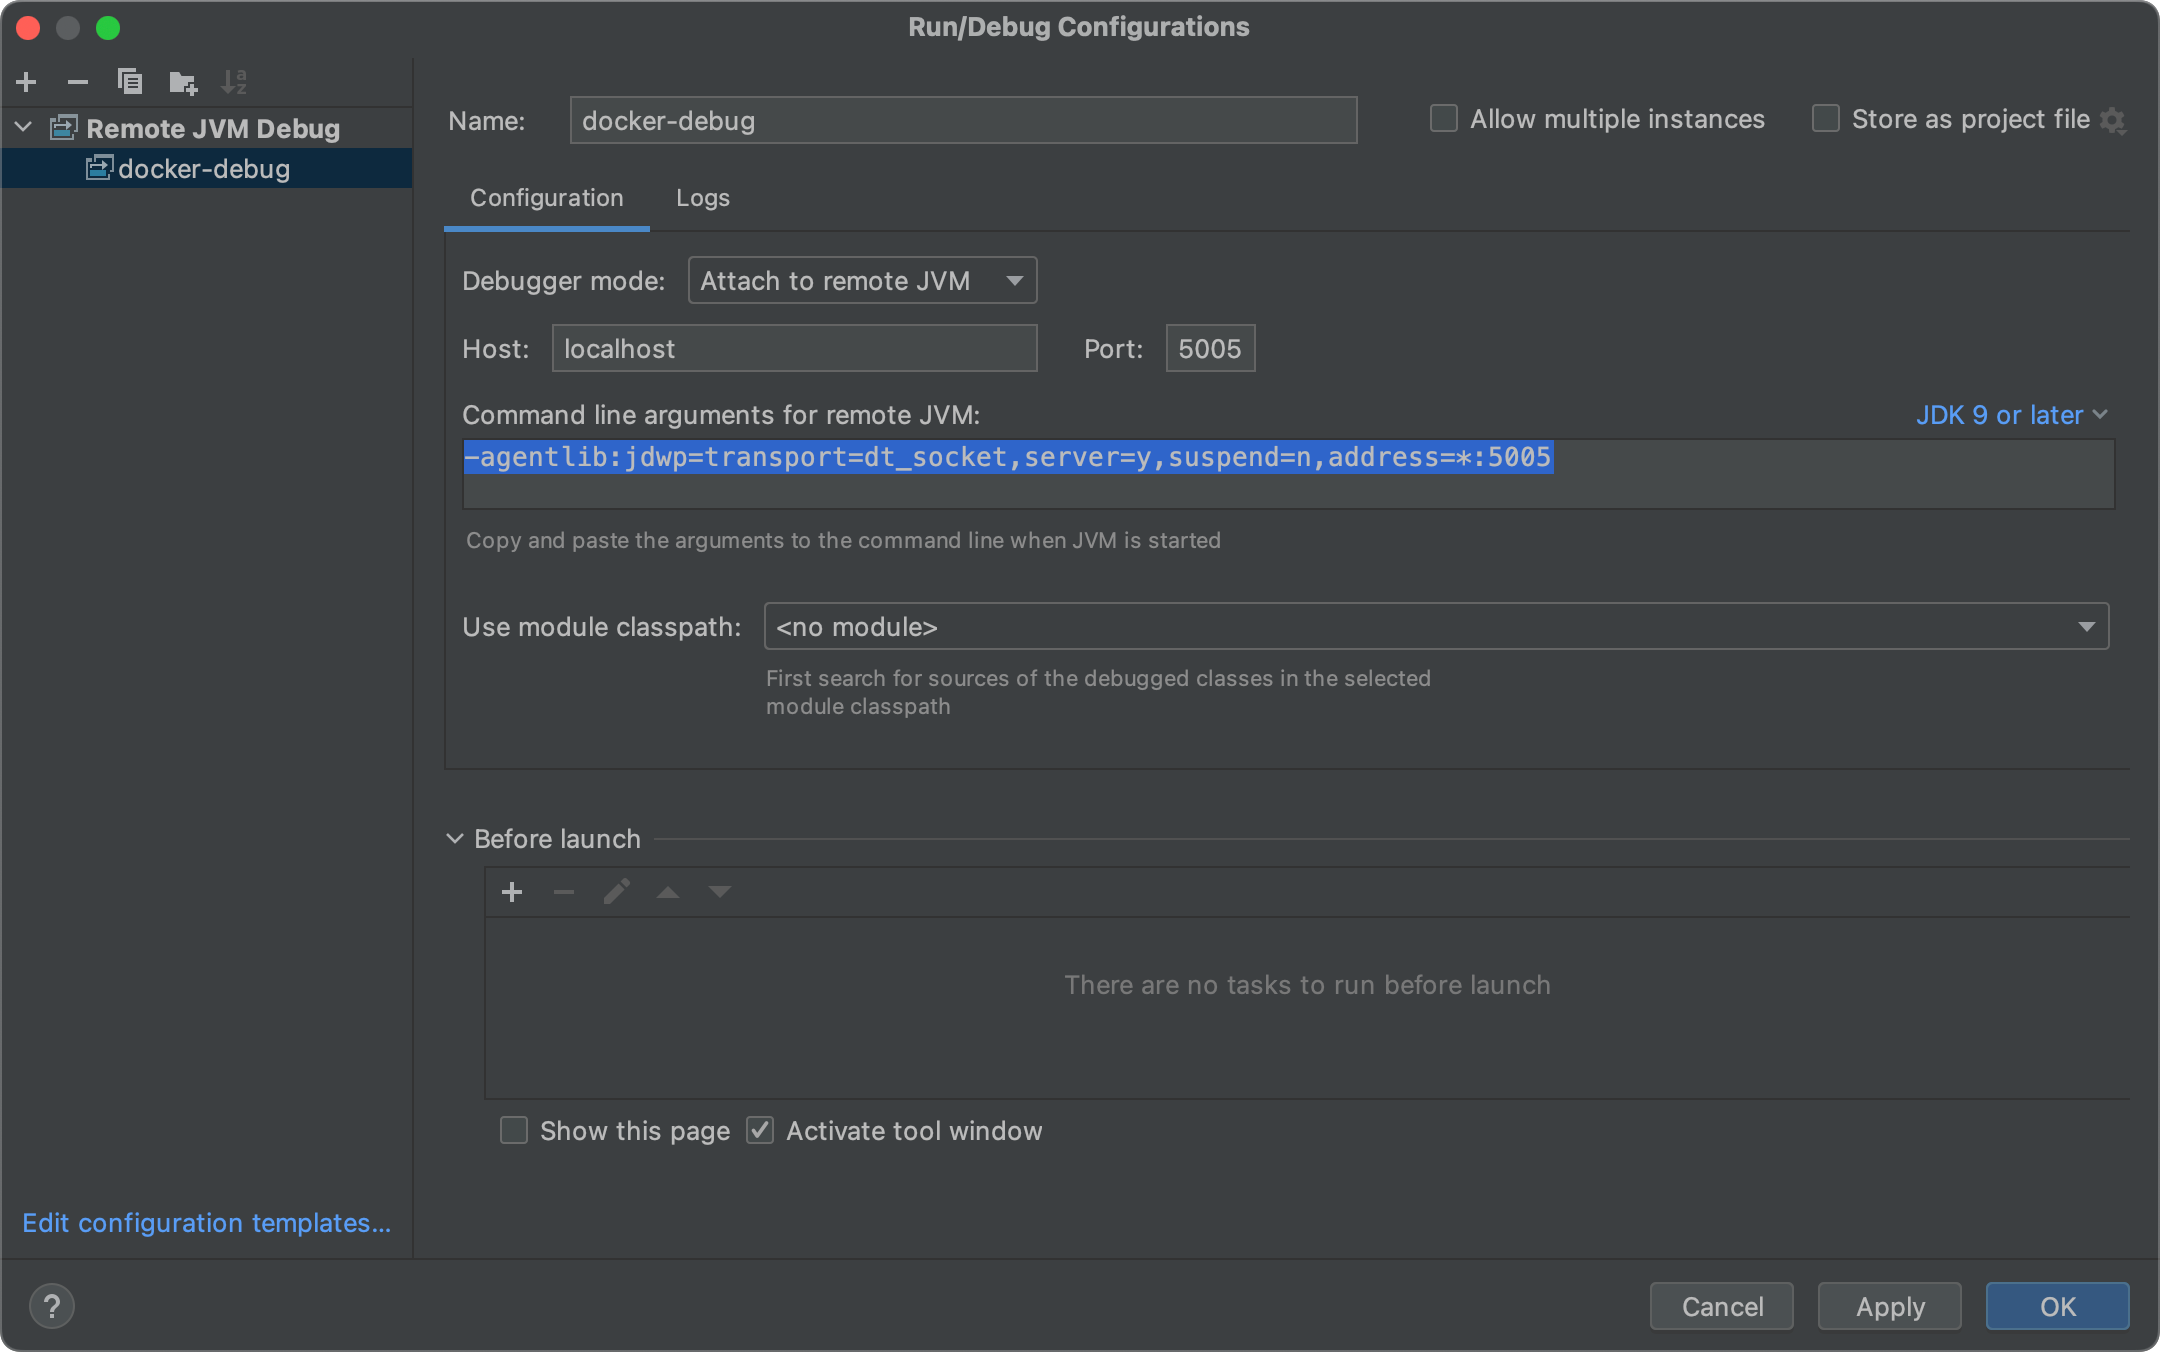
2. Create a remote debug configuration in IntelliJ
Open IntelliJ IDEA and go to Run > Edit Configurations. Click + in the top-left corner and select Remote JVM Debug.
Give the configuration a name such as docker-debug.
Set the following fields:
- Debugger mode: Attach to remote JVM
- Host:
localhost - Port:
5005
Note
IntelliJ also displays a "Command line arguments for remote JVM" field showing the -agentlib:jdwp string. This is informational — it shows what the target JVM needs. You already added this to START_OPTS in step 1, so no further action is needed.
Click Apply and OK.
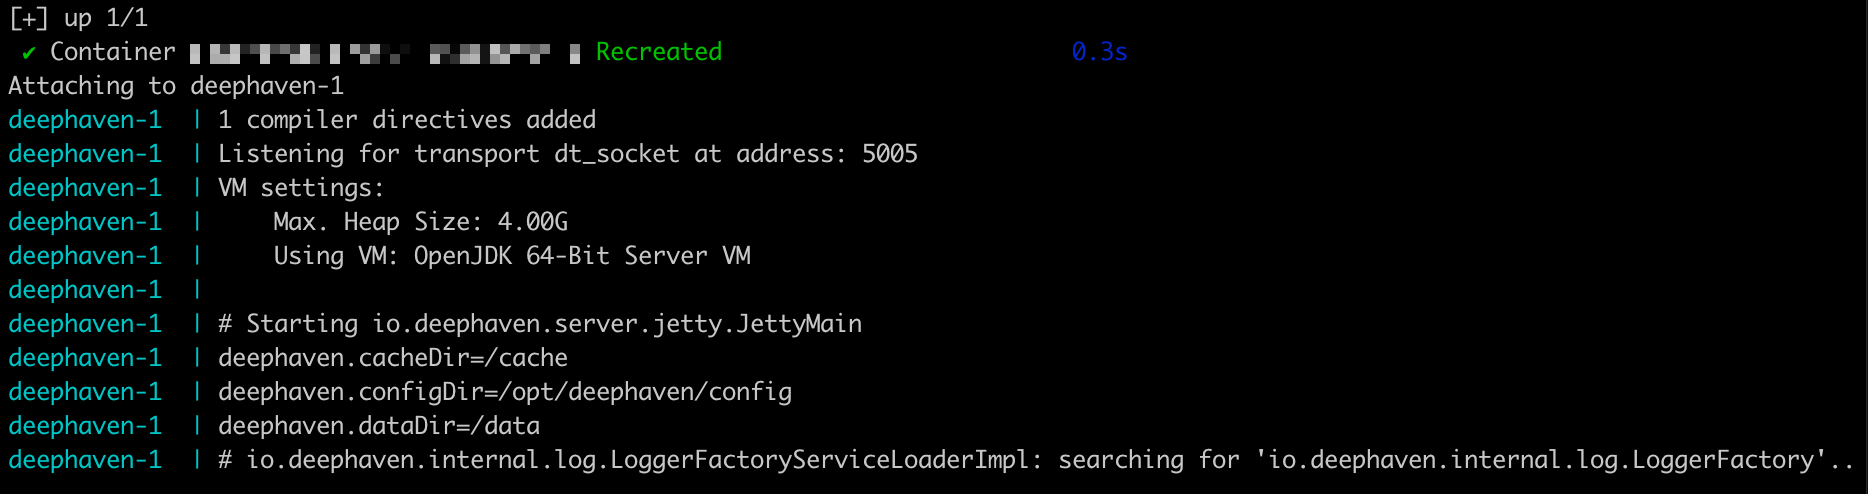
3. Start Deephaven
Start the Deephaven container from a terminal in the directory containing your docker-compose.yml:
Wait for the server to finish starting. You should see output similar to:
This confirms the JVM is ready for a debugger connection.
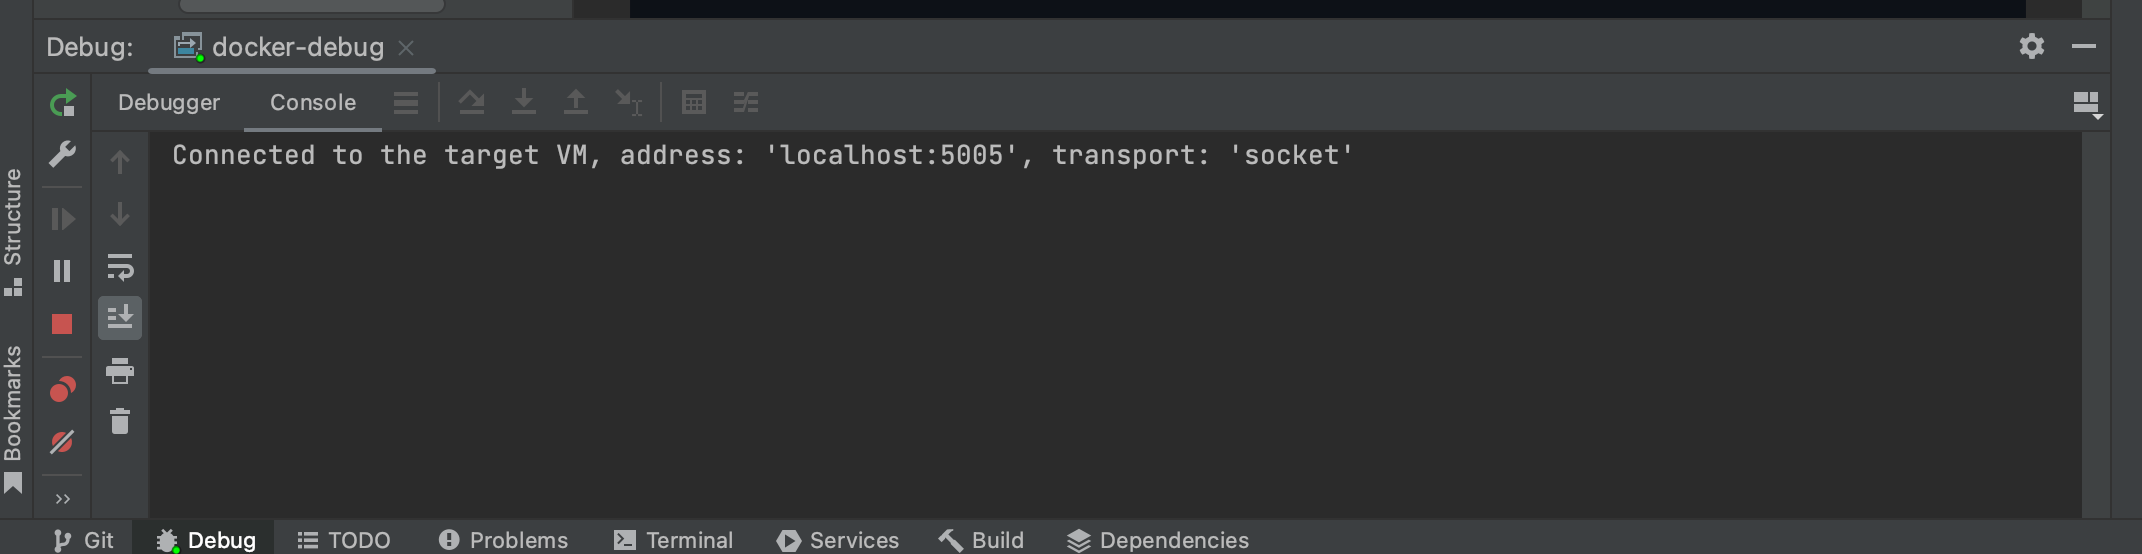
4. Attach the debugger
In IntelliJ IDEA, start the debug configuration by selecting Run > Debug 'docker-debug', or click the bug icon in the toolbar.
IntelliJ will connect to port 5005. The debugger status bar at the bottom of the IDE will show that it is connected.
5. Use the IntelliJ debugger
Once connected, IntelliJ has access to the running JVM. You can inspect thread dumps and heap state, and set breakpoints in Deephaven's own compiled Java code when using a source-built setup.
Note
Breakpoints in user-defined Groovy scripts do not work with this setup. Deephaven compiles app mode scripts and console code dynamically. Before compiling, it prepends a package io.deephaven.dynamic; declaration, which shifts all line numbers by one and gives the compiled class a path-derived internal name. IntelliJ cannot map these back to your source file, so breakpoints set in your .groovy files are never hit.
Tracing with println
For debugging logic in your own Groovy scripts, use println statements. Output appears in the container logs.
Here is an example that traces calls through a function:
Follow the output while the container runs:
You will see each call traced in the log:
For line-by-line breakpoint debugging of user Groovy code, see source debugging setup.
IntelliJ IDEA's debugger can step through and inspect variables when breakpoints do fire. JetBrains' debugging guide is a good reference for general debugger usage.
Troubleshooting
Debugger won't connect
Problem: IntelliJ reports a connection error when starting the debug configuration.
Solutions:
- Verify the Deephaven container is running and shows the
Listening for transport dt_socketmessage. - Check that port 5005 is exposed in your
docker-compose.ymland is not blocked by a firewall. - Ensure the port in the IntelliJ configuration matches the port in
START_OPTS.
Breakpoints are not hit
Problem: Execution runs through a breakpoint without pausing.
Cause: Breakpoints in user-defined Groovy scripts (app mode scripts or console code) do not work with the prebuilt Docker image. Deephaven compiles these scripts dynamically with a prepended package declaration that offsets line numbers and assigns an internal path-derived class name. IntelliJ cannot reliably map these compiled classes back to your source file.
Solutions:
- Use
printlnstatements to trace execution. Output appears indocker compose logs -f. - For breakpoint debugging of user code, see source debugging setup.
- If you are trying to set breakpoints in Deephaven's own code, the source debugging setup is required.
Debugger disconnects after attaching
Problem: Connection is established but immediately drops.
Solutions:
- Ensure anonymous authentication is enabled via
-DAuthHandlersinSTART_OPTS(see step 1). - Check the IntelliJ debug console for error messages indicating the cause.
- Try increasing JVM memory if you see out-of-memory errors (adjust
-Xmx4ginSTART_OPTS).