How to use Deephaven's performance tables for system monitoring
This guide shows how to use Deephaven's internal performance tables.
Deephaven provides several options to enable users to monitor query performance and resolve issues as they arise. Many of these methods are available directly in the user interface. For example, users can see how long a query has been running by opening the History Panel and looking at the command details or hovering over the console command: the tooltip will show the formatted duration of the query. The most common performance issues are slow initialization, a query failing to update quickly, or a sluggish user interface.
If a query seems to be taking too long or throws an error, looking at the process and worker information in Deephaven's internal tables is a great place to start. Performance tables are a powerful tool for analyzing performance and debugging issues in Deephaven. This information is intended to help you troubleshoot queries independently. If you need more help, we encourage you to visit our Community Discussions page or contact us on Slack. You can also send us your logs and/or Exception messages.
Terminology
Evaluation numbers
Several of the performance tables' constructor methods take an evaluation_number argument. This number is a unique identifier for a query (whatever you type into the console and press Enter) and its subqueries (individual operations within the query, such as individual method calls). Evaluation numbers can be found in the performance data tables obtained from calling query_performance_log or query_operation_performance_log.
Available performance tables
Deephaven's perfmon package contains various methods to create and open performance tables in the Deephaven IDE.
Query Update Performance
The Query Update Performance table takes in an evaluation number and returns a table containing the performance data for that query's update performance.
The syntax is as follows, where n is the evaluation number of the query you want to analyze:
| Column Name | Data Type | Description |
|---|---|---|
EvaluationNumber | long | An increasing integral value for requests made to the worker. |
OperationNumber | int | An identifier for an operation within an evaluation. |
Ratio | double | The ratio of time in an update cycle spent performing calculations. 1 would mean that the entirety of the update cycle was spent performing calculations. |
QueryMemUsed | long | The total memory used by a query, in KB. |
QueryMemUsedPct | double | The percentage of total memory used by the query. |
IntervalEndTime | Instant | The end of the interval this row represents. |
RowsPerSec | long | The number of rows per second. |
RowsPerCPUSec | long | The number of rows per CPU second. |
EntryDescription | String | A textual description of the operation, generally including the name and some of the arguments. |
EntryId | long | A numeric identifier for this performance entry, which can be used to identify the same operation across cycles. |
EntryCallerLine | String | The file and line number where the operation was initiated, if available. |
IntervalStartTime | Instant | The beginning of the interval this row represents. |
UsageNanos | long | How long, in nanoseconds, this operation took in this interval. |
CpuNanos | long | How long, in nanoseconds, this operation used the CPU in this interval. |
UserCpuNanos | long | How long, in nanoseconds, this operation used the CPU in user-space in this interval. System time can be derived by subtracting UserCpuNanos from CpuNanos. |
RowsAdded | long | How many rows were added in this interval. |
RowsRemoved | long | How many rows were removed in this interval. |
RowsModified | long | How many rows were modified in this interval. |
RowsShifted | long | How many rows were shifted in this interval (this may not be an exact count, a sparse region may be shifted and the number of present rows is not calculated). |
InvocationCount | long | How many times this entry was executed in this interval. |
MinFreeMemory | long | The minimum memory at the end of an operation. |
MaxTotalMemory | long | The maximum total memory at the end of an operation. |
Collections | long | The number of garbage collections while executing this operation in this interval. |
CollectionTimeNanos | long | The number of nanoseconds spent in the garbage collector while executing this operation in this interval. |
AllocatedBytes | long | The number of bytes allocated by this operation in this interval. |
PoolAllocatedBytes | long | The number of bytes allocated from pools by this operation in this interval. |
AuthContext | String | The authentication context used for executing this operation. |
UpdateGraph | String | The name of the update graph for this entry. |
IntervalDurationNanos | long | The duration of the interval in nanoseconds. |
WorkerHeapSize | long | The size of the worker heap. |
QueryMemFree | long | The amount of free memory in the query. |
NRows | long | The number of rows in the query. |
Query Operation Performance
The Query Operation Performance table contains data on how long each individual operation of a query (where, update, natural_join, etc., as well as internal functions) takes to execute, and the change in resource consumption while each was executing. The query_operation_performance method requires an evaluation number to identify the query you want to analyze.
| Column Name | Data Type | Description |
|---|---|---|
EvaluationNumber | long | An increasing integral value for requests made to the worker. |
ParentEvaluationNumber | long | When a query is part of a batch, the evaluation number of the enclosing parent. |
OperationNumber | int | An identifier for an operation within an evaluation. |
ParentOperationNumber | int | When a query is part of a batch, the enclosing operation within the parent. |
EndTime | Instant | The time this operation finished. |
TimeSecs | double | The time this operation took in seconds. |
NetMemoryChange | long | The change in memory during this operation. |
Depth | int | The level of operation within a nested operation, zero when there is no parent. |
SessionId | String | A unique identifier for the user-session performing the operation. |
Description | String | A textual description of the operation, generally including the name and some of the arguments. |
CallerLine | String | The file and line number where the operation was initiated, if available. |
IsCompilation | boolean | Does this represent a formula compilation operation? |
StartTime | Instant | The time this operation began. |
UsageNanos | long | How long, in nanoseconds, this operation took. |
CpuNanos | long | How long, in nanoseconds, this operation used the CPU. |
UserCpuNanos | long | How long, in nanoseconds, this operation used the CPU in user-space. System time can be derived by subtracting UserCpuNanos from CpuNanos. |
FreeMemory | long | The free memory at the end of this operation. |
TotalMemory | long | The total size of the JVM heap memory at the end of this operation. |
FreeMemoryChange | long | The change in free memory during this operation. |
TotalMemoryChange | long | The change in total JVM heap memory during this operation. |
Collections | long | The number of garbage collections while executing this operation. |
CollectionTimeNanos | long | The number of nanoseconds spent in the garbage collector while executing this operation. |
AllocatedBytes | long | The number of bytes allocated by this operation. |
PoolAllocatedBytes | long | The number of bytes allocated from pools by this operation. |
InputSizeLong | long | The number of rows in the input for this operation. |
WasInterrupted | boolean | Was this operation interrupted? |
Server State
The Server State table contains basic memory, update graph processor, and GC stats for the current engine process, sampled on a periodic basis.
| Column Name | Data Type | Description |
|---|---|---|
IntervalStart | Instant | The beginning of the interval this row represents. |
IntervalSecs | double | The length of the interval being reported (in seconds). |
IntervalEnd | Instant | The end of the interval this row represents. |
UsedMemMiB | double | The amount of used memory in MiB. |
AvailMemMiB | double | The amount of available memory in MiB. |
MaxMemMiB | double | The maximum amount of memory in MiB. |
AvailMemRatio | double | The ratio of available memory to maximum memory. |
UsedMemRatio | double | The ratio of used memory to maximum memory. |
GcTimeRatio | float | The ratio of GC time to total time. |
UGPCycles | long | The number of cycles in the update graph processor. |
UGPOnBudgetRatio | float | The ratio of on-budget cycles to total cycles. |
UGPCycleMaxSecs | double | The maximum cycle time in seconds. |
UGPCycleMedianSecs | double | The median cycle time in seconds. |
UGPCycleMeanSecs | double | The mean cycle time in seconds. |
UGPCycleP90Secs | double | The 90th percentile cycle time in seconds. |
UGPTimeRatio | float | The ratio of UGP time to total time. |
UGPSafePointTimeRatio | float | The ratio of UGP safe point time to total time. |
Query Performance
query_performance takes in an evaluation number and returns a table containing that query’s performance data.
The query performance table contains data on how long each query takes to run. Examples of what constitutes one individual query, for performance logging purposes, include:
- A new command in the console (i.e. type something, then press the return key).
- A sort, filter, or custom column generated by a UI.
- A call from a client API external application.
| Column Name | Data Type | Description |
|---|---|---|
EvaluationNumber | long | An increasing integral value for requests made to the worker. |
ParentEvaluationNumber | long | When a query is part of a batch, the evaluation number of the enclosing parent. |
QueryMemUsed | long | The amount of memory used by the query. |
QueryMemFree | long | The amount of free memory in the Deephaven instance. |
QueryMemUsedPct | double | The percentage of memory used by the query. |
EndTime | Instant | The time this operation finished. |
TimeSecs | double | The time this operation took in seconds. |
NetMemoryChange | long | The change in memory during this operation. |
SessionId | String | A unique identifier for the user-session performing the operation. |
Description | String | A textual description of the operation, generally including the name and some of the arguments. |
StartTime | Instant | The time this operation began. |
UsageNanos | long | How long, in nanoseconds, this operation took. |
CpuNanos | long | How long, in nanoseconds, this operation used the CPU. |
UserCpuNanos | long | How long, in nanoseconds, this operation used the CPU in user-space. System time can be derived by subtracting UserCpuNanos from CpuNanos. |
FreeMemory | long | The free memory at the end of this operation. |
TotalMemory | long | The total size of the JVM heap memory at the end of this operation. |
FreeMemoryChange | long | The change in free memory during this operation. |
TotalMemoryChange | long | The change in total JVM heap memory during this operation. |
Collections | long | The number of garbage collections while executing this operation. |
CollectionTimeNanos | long | The number of nanoseconds spent in the garbage collector while executing this operation. |
AllocatedBytes | long | The number of bytes allocated by this operation. |
PoolAllocatedBytes | long | The number of bytes allocated from pools by this operation. |
WasInterrupted | boolean | Was this operation interrupted? |
Exception | String | If this query produced an exception, the Exception information. Otherwise null. |
AuthContext | String | The authentication context used for executing this operation. |
WorkerHeapSize | long | The size of the worker heap. |
DurationNanos | long | The duration of the query in nanoseconds. |
Query Performance Log
The Query Performance Log (QPL) contains many of the same columns as the Update Performance Log and Query Operation Performance Log. This table contains details on query-level performance. A given Deephaven instance may run multiple queries, each with its own set of query performance log entries. See the QOPL for information on individual queries' sub-operations.
A query, in this context, is the code that is run:
- Whenever you type a new command in the console and press Return. Each 'return' where you have to wait for an answer from the worker is a new query.
- When a Persistent Query initializes.
- As a result of a batch operation (e.g., sort and filter) in the UI.
The most significant columns in this table are:
UsageNanos— How long this query ran in nanoseconds.FreeMemory— The free memory at the end of this operation.TotalMemory— The total size of the JVM heap memory at the end of this operation.FreeMemoryChange- The change in free memory during this operation.
The Query Performance Log contains details on query-level performance. A given Deephaven instance may be running multiple queries, each with its own set of query performance log entries.
| Column Name | Data Type | Description |
|---|---|---|
EvaluationNumber | long | An increasing integral value for requests made to the worker. |
ParentEvaluationNumber | long | When a query is part of a batch, the evaluation number of the enclosing parent. |
SessionId | String | A unique identifier for the user-session performing the operation. |
Description | String | A textual description of the operation, generally including the name and some of the arguments. |
StartTime | Instant | The time this operation began. |
EndTime | Instant | The time this operation finished. |
UsageNanos | long | How long, in nanoseconds, this operation took. |
CpuNanos | long | How long, in nanoseconds, this operation used the CPU. |
UserCpuNanos | long | How long, in nanoseconds, this operation used the CPU in user-space. System time can be derived by subtracting UserCpuNanos from CpuNanos. |
FreeMemory | long | The free memory at the end of this operation. |
TotalMemory | long | The total size of the JVM heap memory at the end of this operation. |
FreeMemoryChange | long | The change in free memory during this operation. Multiple threads may execute in parallel, including other operations, therefore the change in JVM memory may not be reliable. To definitively determine operations that are using significant heap, the FreeMemoryChange column should be used in concert with profiling and the AllocatedBytes column (which also includes memory allocated but subject to GC during or after the operation is complete). |
TotalMemoryChange | long | The change in total JVM heap memory during this operation. |
Collections | long | The number of garbage collections while executing this operation. |
CollectionTimeNanos | long | The number of nanoseconds spent in the garbage collector while executing this operation. |
AllocatedBytes | long | The number of bytes allocated by this operation. |
PoolAllocatedBytes | long | The number of bytes allocated from pools by this operation. |
WasInterrupted | boolean | Was this operation interrupted? |
Exception | String | If this query produced an exception, the Exception information. Otherwise null. |
AuthContext | String | The authentication context used for executing this operation. |
Update Performance Log
The update performance log (UPL) describes the time and resources used by the UpdateGraphProcessor to maintain incremental results for table operations over a series of one-minute intervals. The interval length can be changed if desired. At the end of the interval, operations where updates happen are logged. Each operation takes one row.
The EntryDescription column identifies the operations themselves. IntervalStartTime and IntervalEndTime show the beginning and end of the interval over which the operations were logged. UsageNanos and CpuNanos describe how long the operation took in total time and CPU time, respectively, in nanoseconds. Several columns detail data about row usage. Next, several rows describe memory usage and garbage collection. Lastly, two rows cover the auth context and update graph used by the operations.
| Column Name | Data Type | Description |
|---|---|---|
EntryID | long | A numeric identifier for this performance entry, which can be used to identify the same operation across cycles. |
EvaluationNumber | long | The evaluation number of the corresponding entry in the QueryOperationPerformanceLogLogger |
OperationNumber | int | The operation number of the corresponding entry in the QueryOperationPerformanceLogLogger |
EntryDescription | String | A textual description of the operation, generally including the name and some of the arguments. |
EntryCallerLine | String | The file and line number where the operation was initiated, if available. |
IntervalStartTime | Instant | The beginning of the interval this row represents. |
IntervalEndTime | Instant | The end of the interval this row represents. |
UsageNanos | long | How long, in nanoseconds, this operation took in this interval. |
CpuNanos | long | How long, in nanoseconds, this operation used the CPU in this interval. |
UserCpuNanos | long | How long, in nanoseconds, this operation used the CPU in user-space in this interval. System time can be derived by subtracting UserCpuNanos from CpuNanos. |
RowsAdded | long | How many rows were added in this interval. |
RowsRemoved | long | How many rows were removed in this interval. |
RowsModified | long | How many rows were modified in this interval. |
RowsShifted | long | How many rows were shifted in this interval (this may not be an exact count, a sparse region may be shifted and the number of present rows is not calculated). |
InvocationCount | long | How many times this entry was executed in this interval. |
MinFreeMemory | long | The minimum memory at the end of an operation. |
MaxTotalMemory | long | The maximum total memory at the end of an operation. |
Collections | long | The number of garbage collections while executing this operation in this interval. |
CollectionTimeNanos | long | The number of nanoseconds spent in the garbage collector while executing this operation in this interval. |
AllocatedBytes | long | The number of bytes allocated by this operation in this interval. |
PoolAllocatedBytes | long | The number of bytes allocated from pools by this operation in this interval. |
AuthContext | String | The authentication context used for executing this operation. |
UpdateGraph | String | The name of the update graph for this entry. |
Update Performance Ancestors Log
The Update Performance Ancestors log contains the UpdateGraph, EntryId, and EntryDescription columns from the Update Performance Log and an additional Ancestors column. This table represents the relationships between nodes in the Deephaven engine's Update Graph.
| Column Name | Data Type | Description |
|---|---|---|
UpdateGraph | String | The name of the update graph for this entry. |
EntryID | long | A numeric identifier for this performance entry, which can be used to identify the same operation across cycles. |
EntryDescription | String | A textual description of the operation, generally including the name and some of the arguments. |
Ancestors | LongVector | A vector of ancestor EntryId values. |
An entry from the Ancestors log can be visualized with the ancestor_image method:
Note
You must have Graphviz installed to produce an ancestors image.
Query Operation Performance Log
The Query Operation Performance Log (QOPL) contains performance data for individual subqueries. It is similar to the Update Performance Log, however, unlike the UPL, the QOPL collects information about operations as they happen, rather than over an interval. The QOPL does not have an EntryDescription column, so you'll need to identify operations by their EvaluationNumber, which exists in the UPL.
The most significant columns in this table are:
StartTime— The time at which this operation started.EndTime— The time at which this operation ended.OperationNumber— Monotonically increasing sequence numbers for each operation of a query.TimeSecs— The time (in seconds) that the operation took.FreeMemory— The free memory at the end of this operation.TotalMemory— The total size of the JVM heap memory at the end of this operation.FreeMemoryChange- The change in free memory during this operation.
| Column Name | Data Type | Description |
|---|---|---|
EvaluationNumber | long | An increasing numeric value for requests made to the worker. |
ParentEvaluationNumber | long | When a query is part of a batch, the evaluation number of the enclosing parent. |
OperationNumber | int | An identifier for an operation within an evaluation. |
ParentOperationNumber | int | When a query is part of a batch, the enclosing operation within the parent. |
Depth | int | The level of operation within a nested operation, zero when there is no parent. |
SessionId | String | A unique identifier for the user-session performing the operation. |
Description | String | A textual description of the operation, generally including the name and some of the arguments. |
CallerLine | String | The file and line number where the operation was initiated, if available. |
IsCompilation | boolean | Does this represent a formula compilation operation? |
StartTime | Instant | The time this operation began. |
EndTime | Instant | The time this operation finished. |
UsageNanos | long | How long, in nanoseconds, this operation took. |
CpuNanos | long | How long, in nanoseconds, this operation used the CPU. |
UserCpuNanos | long | How long, in nanoseconds, this operation used the CPU in user-space. System time can be derived by subtracting UserCpuNanos from CpuNanos. |
FreeMemory | long | The free memory at the end of this operation. |
TotalMemory | long | The total size of the JVM heap memory at the end of this operation. |
FreeMemoryChange | long | The change in free memory during this operation. |
TotalMemoryChange | long | The change in total JVM heap memory during this operation. |
Collections | long | The number of garbage collections while executing this operation. |
CollectionTimeNanos | long | The number of nanoseconds spent in the garbage collector while executing this operation. |
AllocatedBytes | long | The number of bytes allocated by this operation. |
PoolAllocatedBytes | long | The number of bytes allocated from pools by this operation. |
InputSizeLong | long | The number of rows in the input for this operation. |
WasInterrupted | boolean | Was this operation interrupted? |
AuthContext | String | The authentication context used for executing this operation. |
Process Metrics Log
This table contains metrics collected for the current Deephaven engine process.
| Column Name | Data Type | Description |
|---|---|---|
ProcessUniqueId | String | The process's unique identifier String. |
Timestamp | Instant | A Java Instant representing the exact time the process ran. |
Name | String | The name of the metric being reported. |
Interval | String | The length of the interval being reported (for example, "1s" or "15m"). |
Type | String | The type of the process - state, counter, etc. |
N | long | The number of samples. |
Sum | long | The sum of all samples in this interval. |
Last | long | The last sample in this interval. |
Min | long | The minimum sample in this interval. |
Max | long | The maximum sample in this interval. |
Avg | long | The mean of all samples in this interval. |
Sum2 | long | The sum of the squares of all samples in this interval. |
StdDev | long | The standard deviation of all samples in this interval. |
Process Info Log
This static table contains process information for the current Deephaven engine process.
| Column Name | Data Type | Description |
|---|---|---|
Id | String | An identifier string for this process. |
Type | String | The type of process performed in this row. |
Key | String | A key describing the process or property. |
Value | String | The value of the property or process described by the Key. |
Server State Log
This table contains JVM info about memory utilization, the Periodic Update Graph (UG), and garbage collection statistics sampled on a periodic basis.
| Column Name | Data Type | Description |
|---|---|---|
IntervalStartTime | Instant | The start time of the interval. |
IntervalDurationMicros | long | The number of microseconds in the interval. |
TotalMemoryMiB | int | The amount of memory allocated to the JVM. |
FreeMemoryMiB | int | The amount of free memory in the JVM. |
IntervalCollections | short | The number of garbage collection events in the interval. |
IntervalCollectionTimeMicros | int | The number of microseconds (approximately) spent collecting garbage in the interval. |
IntervalUGPCyclesOnBudget | short | The number of update graph processor cycles on budget in the interval. |
IntervalUGPCyclesTimeMicros | String | The duration of update graph processor cycles, in microseconds in the interval. |
IntervalUGPCyclesSafePoints | short | The number of safe points in the interval. |
IntervalUGPCyclesSafePointTimeMicros | int | The number of microseconds spent in safe points in the interval. |
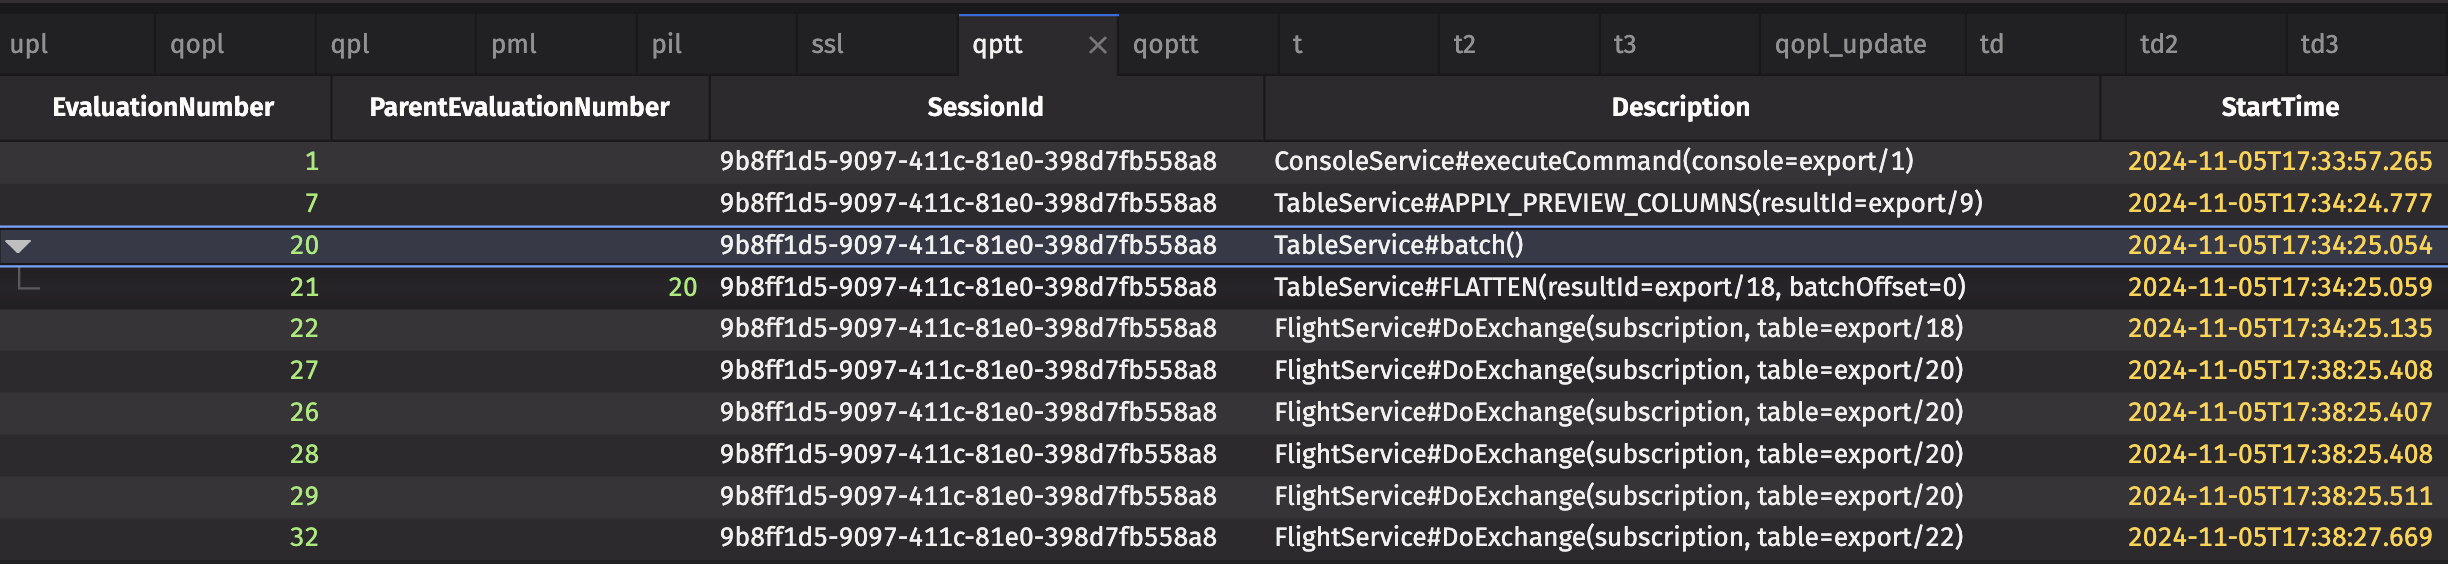
Query Performance Tree Table
This tree table contains Deephaven query performance data. It displays information that can also be found in the Query Performance Log, in tree table form. It is similar to a traditional call graph, placing every operation with a parent operation into expandable groups. For example, we can click on the row where EvaluationNumber = 20 to view the sub-operation with EvaluationNumber = 21:
Performance data for individual sub-operations as a tree table is available from calling query_operation_performance_tree_table.
| Column Name | Data Type | Description |
|---|---|---|
EvaluationNumber | long | The evaluation number of the corresponding entry in the QueryOperationPerformanceLogLogger. |
ParentEvaluationNumber | long | The evaluation number of this row's parent in the QueryOperationPerformanceLogLogger. |
SessionId | String | A unique identifier for the user-session performing the operation. |
Description | String | A textual description of the operation, generally including the name and some of the arguments. |
StartTime | Instant | The time this operation began. |
EndTime | Instant | The time this operation finished. |
UsageNanos | long | How long, in nanoseconds, this operation took. |
CpuNanos | long | How long, in nanoseconds, this operation used the CPU. |
UserCpuNanos | long | How long, in nanoseconds, this operation used the CPU in user-space. System time can be derived by subtracting UserCpuNanos from CpuNanos. |
FreeMemory | long | The free memory at the end of this operation. |
TotalMemory | long | The total size of the JVM heap memory at the end of this operation. |
FreeMemoryChange | long | The change in free memory during this operation. |
TotalMemoryChange | long | The change in total JVM heap memory during this operation. |
Collections | long | The number of garbage collections while executing this operation in this interval. |
CollectionTimeNanos | long | The number of nanoseconds spent in the garbage collector while executing this operation. |
AllocatedBytes | long | The number of bytes allocated by this operation. |
PoolAllocatedBytes | long | The number of bytes allocated from pools by this operation. |
WasInterrupted | boolean | Was this operation interrupted? |
Exception | String | If this query produced an exception, the Exception information. Otherwise null. |
AuthContext | String | The authentication context used for executing this operation. |
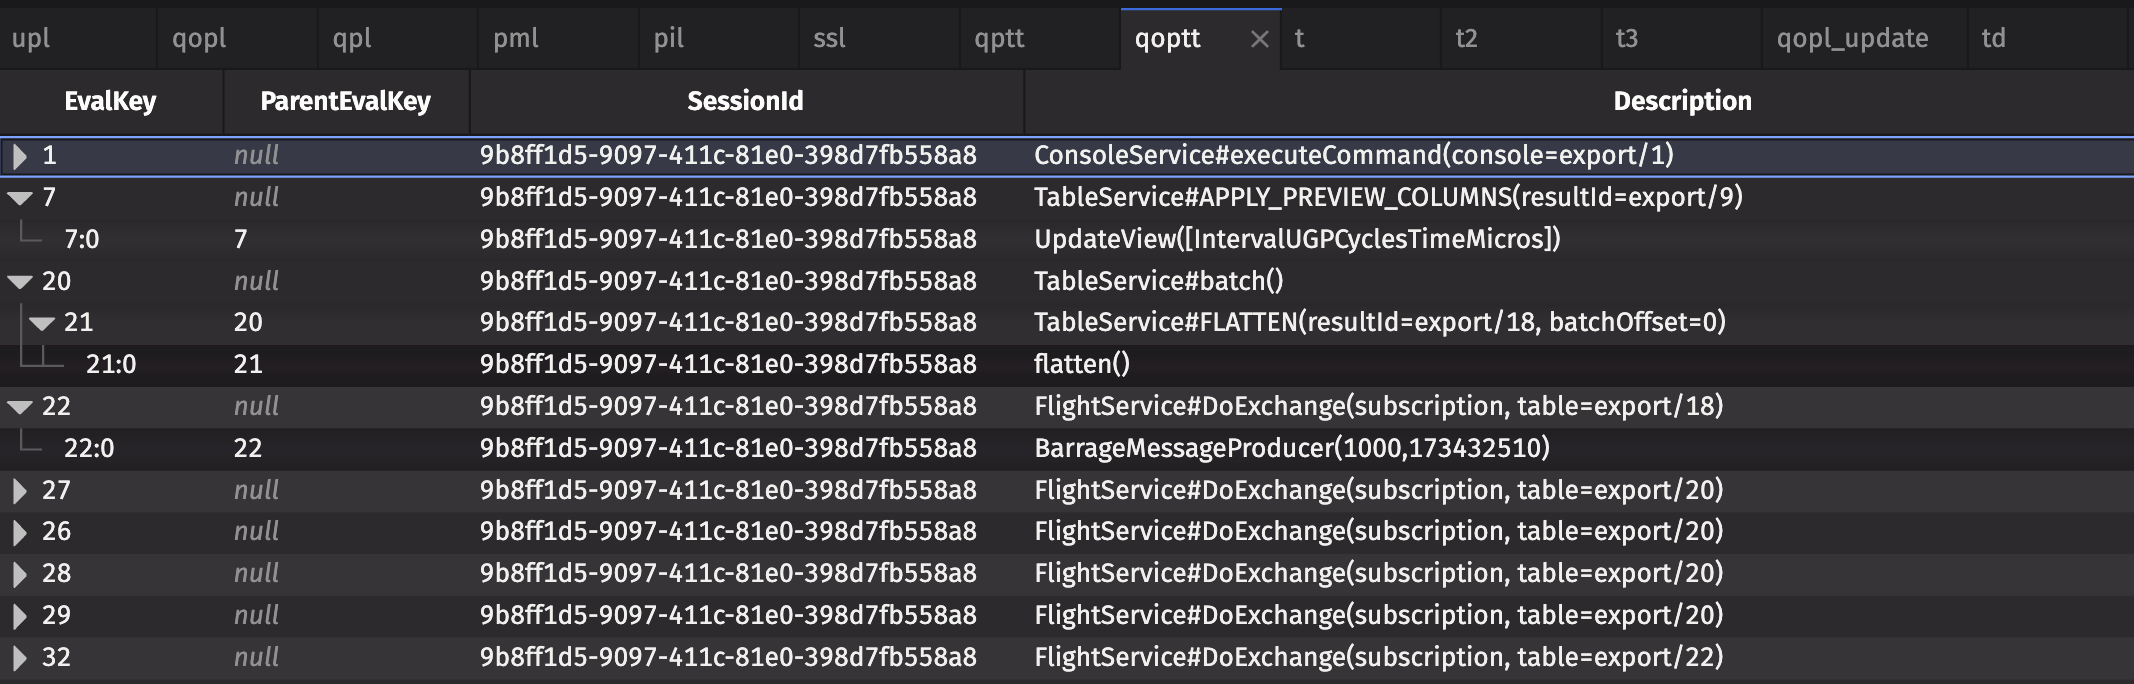
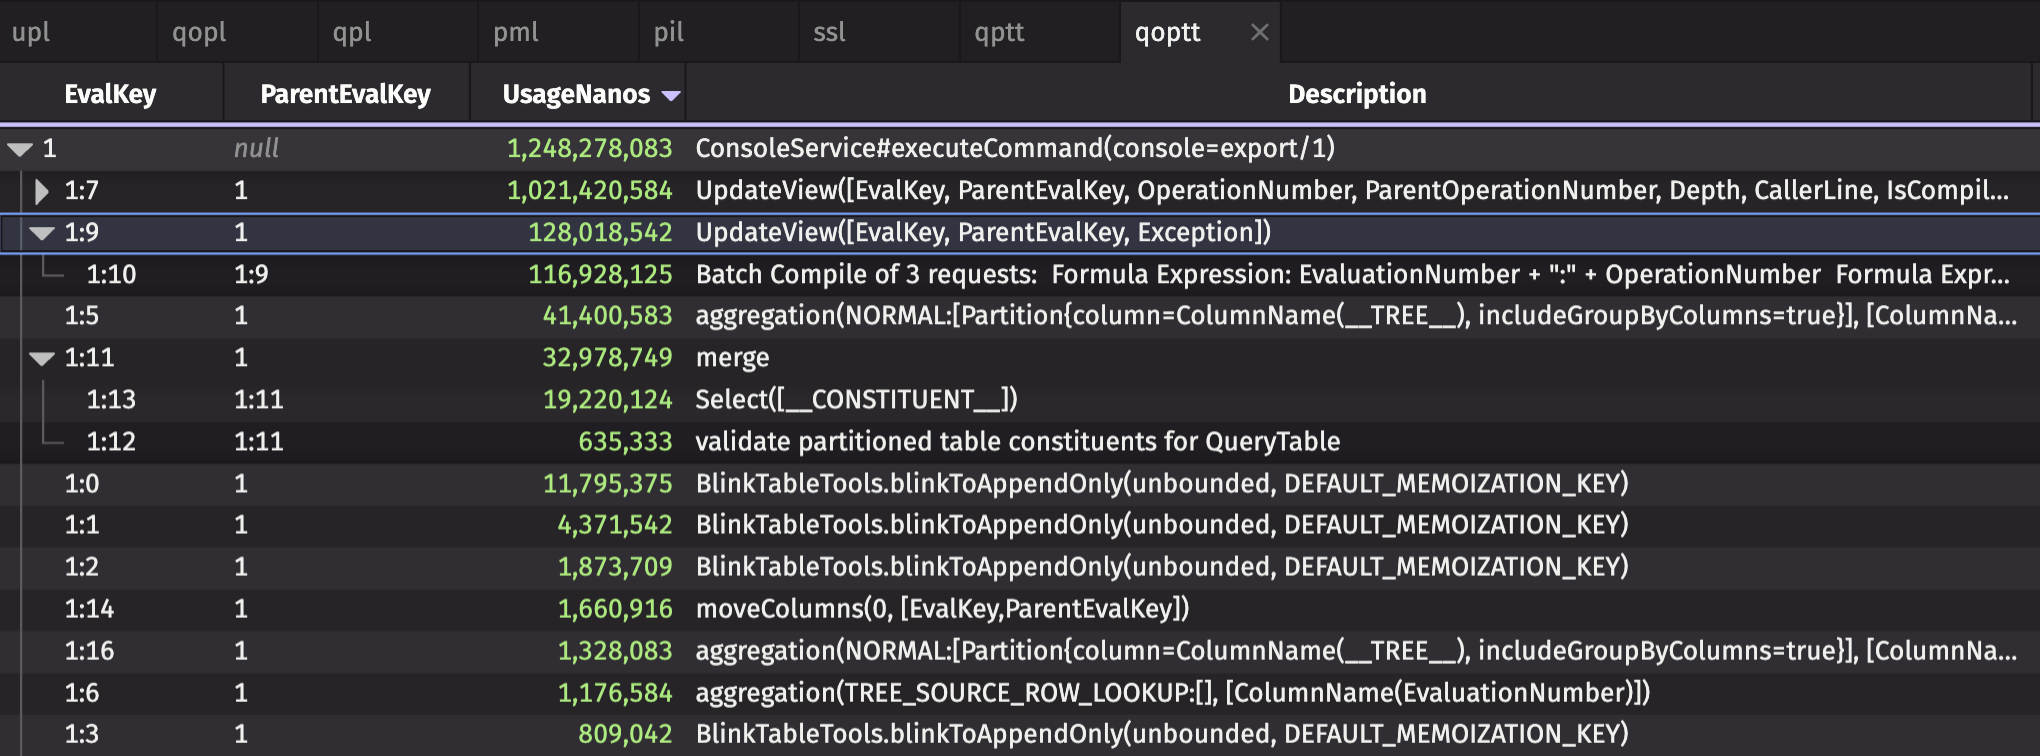
Query Operation Performance Tree Table
This tree table contains Deephaven performance data on how long each individual operation of a query (where, update, natural_join, etc., as well as internal functions) takes to execute, and the change in resource consumption while each was executing. It displays information that can also be found in the Query Operation Performance Log, in tree table form. It is similar to a traditional call graph, placing every operation with a parent operation into expandable groups.
| Column Name | Data Type | Description |
|---|---|---|
EvalKey | String | A numerical string corresponding to this row's EvaluationNumber. |
ParentEvalKey | String | The EvalKey of this row's parent, used to construct the tree. |
SessionId | String | A unique identifier for the user-session performing the operation. |
Description | String | A textual description of the operation, generally including the name and some of the arguments. |
StartTime | Instant | The time this operation began. |
EndTime | Instant | The time this operation finished. |
UsageNanos | long | How long, in nanoseconds, this operation took. |
CpuNanos | long | How long, in nanoseconds, this operation used the CPU. |
UserCpuNanos | long | How long, in nanoseconds, this operation used the CPU in user-space. System time can be derived by subtracting UserCpuNanos from CpuNanos. |
FreeMemory | long | The free memory at the end of this operation. |
TotalMemory | long | The total size of the JVM heap memory at the end of this operation. |
FreeMemoryChange | long | The change in free memory during this operation. |
TotalMemoryChange | long | The change in total JVM heap memory during this operation. |
Collections | long | The number of garbage collections while executing this operation in this interval. |
CollectionTimeNanos | long | The number of nanoseconds spent in the garbage collector while executing this operation. |
AllocatedBytes | long | The number of bytes allocated by this operation. |
PoolAllocatedBytes | long | The number of bytes allocated from pools by this operation. |
WasInterrupted | boolean | Was this operation interrupted? |
Exception | String | If this query produced an exception, the Exception information. Otherwise null. |
AuthContext | String | The authentication context used for executing this operation. |
Depth | int | How deep in the tree structure the given row is. A row with no parents has a depth of 0; a row with one parent has a depth of 1; and so on. |
CallerLine | String | The file and line number where the operation was initiated, if available. |
IsCompilation | boolean | Whether the operation on this row was a compile-type operation. |
InputSizeLong | long | The number of rows in the input tables. |
EvaluationNumber | long | The evaluation number of the corresponding entry in the QueryOperationPerformanceLogLogger |
ParentEvaluationNumber | long | The evaluation number of this row's parent in the QueryOperationPerformanceLogLogger. |
OperationNumber | int | An identifier for an operation within an evaluation. |
ParentOperationNumber | int | When a query is part of a batch, the enclosing operation within the parent. |
Example use case
The tables available in perfmon contain a lot of information, and it can seem overwhelming without some context. Let's explore an example use case, particularly the Update Performance Log and Query Operation Performance Log.
Below is the entire query.
Performance table query
There are a couple of key pieces in the above query worth noting:
- The functions
fastandslowdo the same thing.slowis slow because it waits for 1/4 of a second to perform and return the calculation. upl_updateadds two columns:IntervalDurationNanosandRatio.Ratiocalculates the percent of the interval that was spent performing a particular operation. The table is also sorted byRatioin descending order so that the operations that take the most time show up at the top.
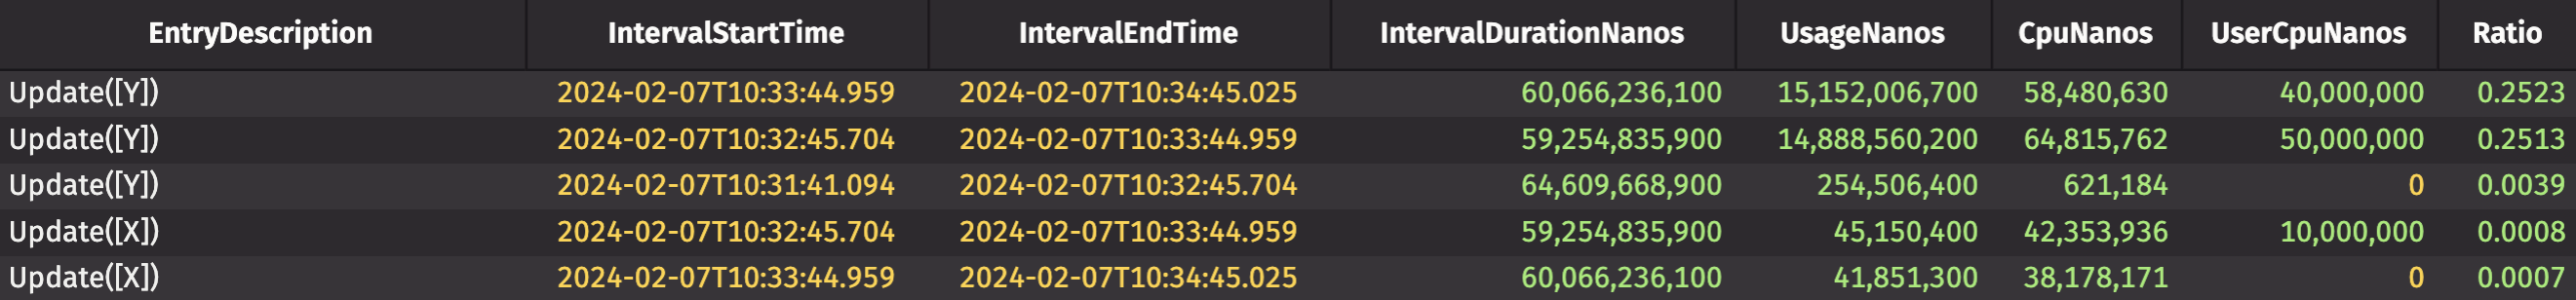
In the above image, the Update([Y]) (the slow function) takes a whopping 25% of the total interval time. This makes sense based on what's happening; every second, a new row is added to the ticking tables. For a quarter of that second, the Deephaven engine sits around waiting for time.sleep(0.25) to be finished. Clearly, slow is a bottleneck in this particular code. In real applications, it won't be as obvious why something causes a slowdown. Still, this example query is a simple way to identify areas where performance improvements will be more significant.
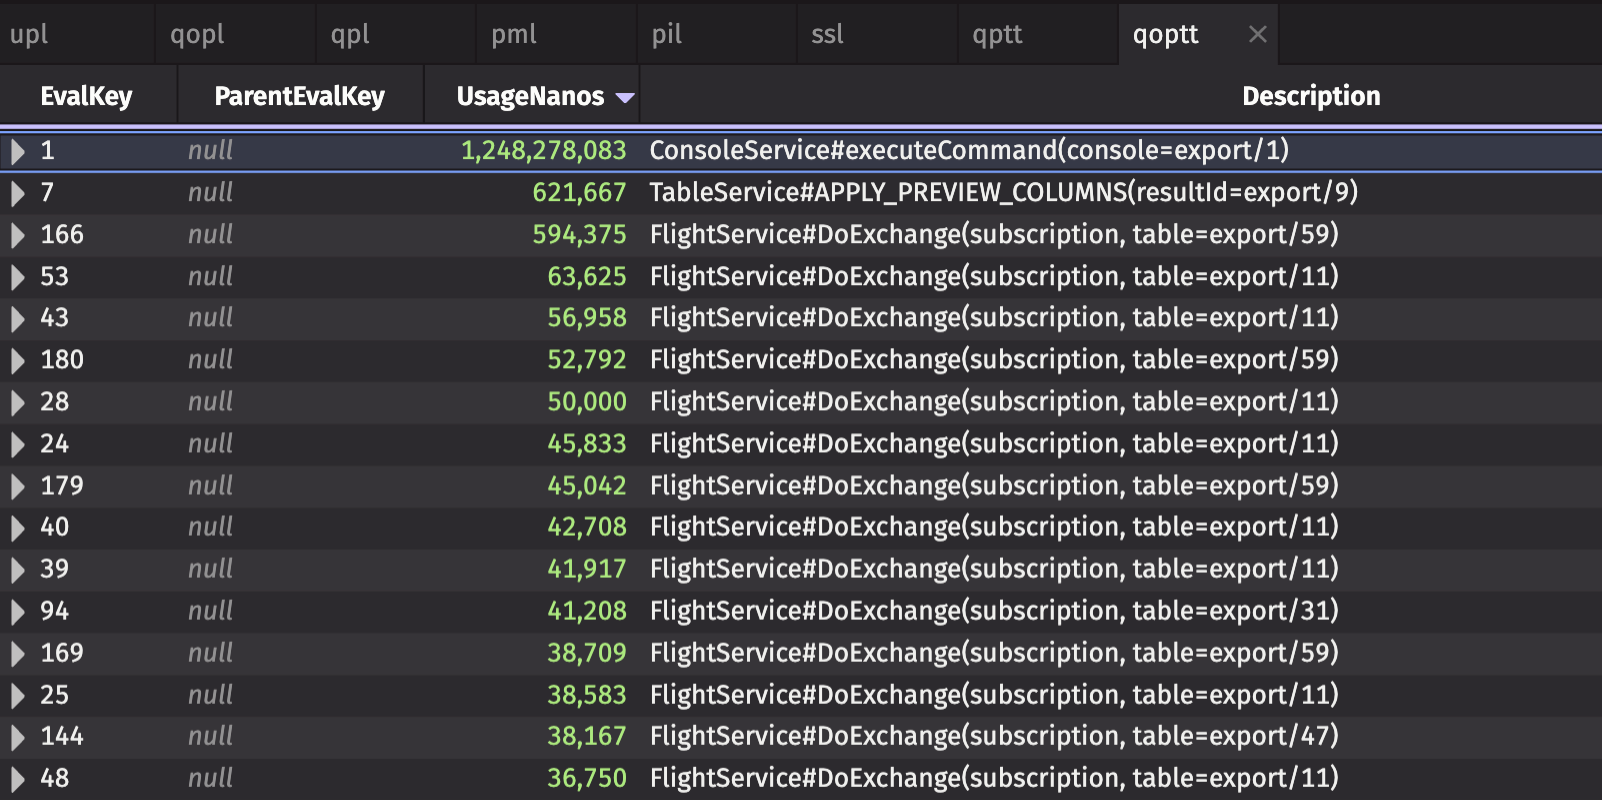
Using performance tree tables
The Query Performance Tree Table and Query Operation Performance Tree Table can be useful tools for pinpointing the cause of unexpected slow performance in your queries. A common use case is to sort the table by the UsageNanos column so that the slowest operations appear at the top of the table:
Expanding the parent rows in the tree table displays the sub-operations that contribute to the parent operation's total time, allowing you to identify specifically which computations and sub-operations could be causing performance issues:
Get help
If you can’t find an obvious cause for an error or slow performance in your query, you may have uncovered a bug. In this case, you should file a bug report. Be sure to include the following with your bug report:
- The version of the Deephaven system.
- The complete stack trace, not just the list of Caused By expressions.
- A code snippet or a description of the query.
- Any logs from your user console or, if running Docker, from your terminal.
- Support logs exported from the browser. In the Settings menu, click the Export Logs button to download a zip with the browser logs and the current state of the application.
You can also get help by asking questions in our Slack Community.