Deephaven Community Core Quickstart for Jupyter
Deephaven Community Core and Jupyter together make a powerful workflow for real-time data science. You can start and use a Deephaven server directly from Jupyter with pip-installed Deephaven. Alternatively, you can use the Deephaven Python client from Jupyter to connect to an already-running Deephaven server. This guide covers pip-installed Deephaven. For the Python client, see Use Deephaven in Jupyter.
1. Install Jupyter
Note
We recommend using a Python virtual environment to decouple and isolate Python installs and associated packages.
Deephaven can operate in JupyterLab or Jupyter Notebook — the choice is yours! Both are installed with pip:
2. Install and launch Deephaven
Note
pip-installed Deephaven requires Java 17 or later and Python 3.9 or later, and your JAVA_HOME environment variable must point to your Java installation. See the pip installation prerequisites for details.
The deephaven-server package enables you to use Deephaven directly from Jupyter. Additionally, the deephaven-ipywidgets package allows Deephaven tables and plots to be rendered in Jupyter. Install them both in the same environment as your Jupyter installation:
Now, start an instance of Jupyter:
Caution
When using Deephaven from Jupyter, you must create a deephaven_server.Server before importing the deephaven package. If you import deephaven first, the import raises a RuntimeError.
The following code block starts a Deephaven server on port 10000 with 4GB of heap memory and anonymous authentication. Run it in your Jupyter instance:
Note
Anonymous authentication provides no application security.
For more advanced configuration options, see the pip installation guide. It includes extra instructions for M2 Macs.
3. Import static and streaming data
Deephaven empowers users to wrangle static and streaming data with ease. It supports ingesting data from CSV files, Parquet files, and Kafka streams.
Load a CSV
Run the code below in a Jupyter cell to ingest a million-row CSV of crypto trades. All you need is a path or URL for the data:
The resulting table can then be displayed using DeephavenWidget from deephaven-ipywidgets. This enables any Deephaven widget to be rendered from within a Jupyter context:
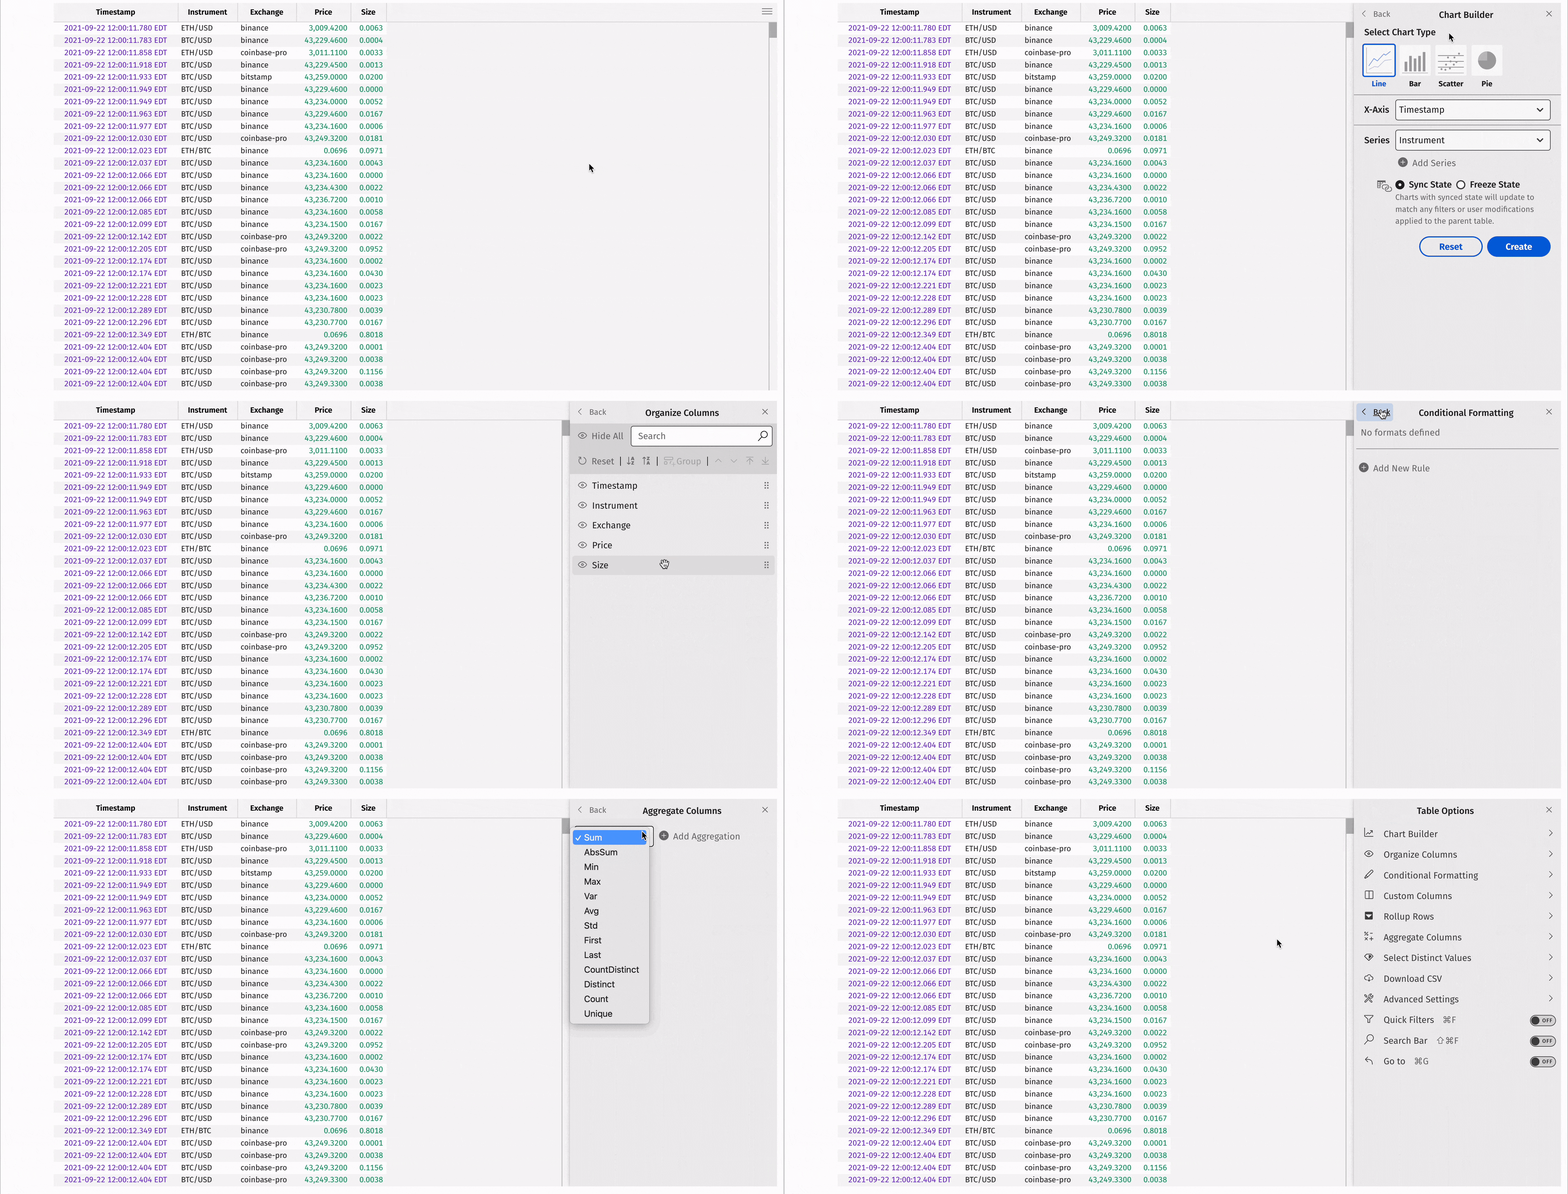
The table widget now in view is highly interactive:
- Click on a table and press Ctrl + F (Windows) or ⌘F (Mac) to open quick filters.
- Click the funnel icon in the filter field to create sophisticated filters or use auto-filter UI features.
- Hover over column headers to see data types.
- Right-click headers to access more options, like adding or changing sorts.
- Click the Table Options hamburger menu at right to plot from the UI, create and manage columns, and download CSVs.
Replay historical data
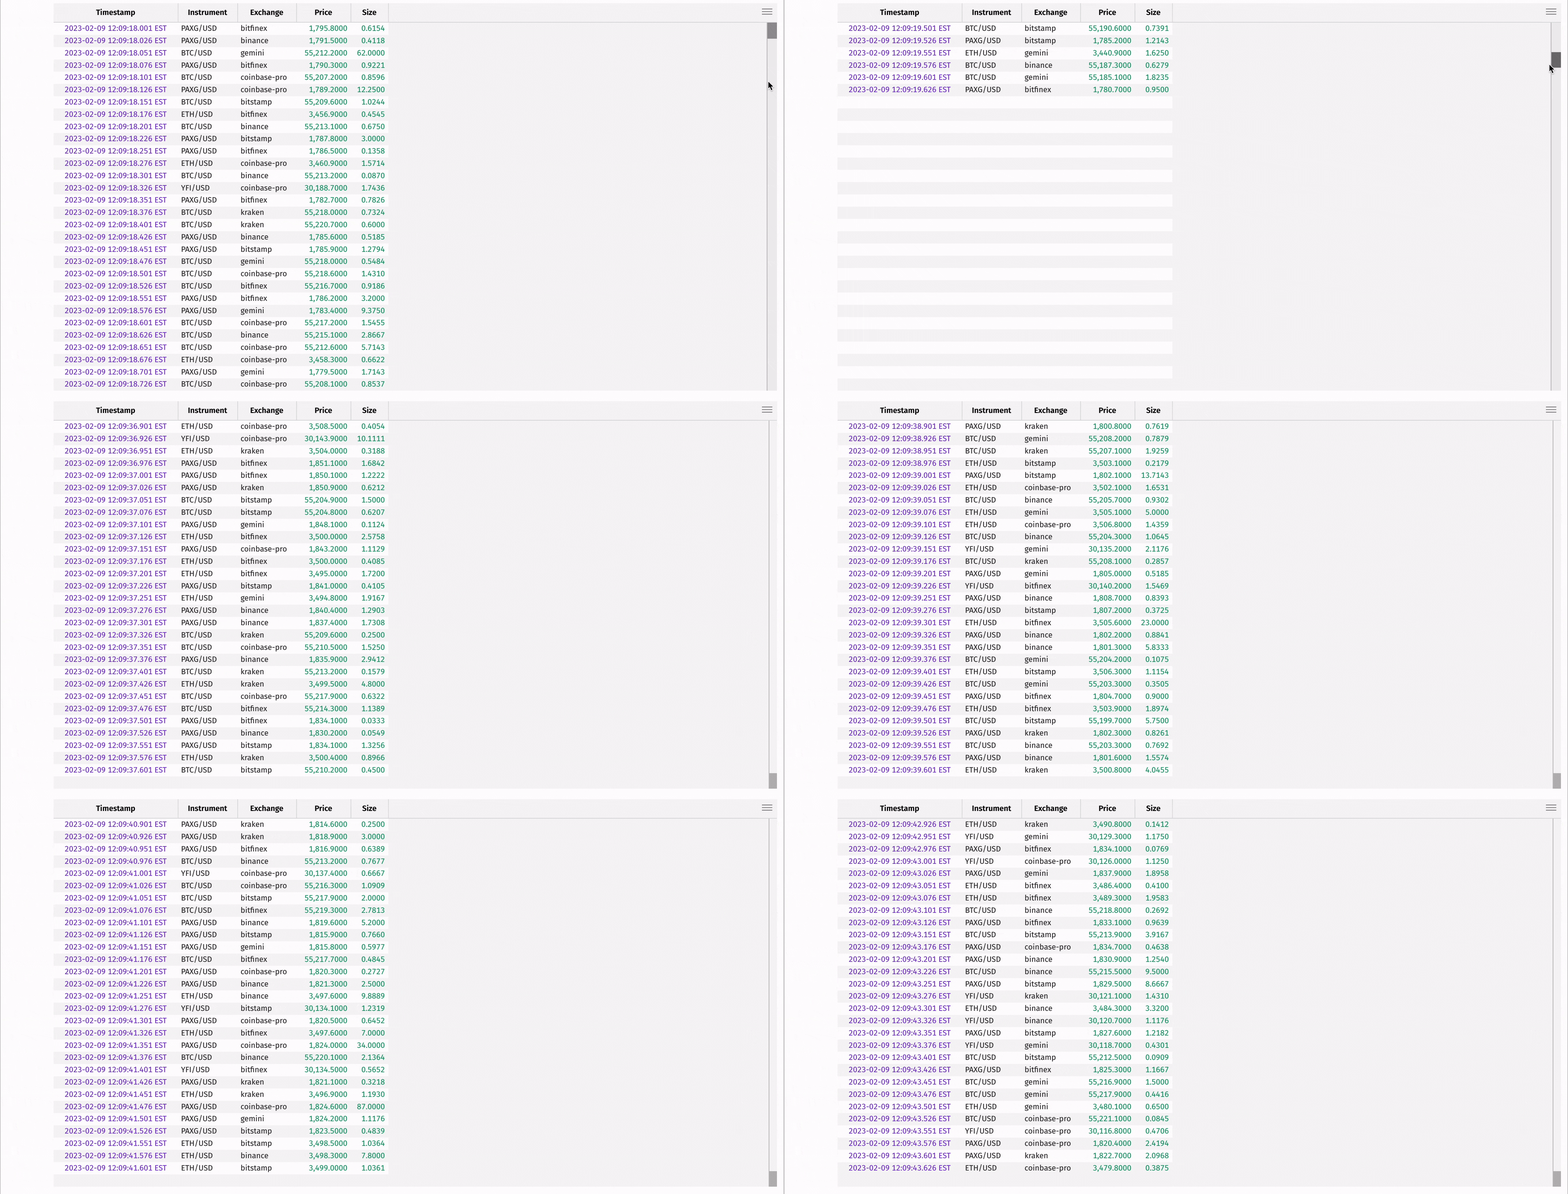
Ingesting real-time data is one of Deephaven's core strengths, and you can learn more about supported formats from the links in the section above. However, streaming pipelines can be complicated to set up and are outside the scope of this discussion. For a streaming data example, this guide uses Deephaven's TableReplayer to replay historical cryptocurrency data back in real time.
The following code takes fake historical crypto trade data from a CSV file and replays it in real time based on timestamps. This is only one of multiple ways to create real-time data in just a few lines of code. Replaying historical data is a great way to test real-time algorithms before deployment into production.
4. Work with Deephaven tables
In Deephaven, static and dynamic data are represented as tables. New tables can be derived from parent tables, and data efficiently flows from parents to their dependents. See the concept guide on the table update model if you're interested in what's under the hood.
Deephaven represents data transformations as operations on tables. This is a familiar paradigm for data scientists using pandas, Polars, R, MATLAB and more. Deephaven's table operations are special — they are indifferent to whether the underlying data sources are static or streaming! This means that code written for static data works seamlessly on live data.
There are many table operations to cover, so this guide keeps it short and gives you the highlights.
Manipulating data
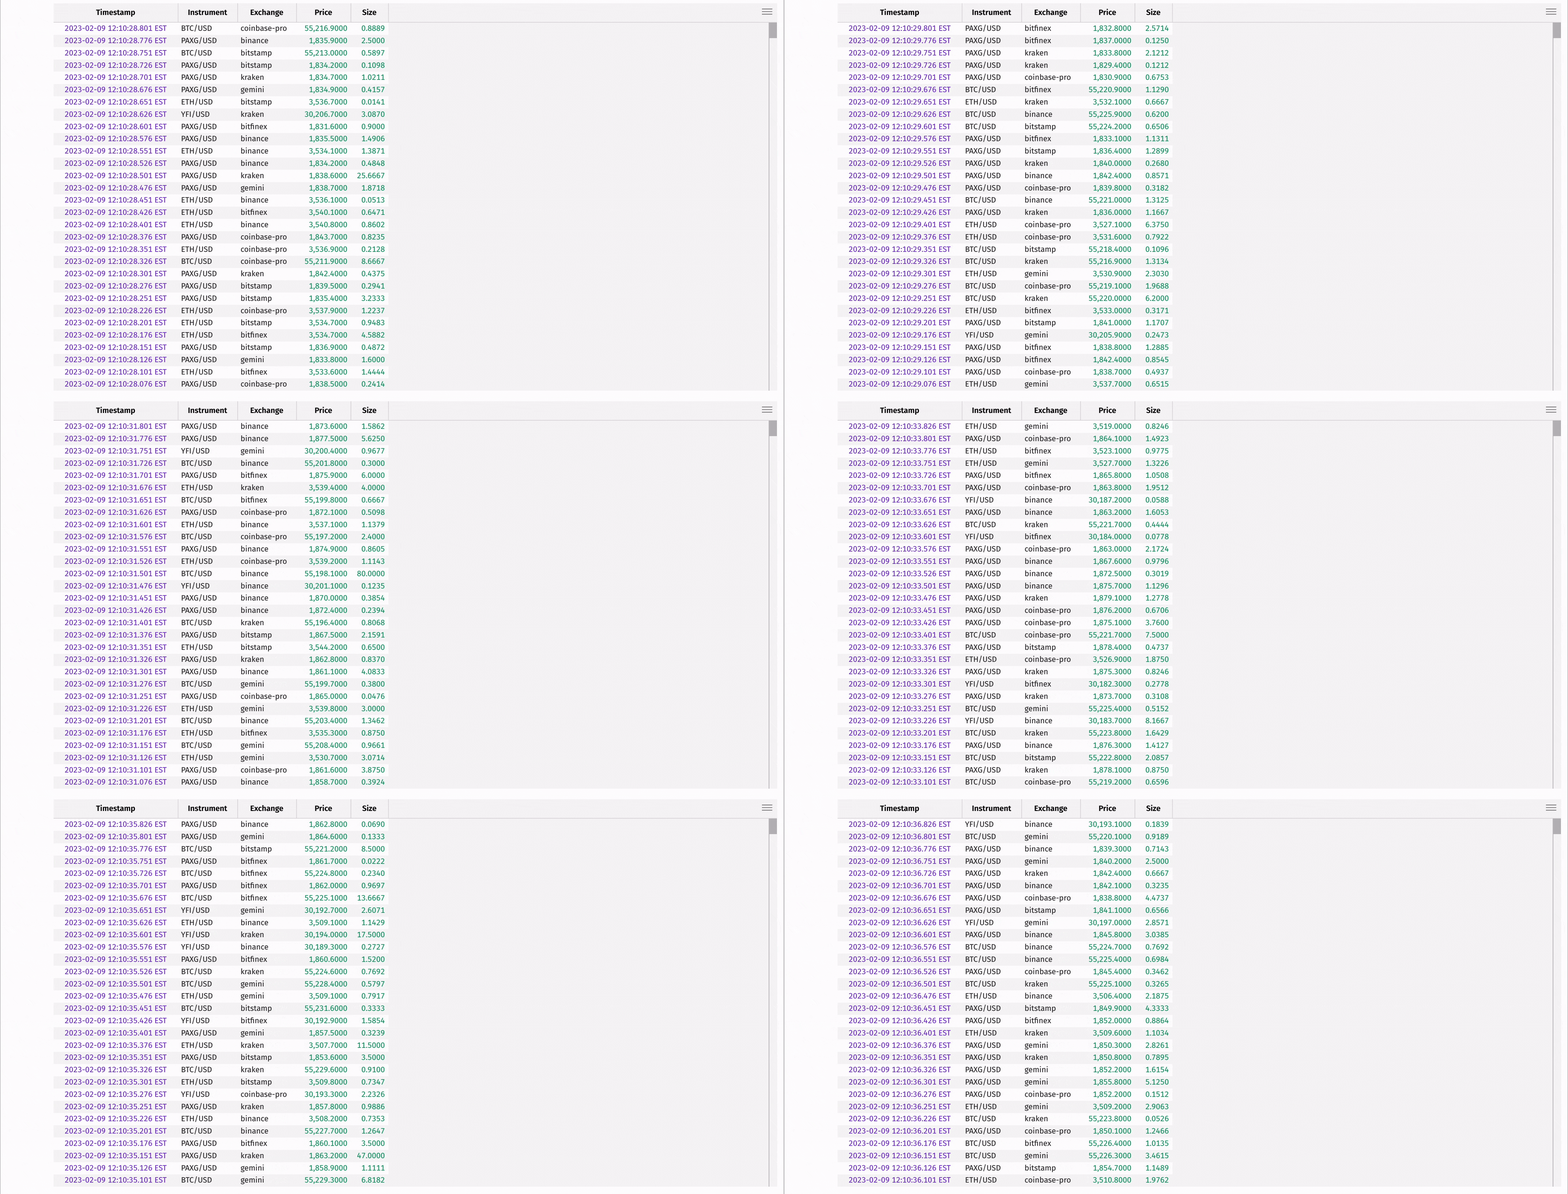
First, reverse the ticking (live-updating) table with reverse so that the newest data appears at the top:
Tip
Many table operations can also be performed from the UI. For example, right-click on a column header in the UI and choose Reverse Table.
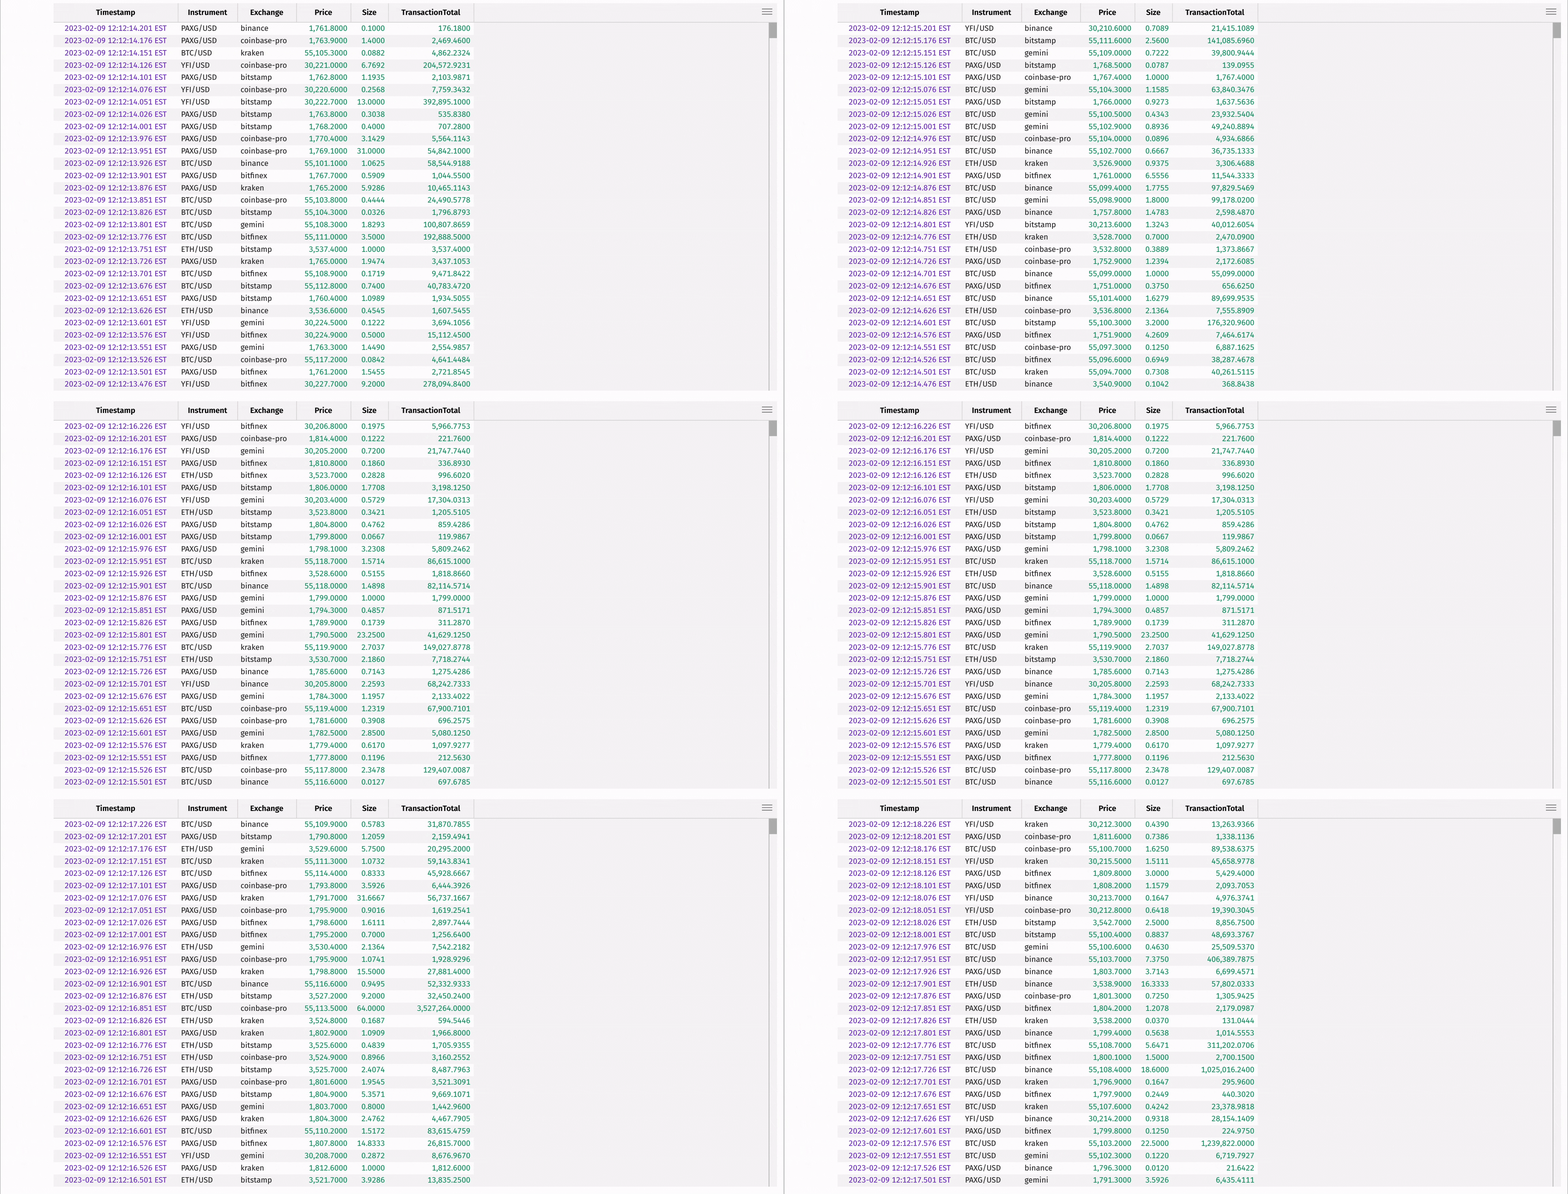
Add a column with update:
Use select or view to pick out particular columns:
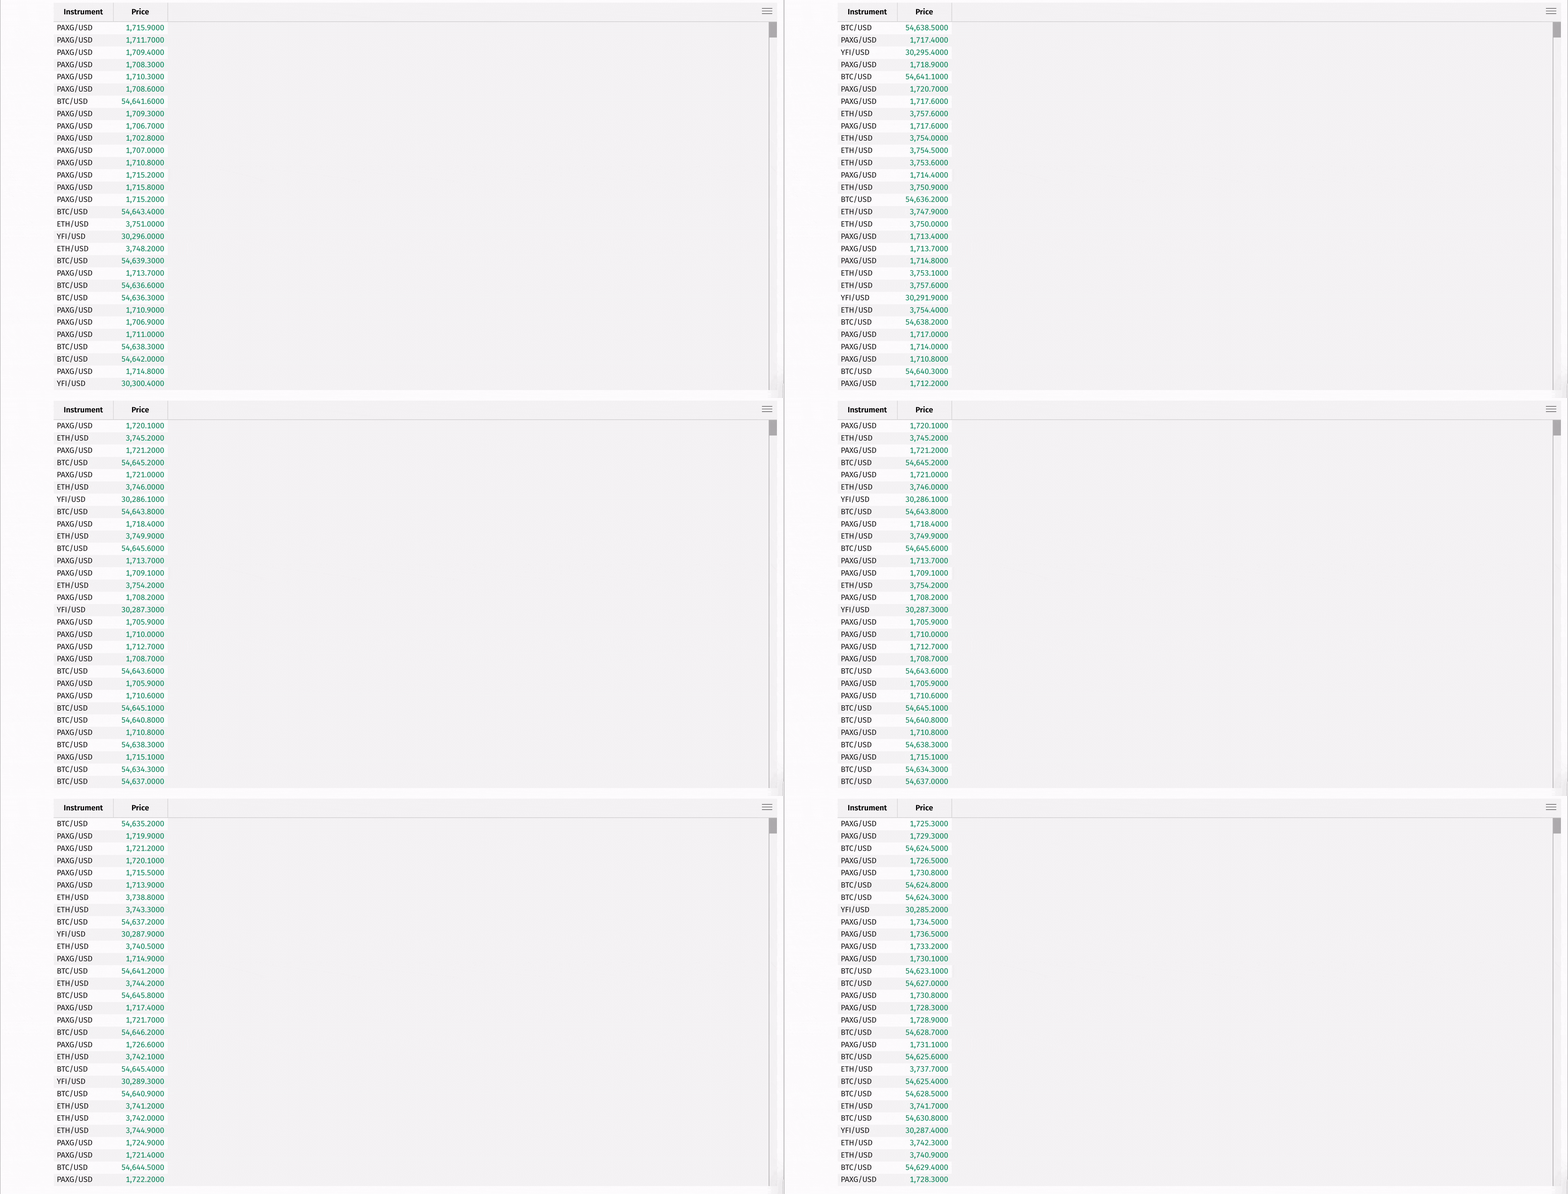
Remove columns with drop_columns:
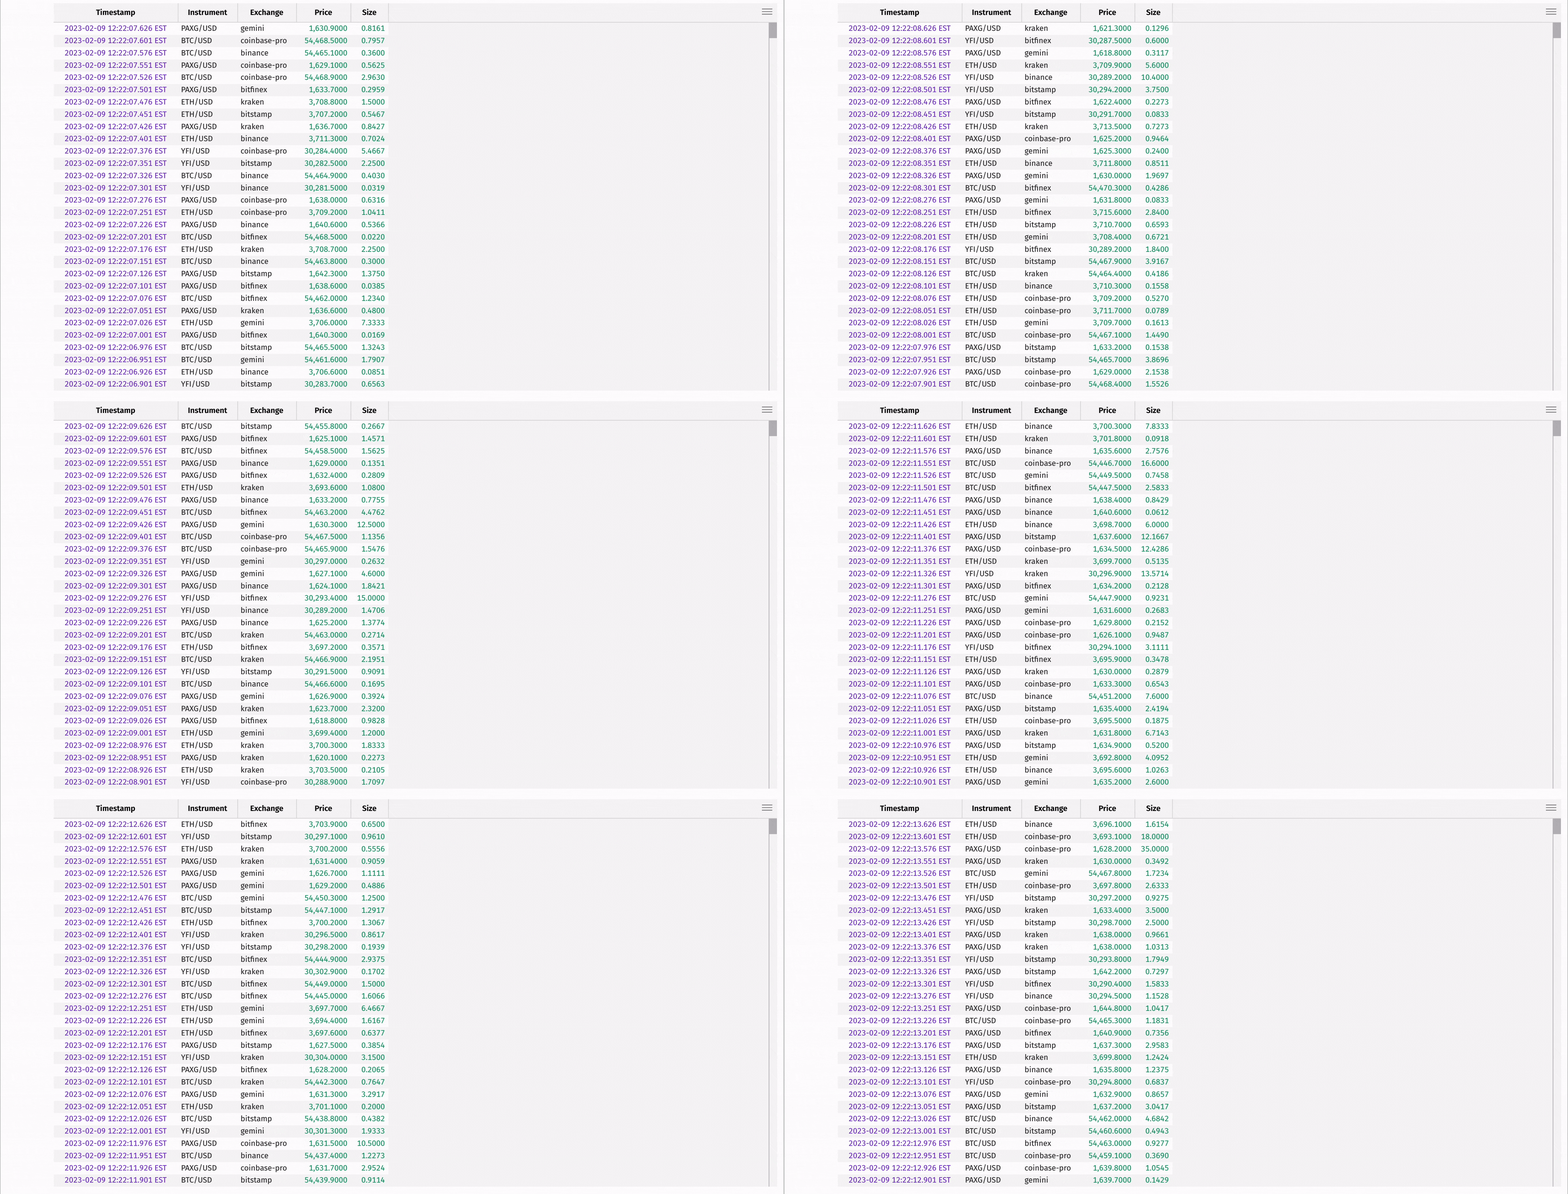
Next, Deephaven offers many operations for filtering tables. These include where, where_one_of, where_in, where_not_in, and more.
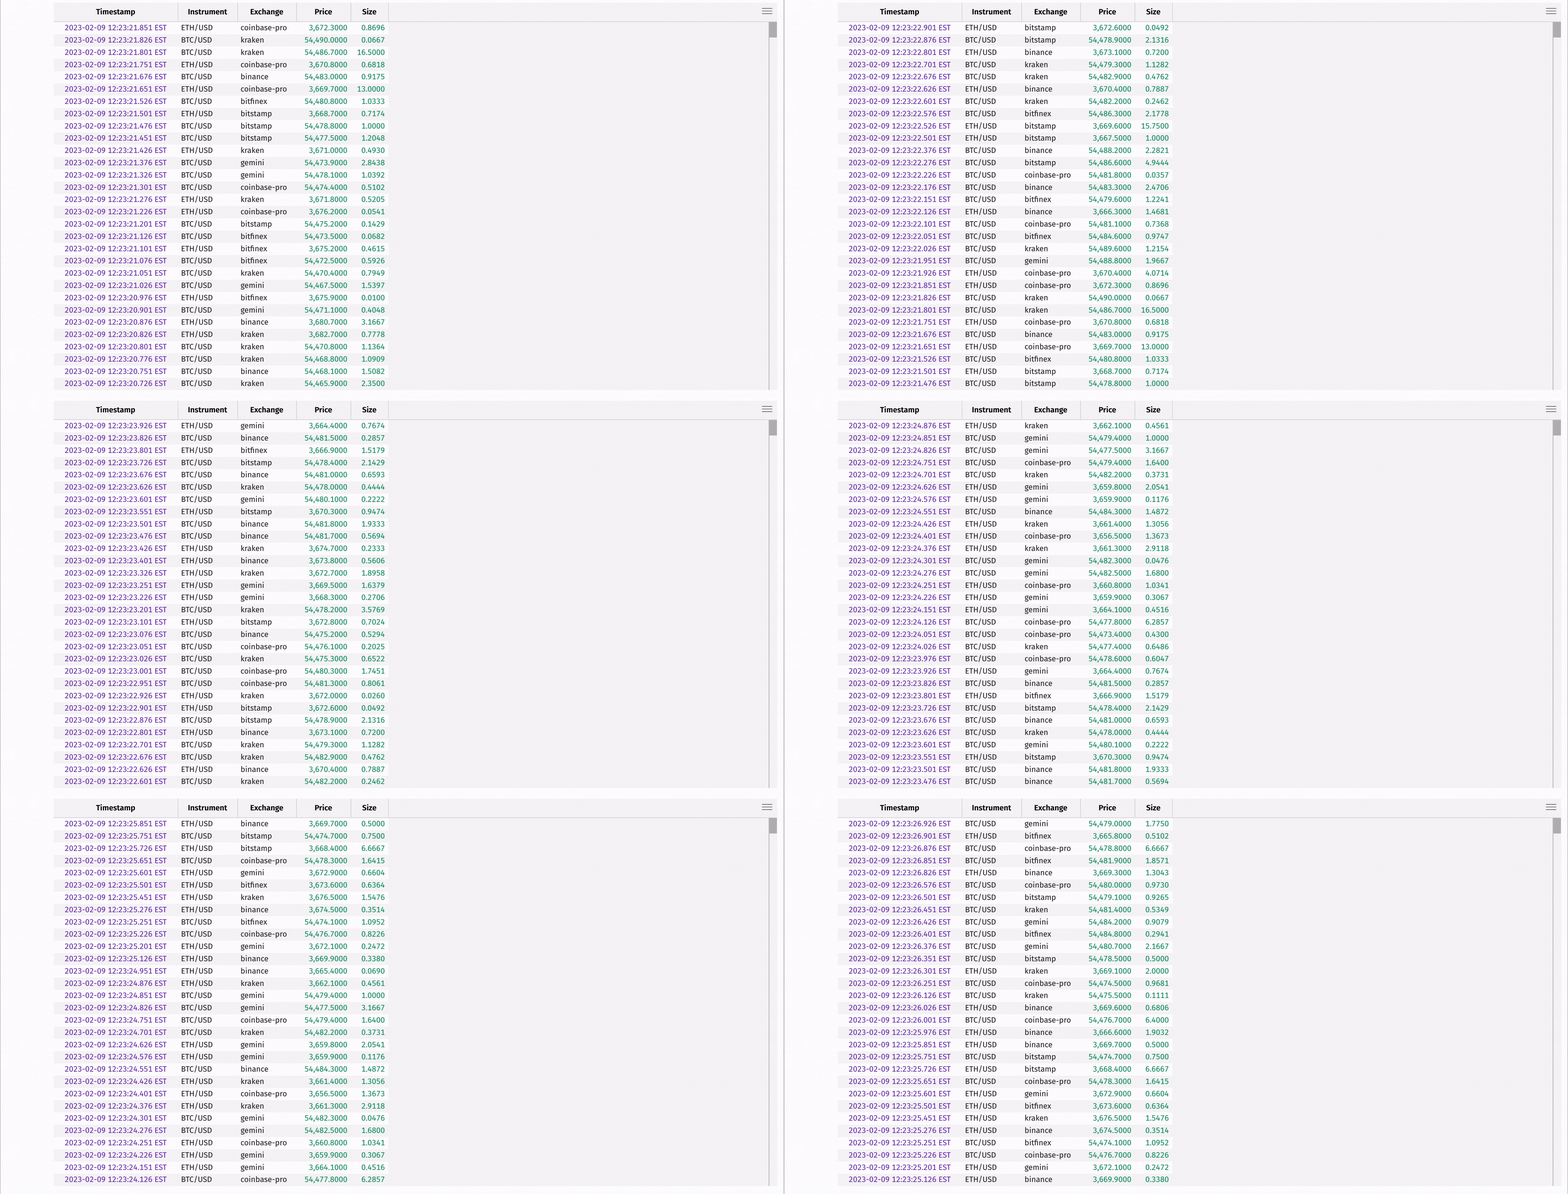
The following code uses where and where_one_of to filter for only Bitcoin transactions, and then for Bitcoin and Ethereum transactions:
Aggregating data
Deephaven's dedicated aggregations suite provides several table operations that enable efficient column-wise aggregations and support aggregations by group.
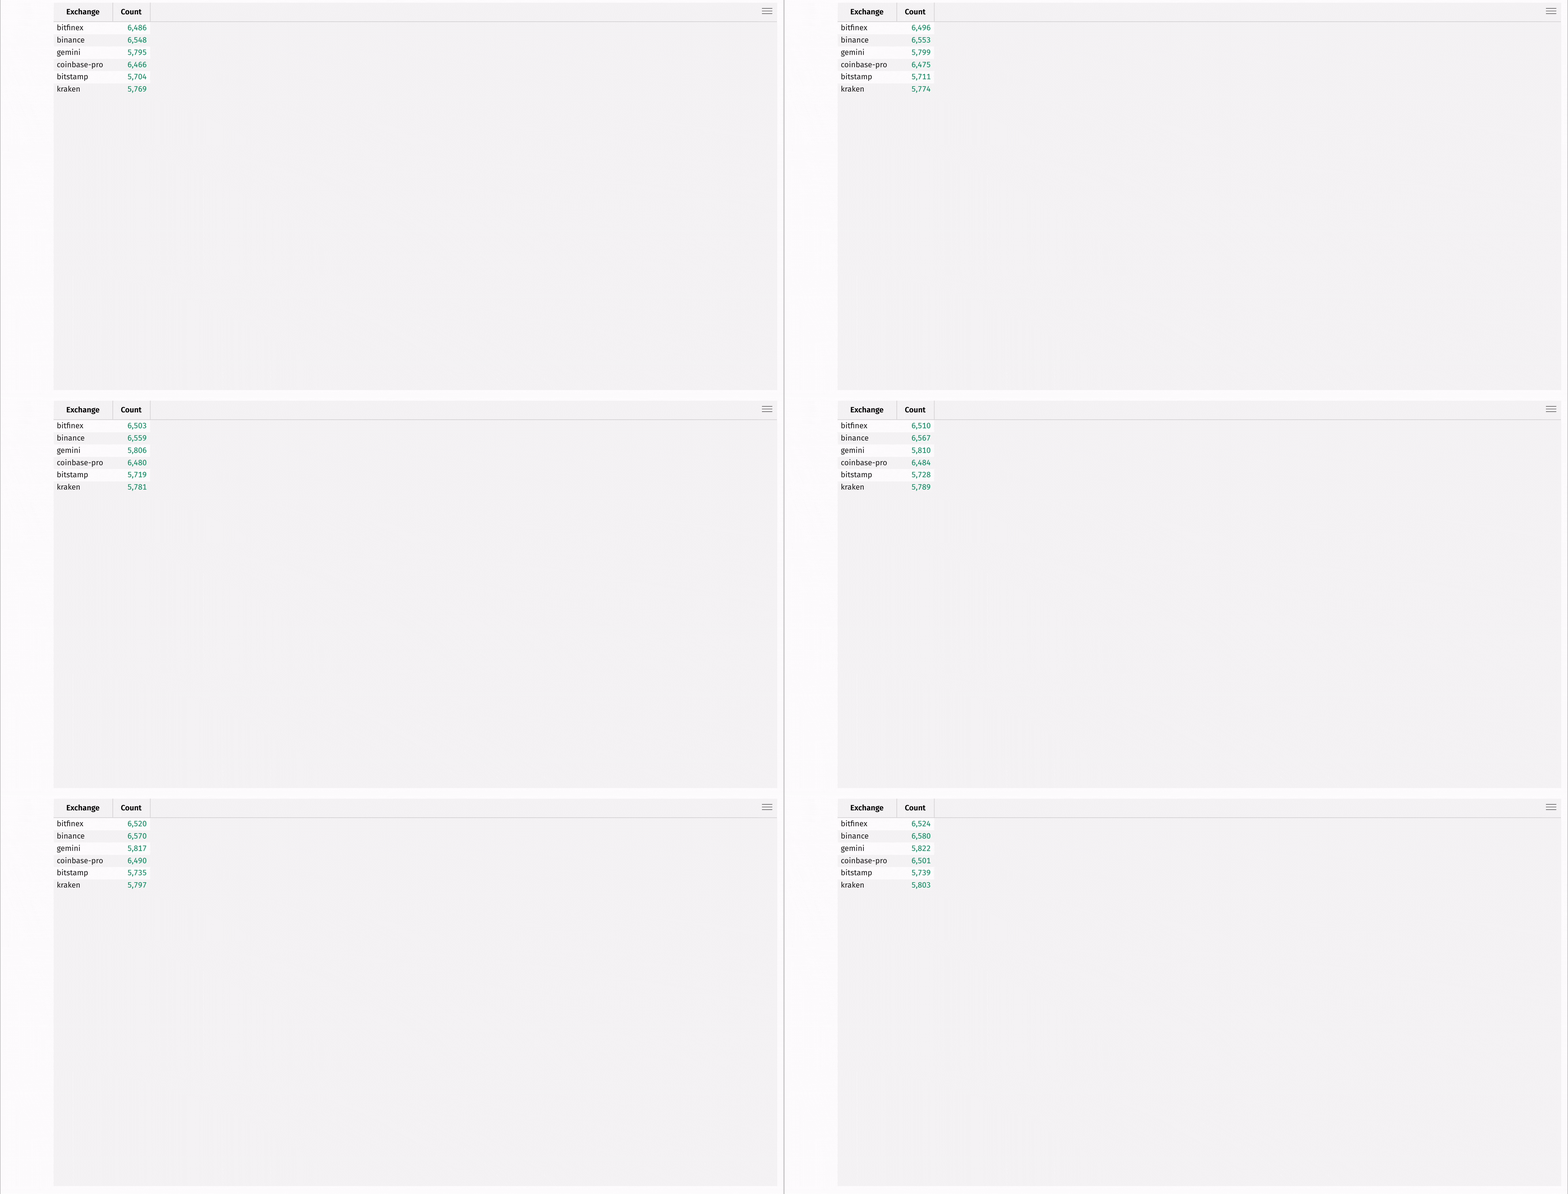
Use count_by to count the number of transactions from each exchange:
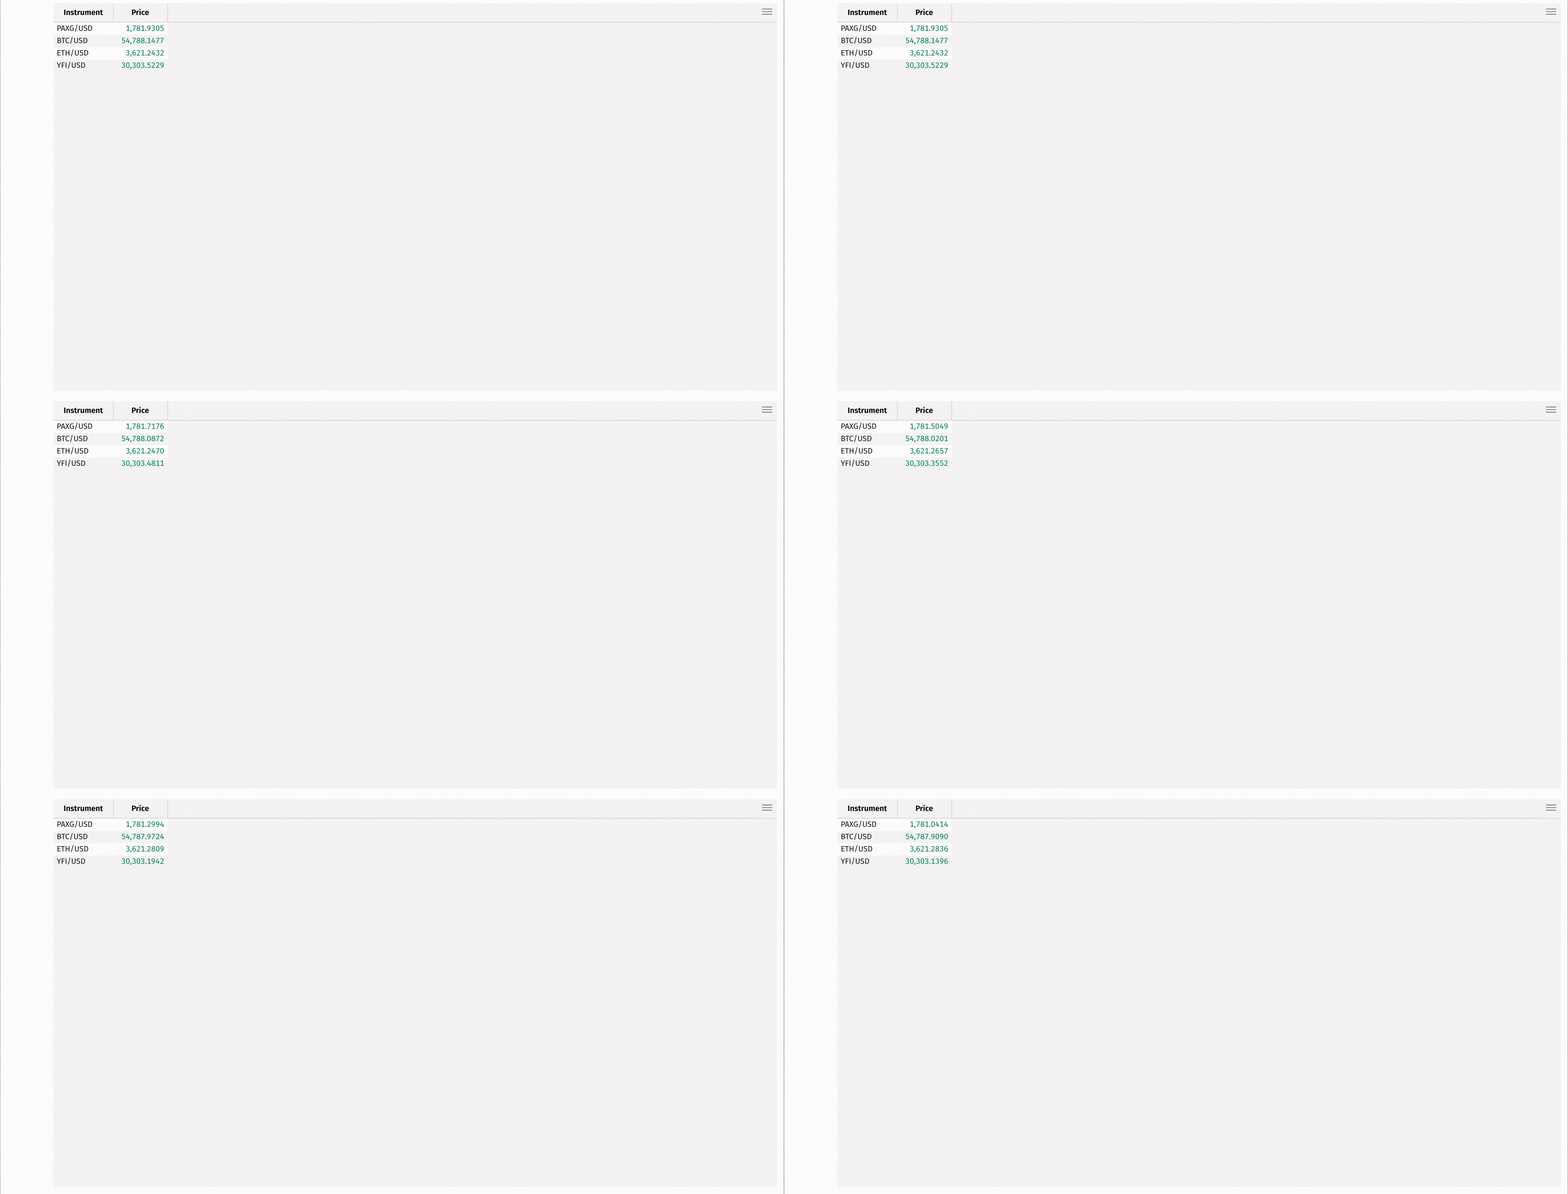
Then, get the average price for each instrument with avg_by:
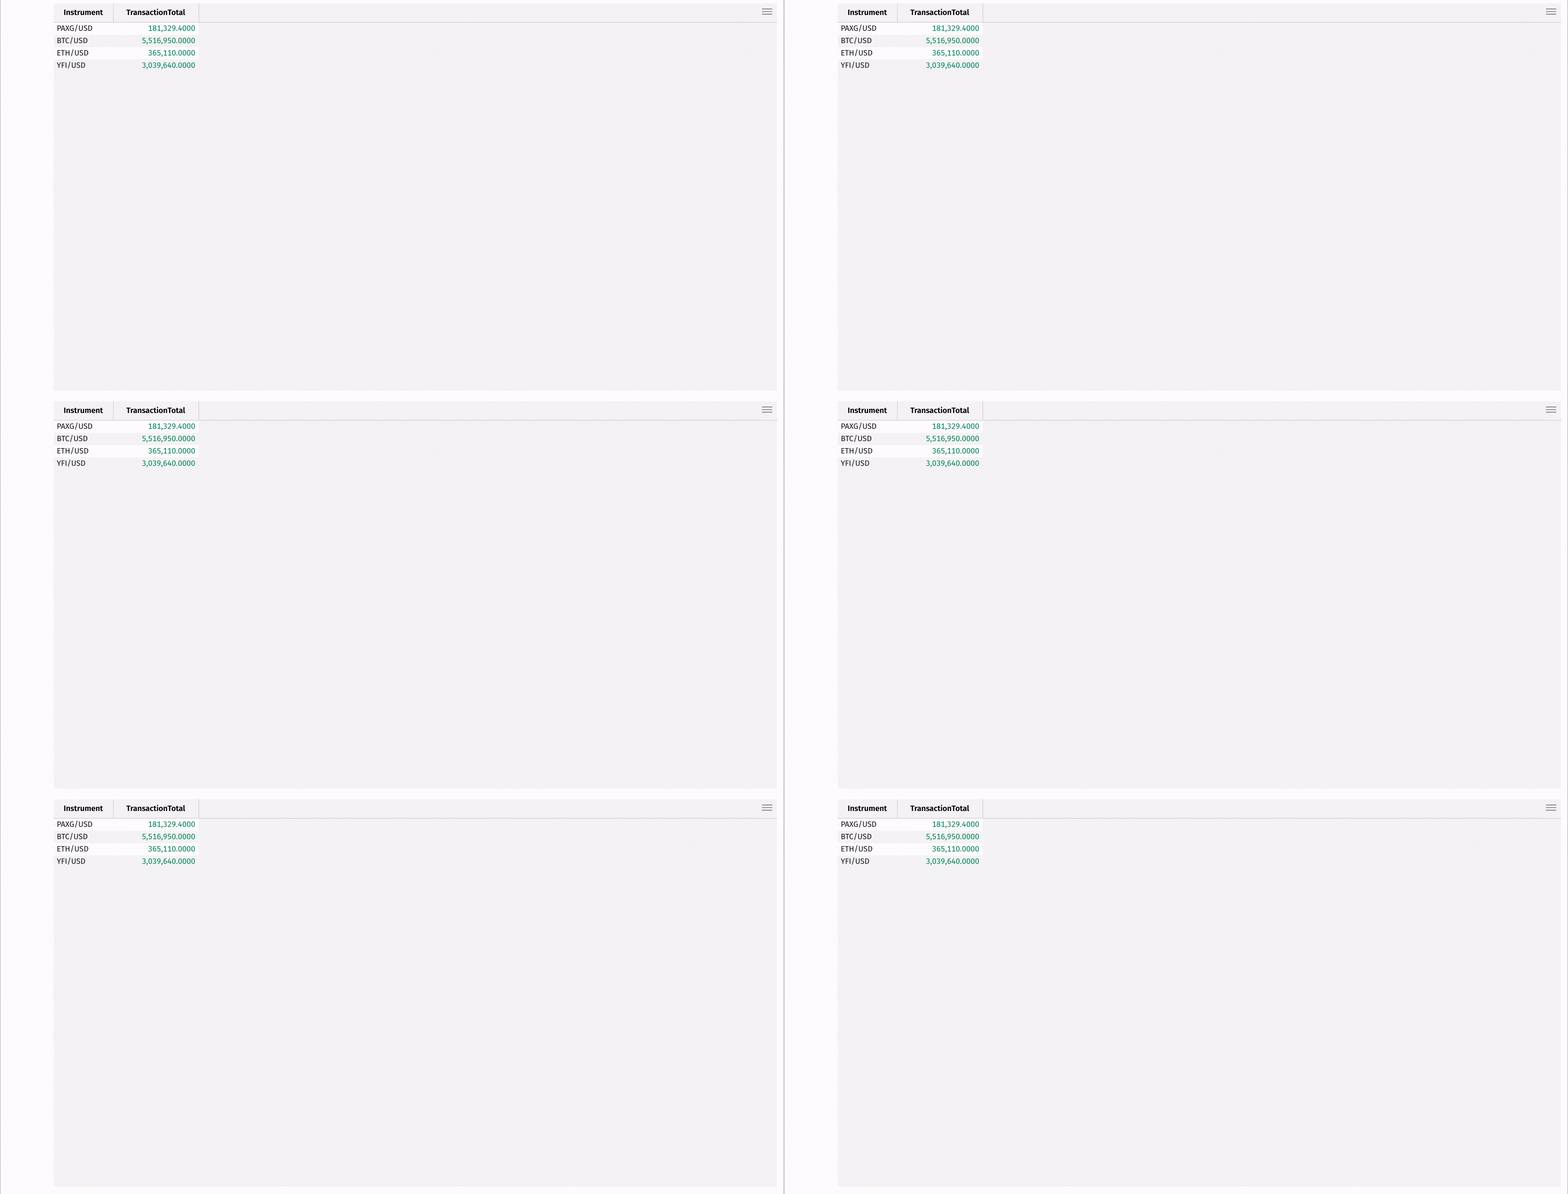
Find the largest transaction per instrument with max_by:
While dedicated aggregations are powerful, they only enable you to perform one aggregation at a time. However, you often need to perform multiple aggregations on the same data. For this, Deephaven provides the agg_by table operation and the deephaven.agg Python module.
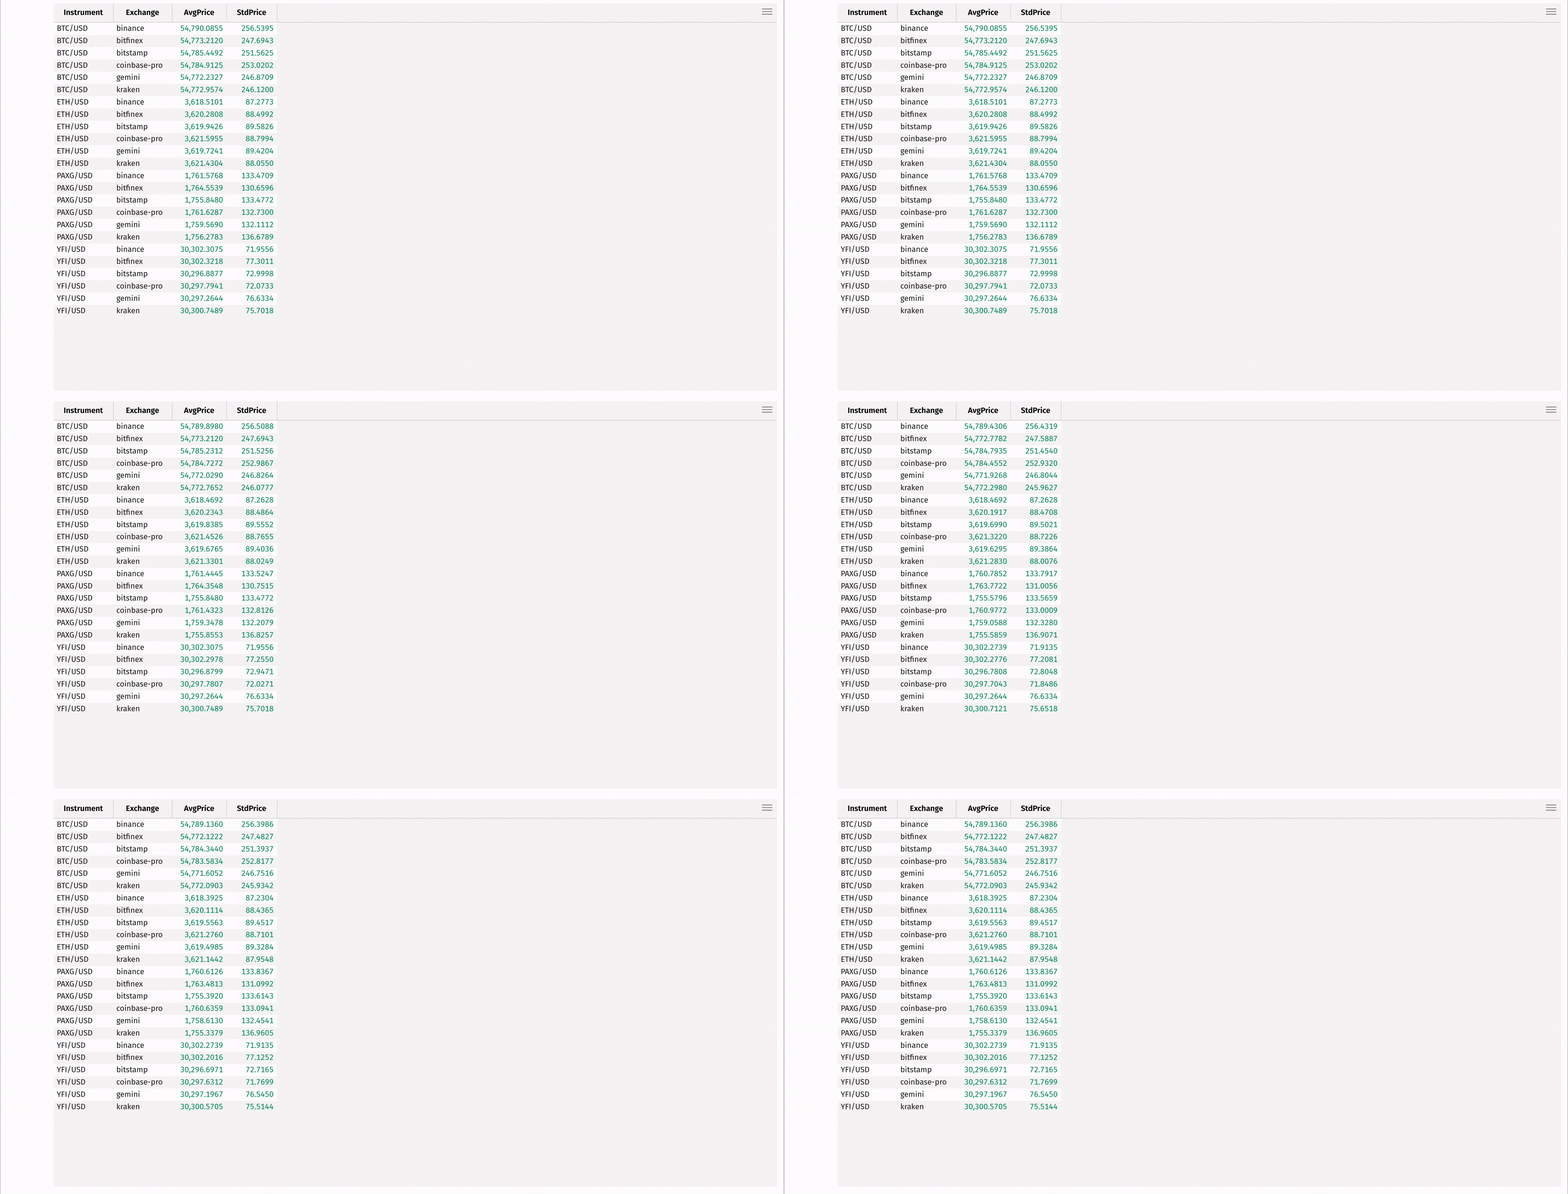
First, use agg_by to compute the mean and standard deviation of each instrument's price, grouped by exchange:
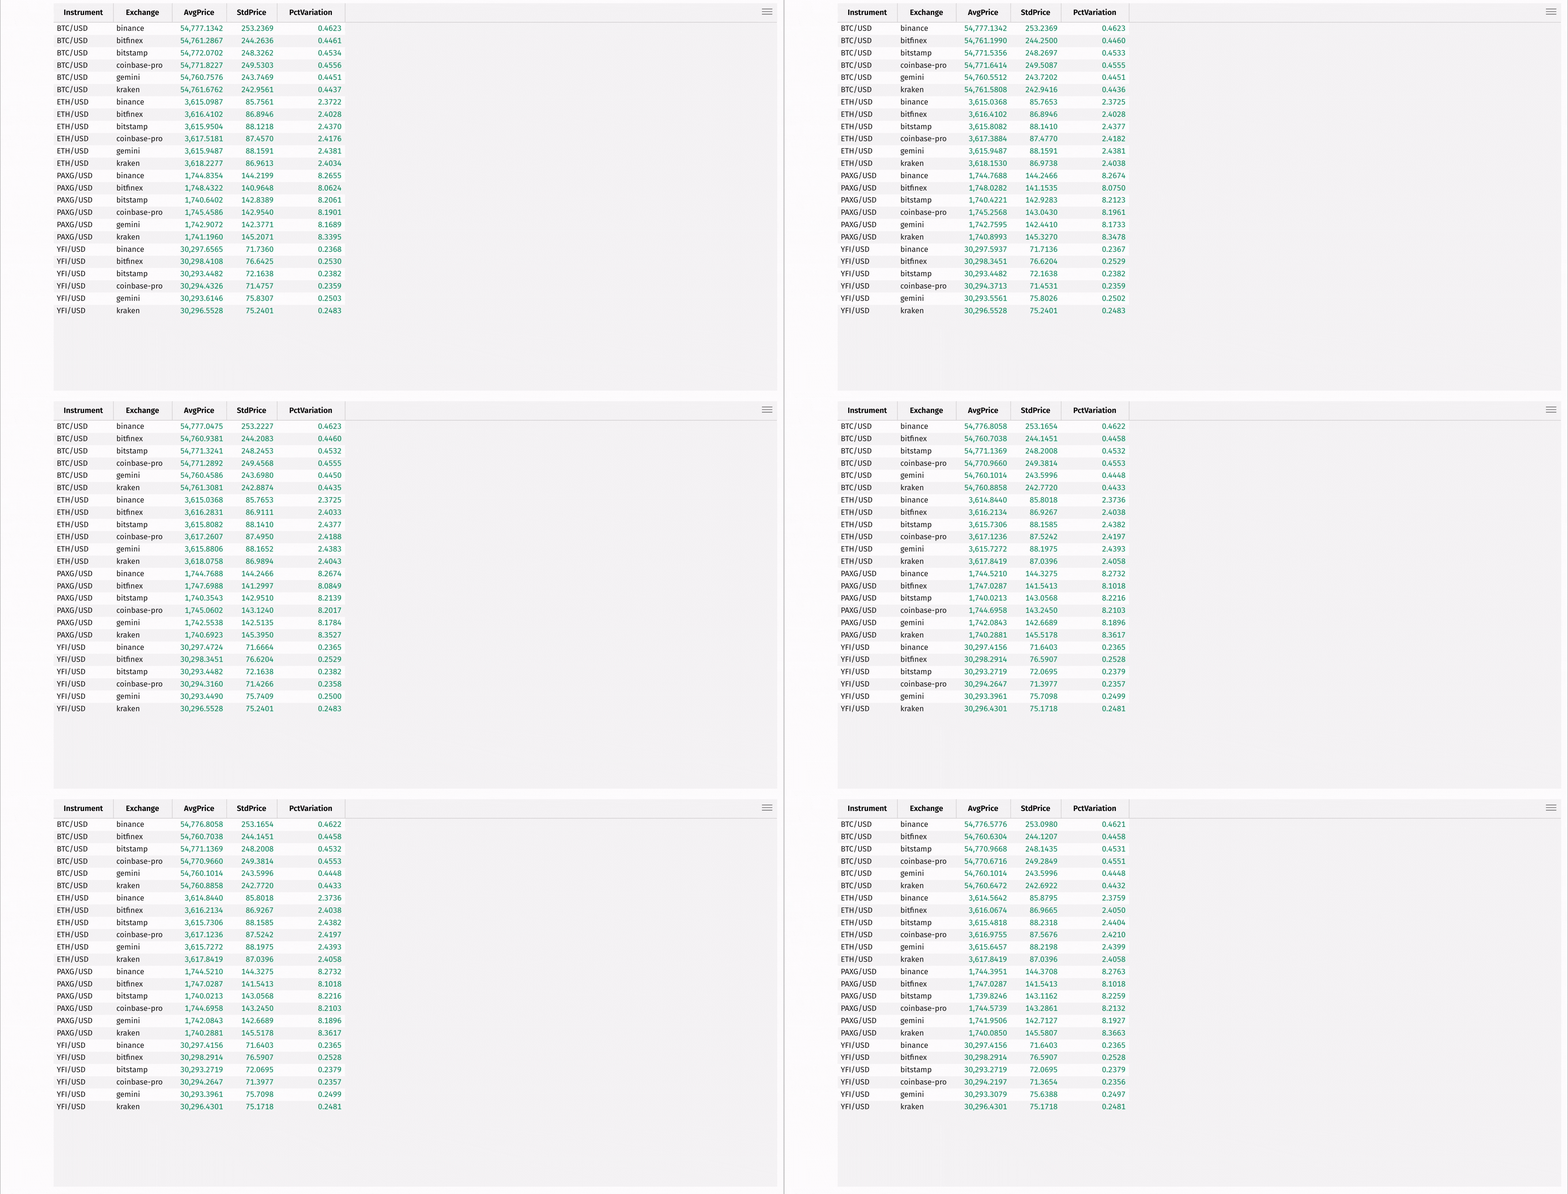
Then, add a column containing the coefficient of variation for each instrument, measuring the relative risk of each:
Finally, create a minute-by-minute Open-High-Low-Close table using the lowerBin built-in function along with first, max_, min_, and last:
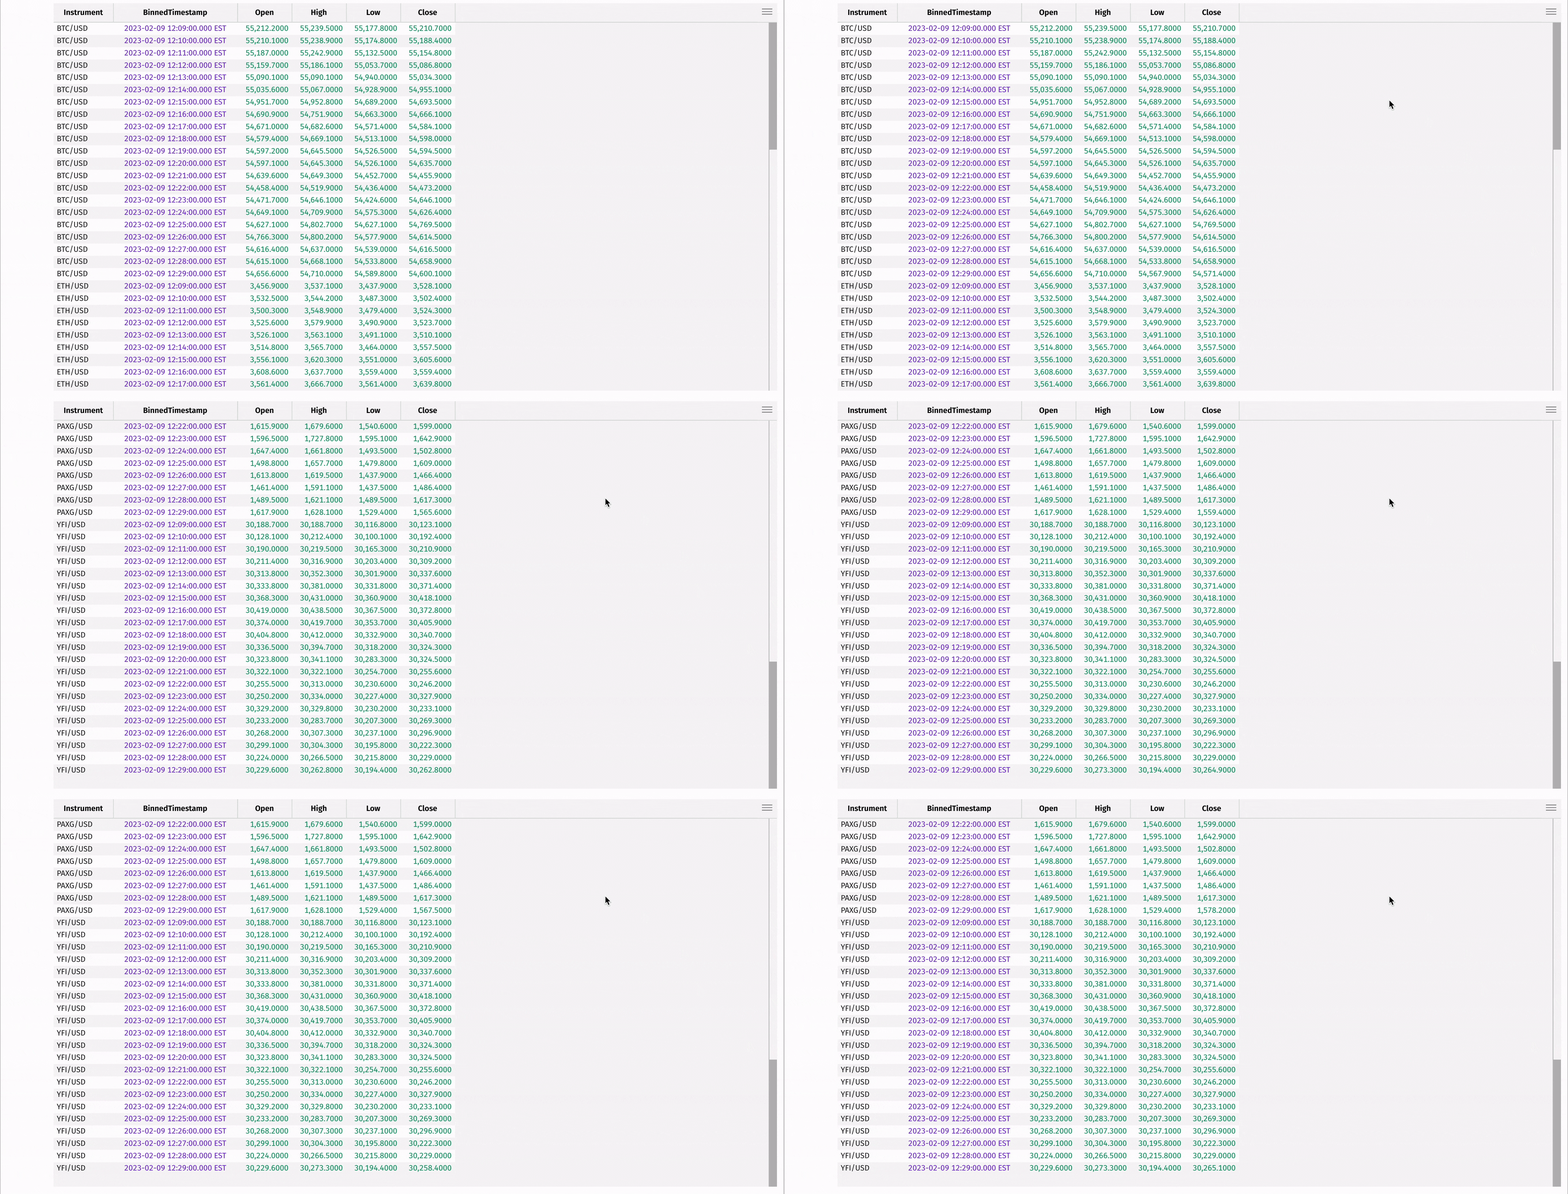
You may want to perform window-based calculations, compute moving or cumulative statistics, or look at pair-wise differences. Deephaven's update_by table operation and the deephaven.updateby Python module are the right tools for the job.
Compute the moving average and standard deviation of each instrument's price using rolling_avg_time and rolling_std_time:
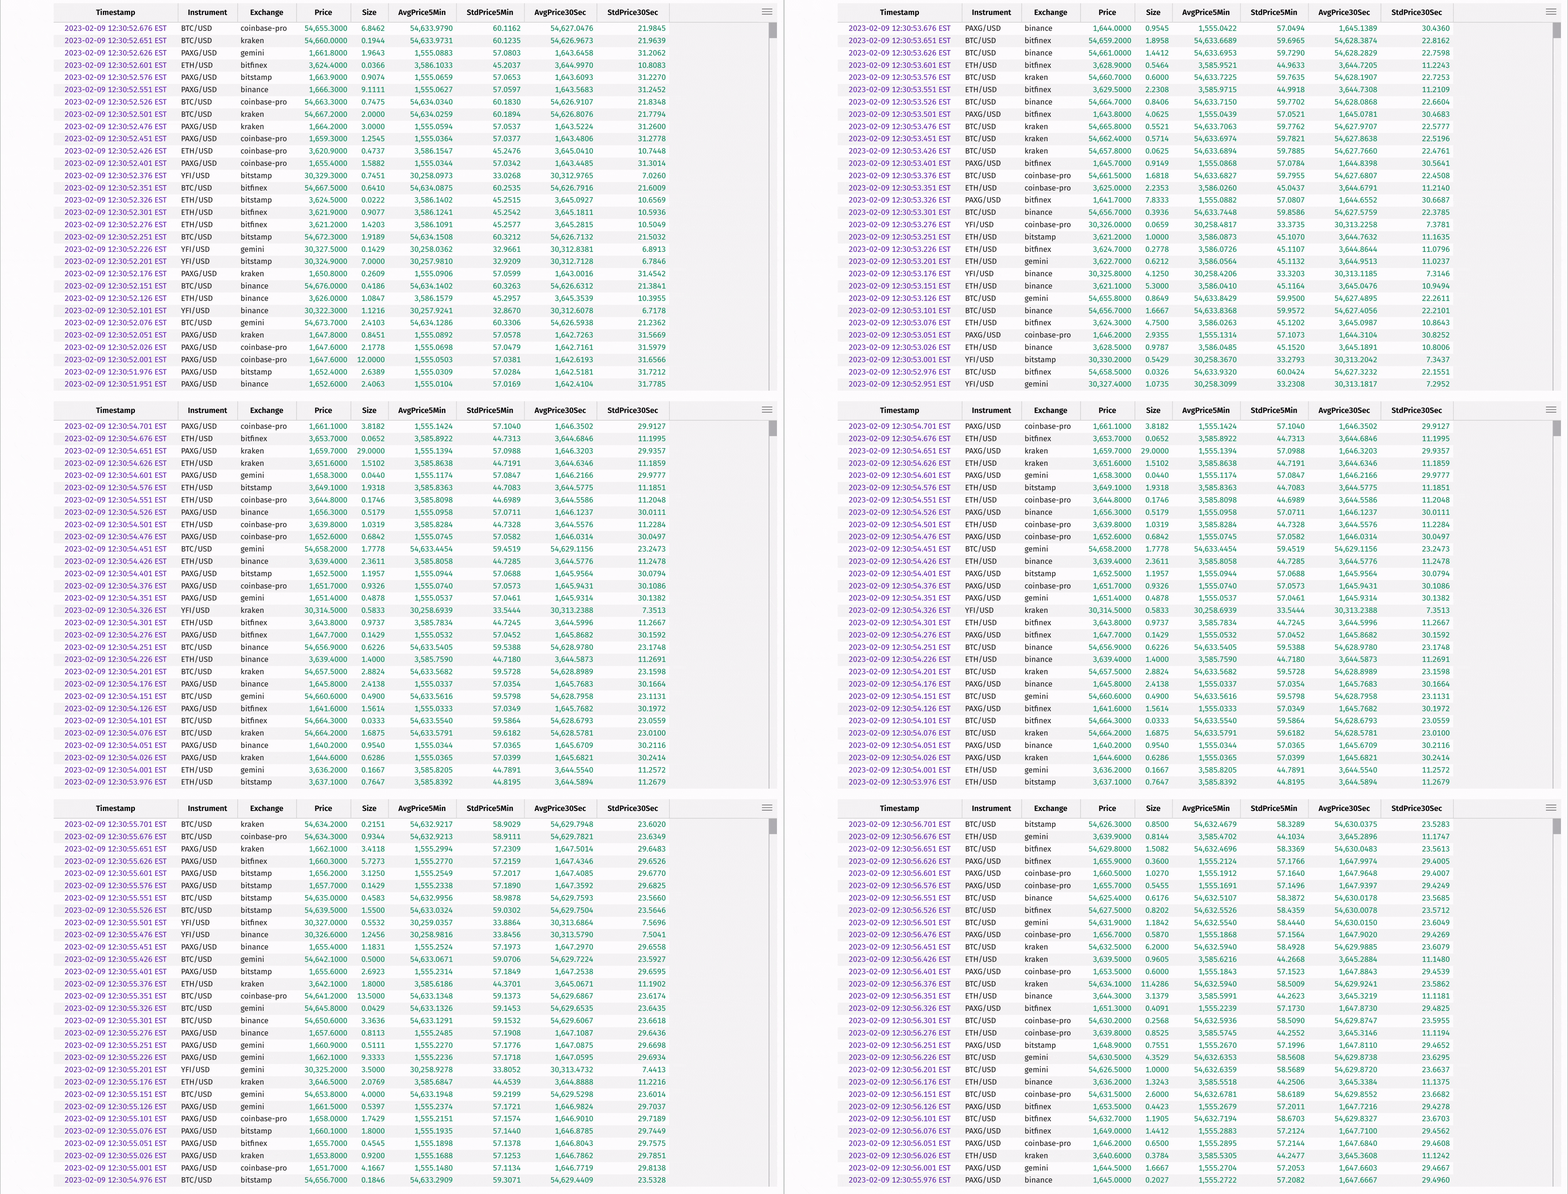
These statistics can be used to determine "extreme" instrument prices, where the instrument's price is significantly higher or lower than the rolling average over the window that ends at that row's timestamp:
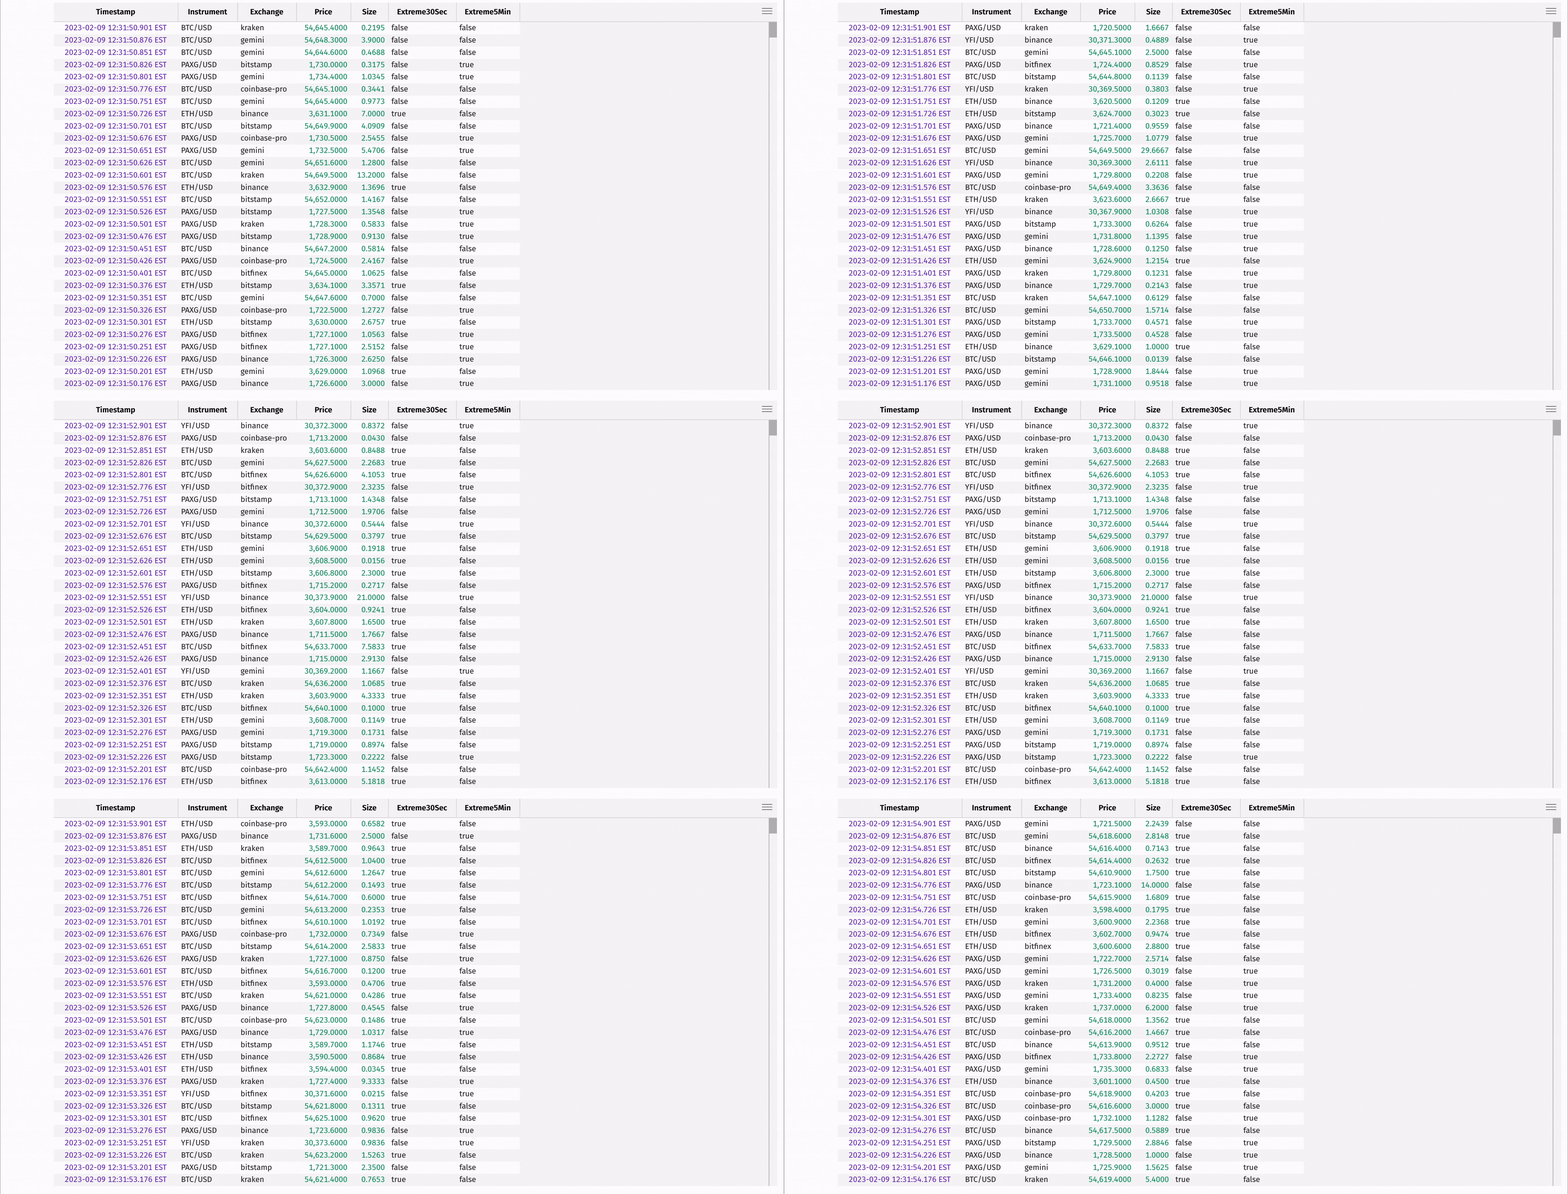
There's a lot more to update_by. See the user guide for more information.
Combining tables
Combining datasets can often yield powerful insights. Deephaven offers two primary ways to combine tables — the merge and join operations.
The merge operation stacks tables on top of one another. This is ideal when several tables have the same schema. They can be static, ticking, or a mix of both:
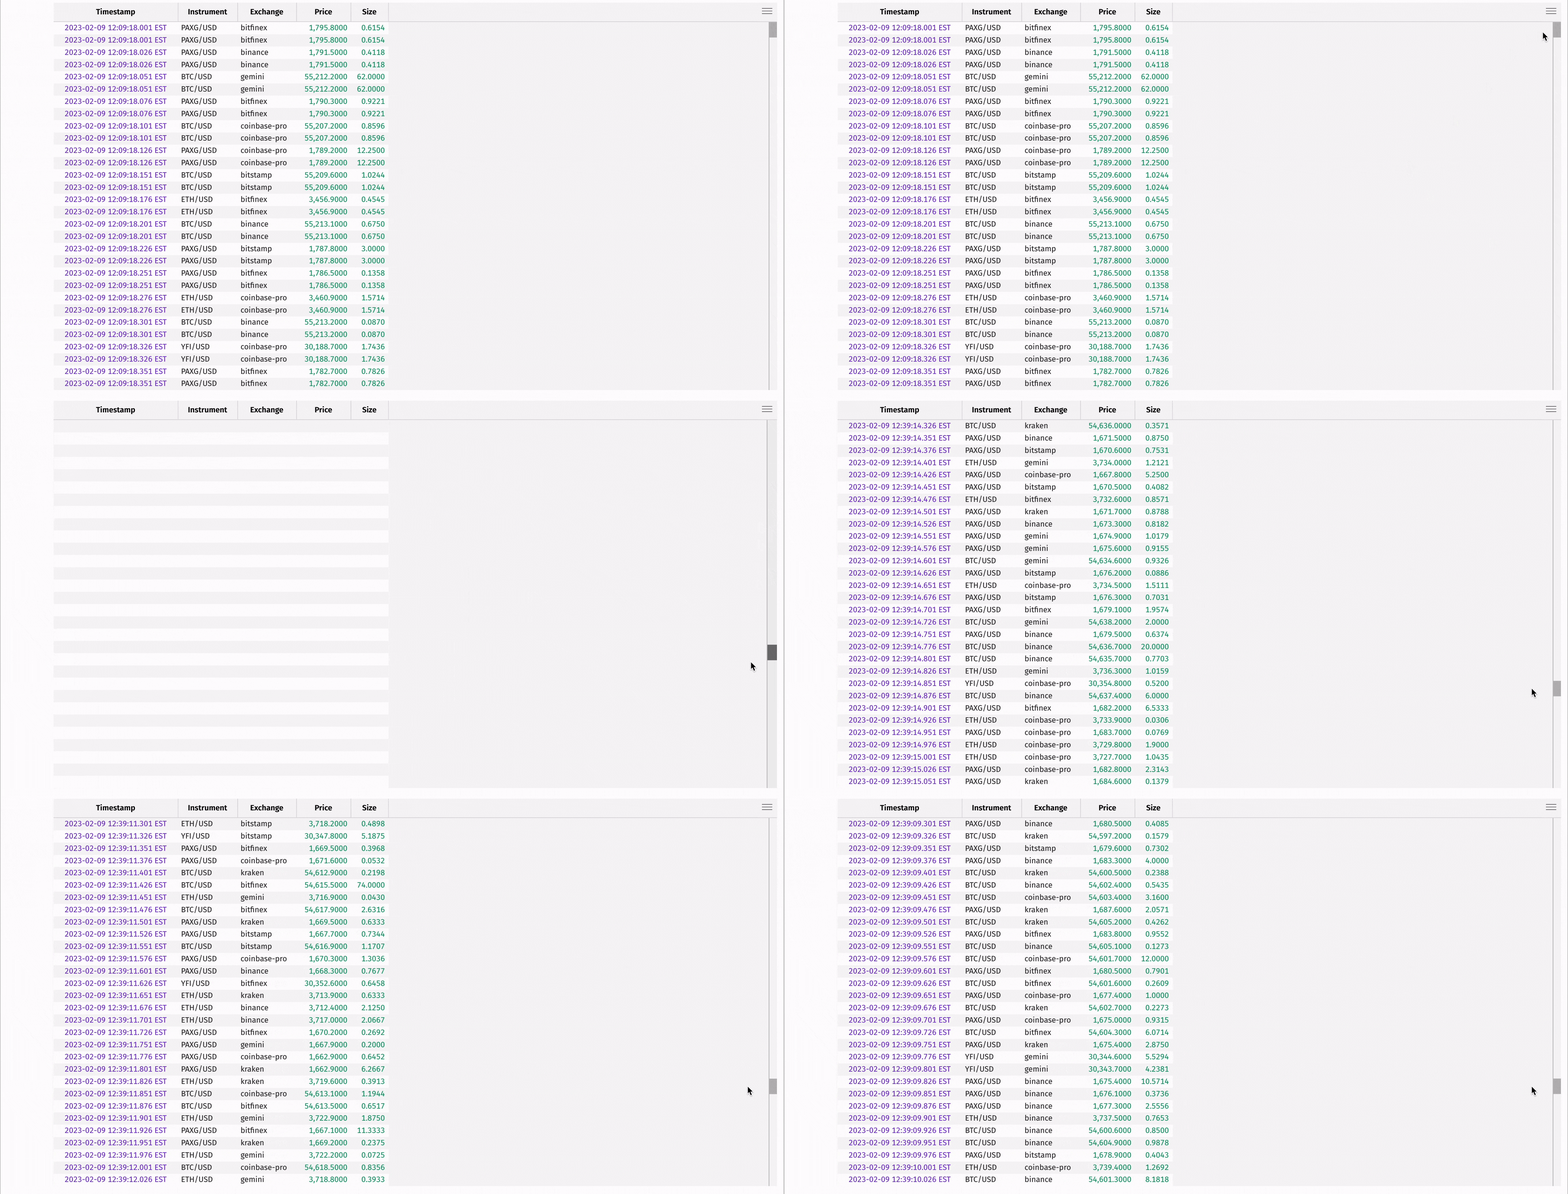
The ubiquitous join operation is used to combine tables based on columns that they have in common. Deephaven offers many variants of this operation, such as join, natural_join, exact_join, and many more.
For example, read in an older dataset containing price data on the same coins from the same exchanges. Then, use join to combine the aggregated prices to see how current prices compare to those in the past:
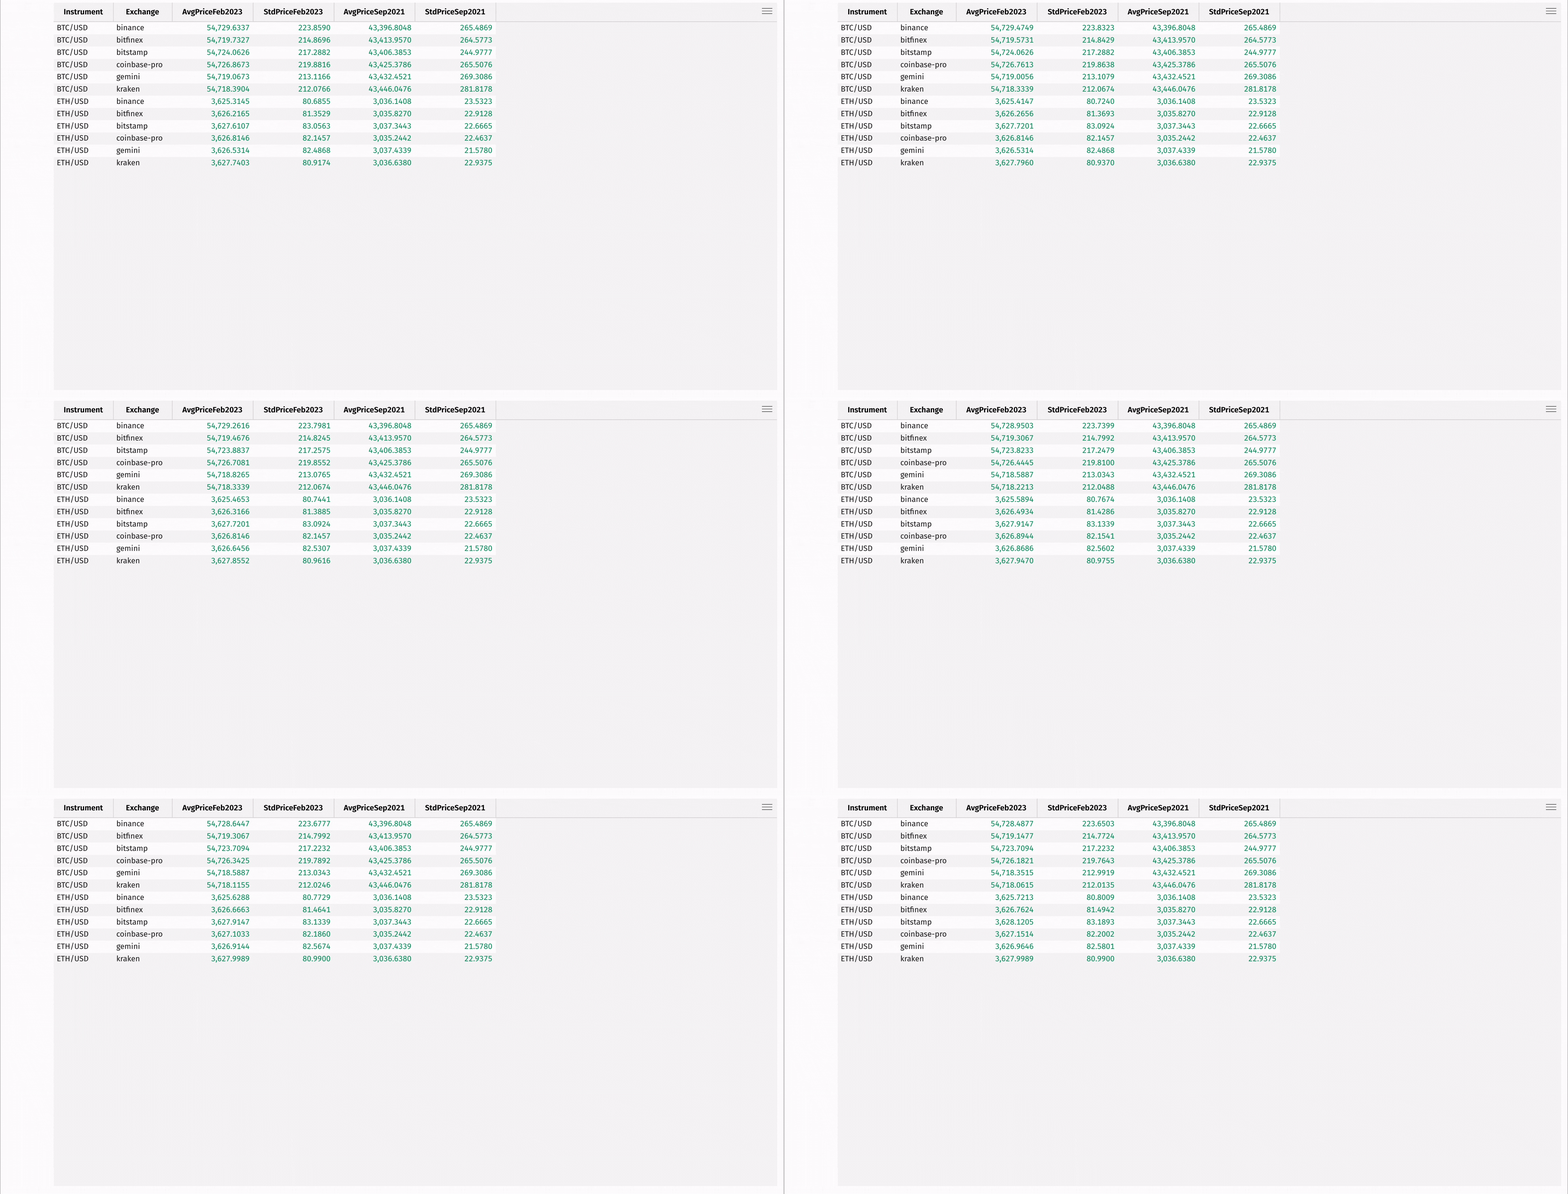
In many real-time data applications, data must be combined based on timestamps. Traditional join operations often fail this task, as they require exact matches in both datasets. To remedy this, Deephaven provides time series joins, such as aj and raj, that can join tables on timestamps with approximate matches.
Here's an example where aj is used to find the Ethereum price at or immediately preceding a Bitcoin price:
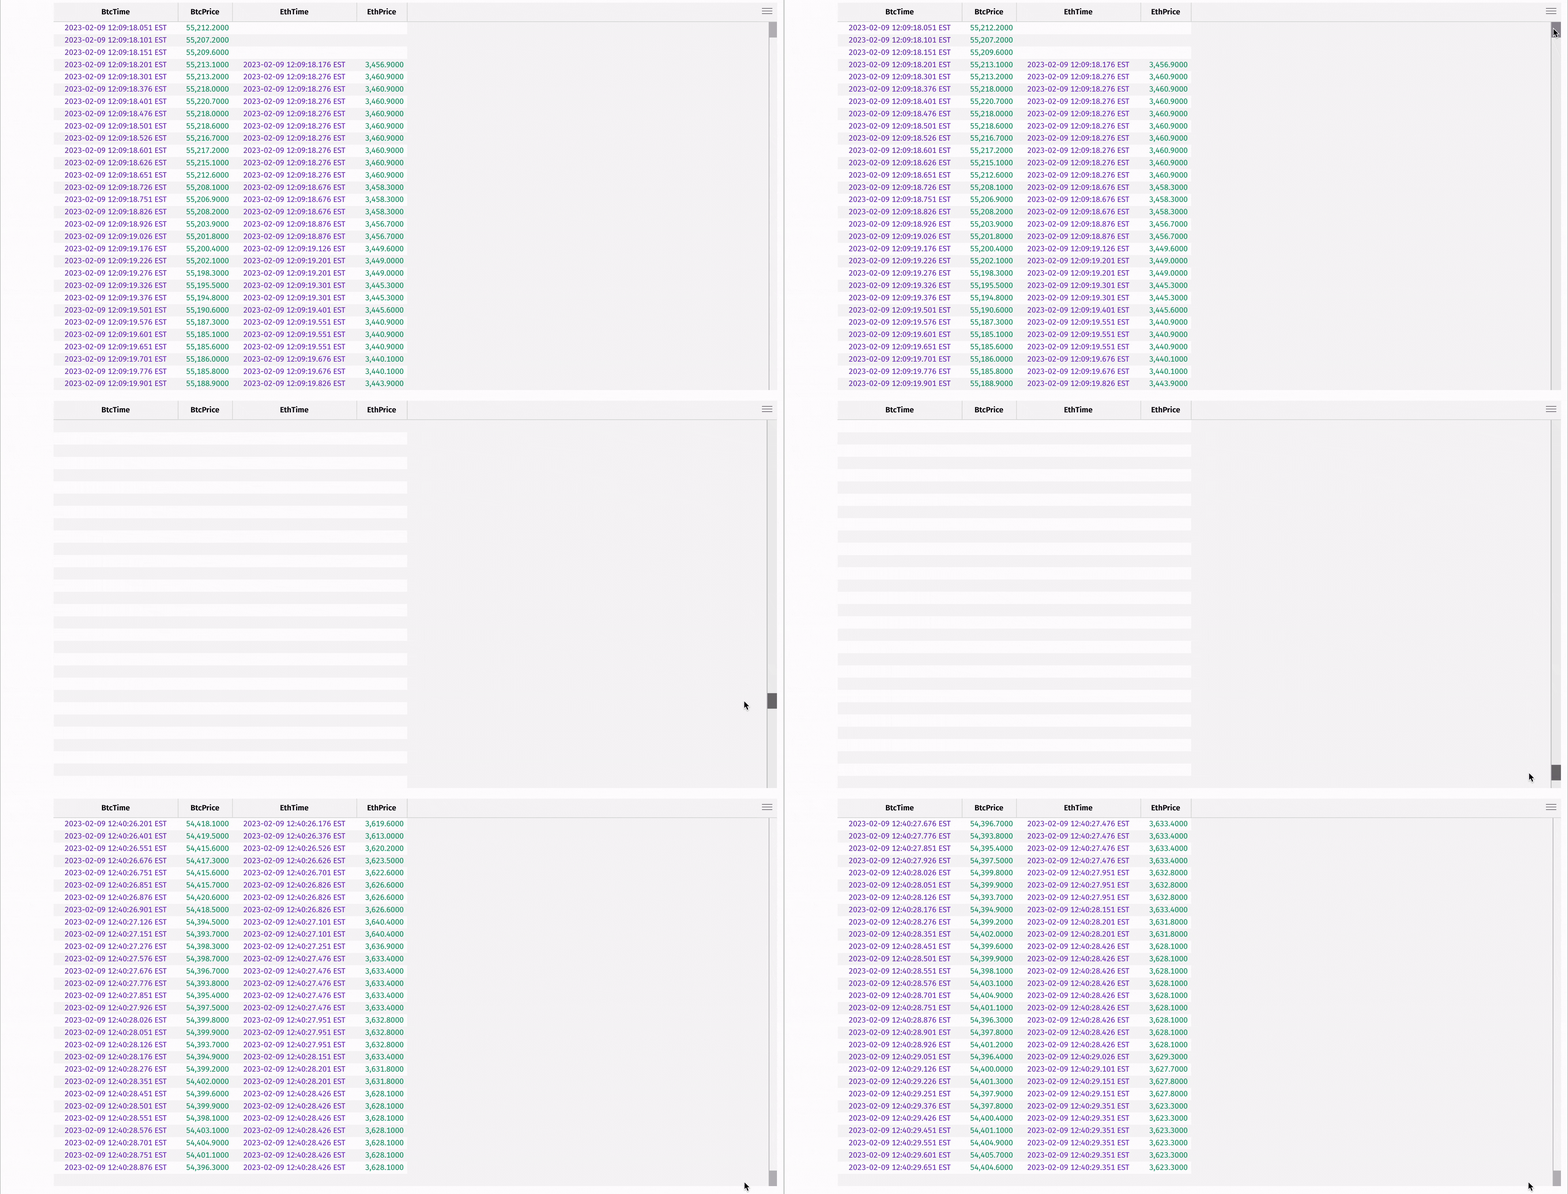
To learn more about our join methods, see the guides on exact and relational joins and time-series and range joins.
5. Plot data
Deephaven has a rich plotting API that supports updating, real-time plots. It can be called programmatically:
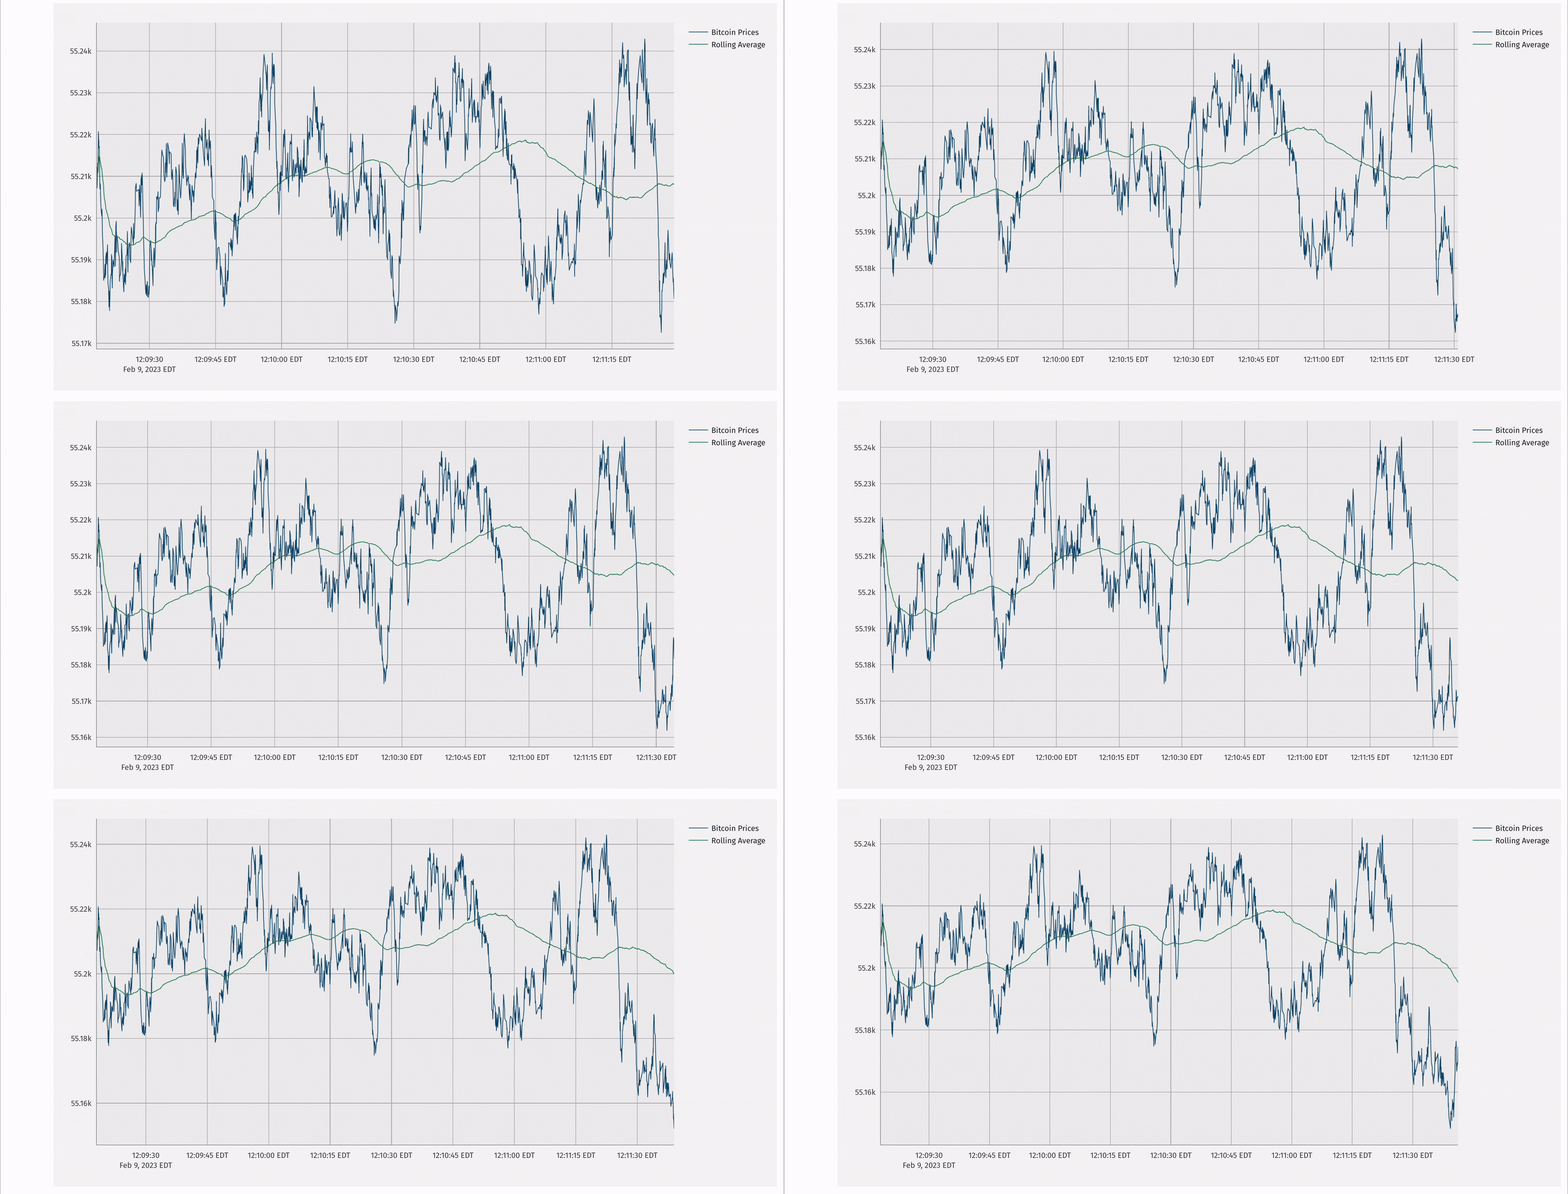
Deephaven also supports real-time plots through Deephaven Express, which is built on top of the popular Plotly Express library. See the plotting overview to compare Deephaven's plotting options.
6. Export data to popular formats
It's easy to export your data out of Deephaven to popular open formats.
To export a table to a CSV file, use the write_csv method with the table and the path where you want to save the file. Code in a Jupyter cell doesn't run under the update graph lock the way code in the Deephaven IDE console does, so export a ticking table by first taking a static snapshot of it. This code writes the CSV to the current working directory:
Similarly, use write for Parquet:
To create a static pandas DataFrame, use the to_pandas method. See the pandas guide for more details:
7. What to do next
Now that you've imported data, created tables, and manipulated static and real-time data, we suggest heading to the Crash Course in Deephaven to learn more about Deephaven's real-time data platform.