Barrage metrics for performance monitoring
Barrage is the name of Deephaven's IPC table transport. This guide explains what statistics are recorded and how to access them.
Access Barrage metrics tables
You can access these tables as follows:
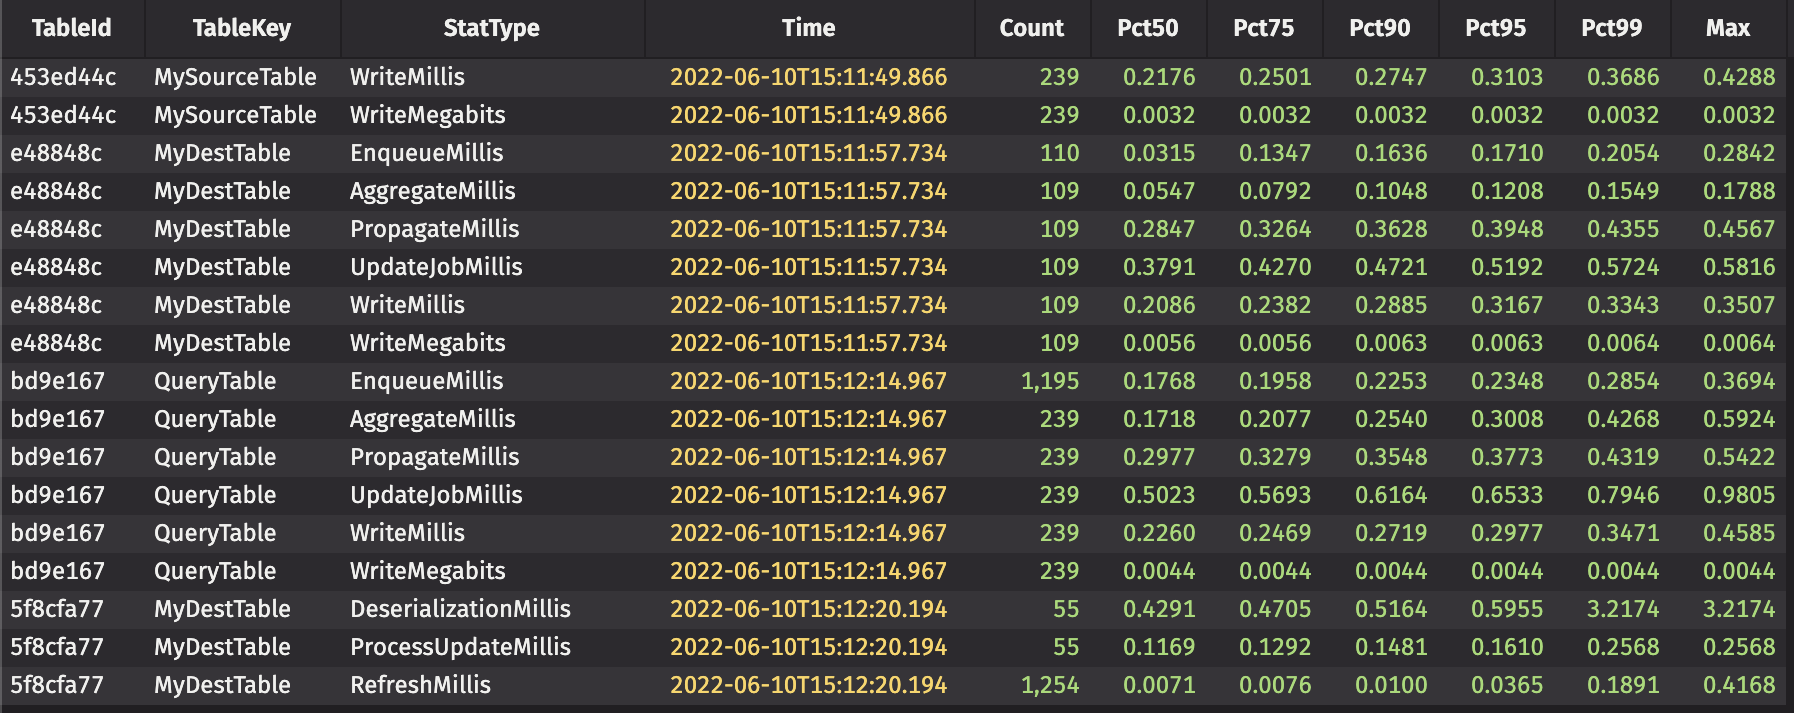
This is what the subscriptions table looks like when there are live subscriptions:
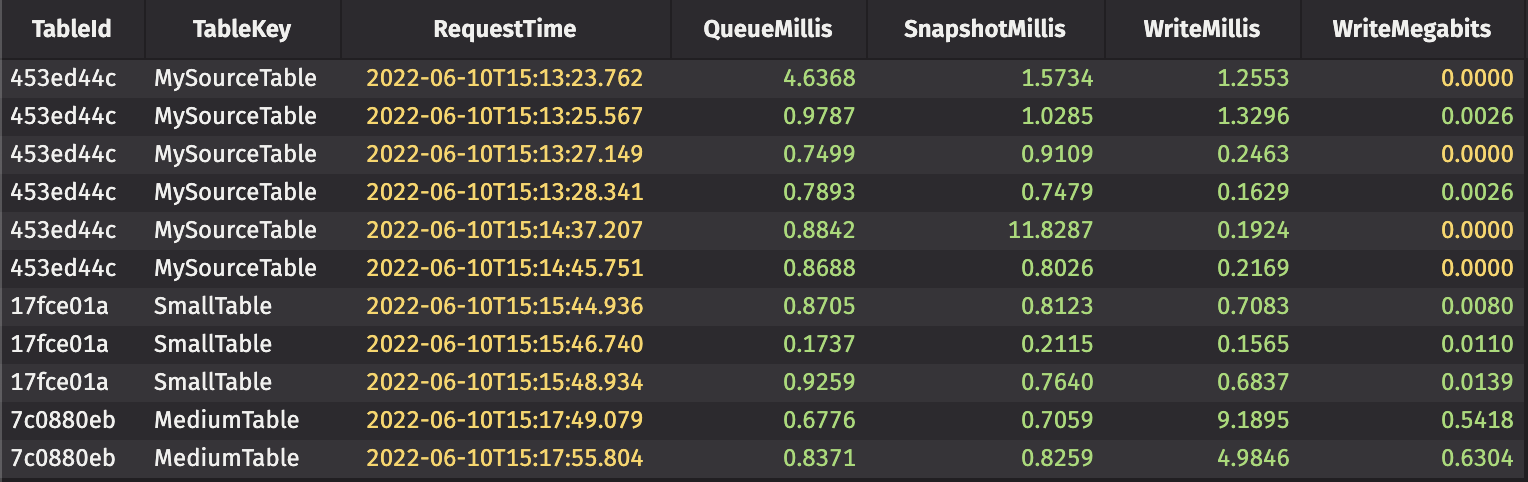
This is what the snapshots table looks like after processing a few requests:
Barrage subscription metrics summary
Subscription statistics are presented in percentiles bucketed over a time period. Here are the various metrics that are recorded by the Deephaven server:
| Stat Type | Sender / Receiver | Description |
|---|---|---|
| EnqueueNanos | Sender | The time it took to record changes that occurred during a single update graph cycle |
| AggregateNanos | Sender | The time it took to aggregate pending updates into a message; recorded for every compaction and for every range a propagation packages, even a range of one update |
| PropagateNanos | Sender | The time it took to deliver an aggregated message to all subscribers |
| SnapshotNanos | Sender | The time it took to snapshot data for a new or changed subscription |
| UpdateJobNanos | Sender | The time it took to run one full cycle of the off-thread propagation logic |
| WriteNanos | Sender | The time it took to write the update to a single subscriber |
| WriteBytes | Sender | The payload size of the update in bytes |
| PendingDeltaCount | Sender | How many pending updates the server was holding, un-propagated, at the end of an update graph cycle; a compacted update stands for every cycle it coalesced |
| PendingDeltaBytes | Sender | Approximate heap footprint, in bytes, of the chunk storage those pending updates own |
| DeserializationNanos | Receiver | The time it took to read and deserialize the update from the wire |
| ProcessUpdateNanos | Receiver | The time it took to apply a single update during the update graph cycle |
| RefreshNanos | Receiver | The time it took to apply all queued updates during a single update graph cycle |
Barrage snapshot metrics summary
Snapshot statistics are presented once per request.
| Column | Description |
|---|---|
| QueueNanos | The time it took waiting for a thread to process the request |
| SnapshotNanos | The time it took to construct a consistent snapshot of the source table |
| WriteNanos | The time it took to write the snapshot |
| WriteBytes | The payload size of the snapshot in bytes |
Note
PendingDeltaCount and PendingDeltaBytes are gauges rather than durations: each is sampled once per update graph cycle, so the useful value over a reporting window is the maximum rather than the average. They measure what the server is holding on behalf of subscribers it has not yet served, which rises with the number of update graph cycles that elapse per subscriber update interval. The byte figure is approximate: it counts the capacity of the chunks a pending update owns, which is what the server allocated, not the rows actually stored in them. It also counts those chunks alone. A String or other object column is charged eight bytes per row — the widest a reference can be, which overstates it wherever the JVM uses compressed references — and never the object that reference points at. For a subscription carrying object columns, PendingDeltaBytes therefore measures the chunk storage rather than the memory those rows retain, and can fall on either side of it.
Note
All durations are nanoseconds and all payload sizes are bytes, stored as long. This matches Deephaven's other performance tables. Convert in a query when you want different units — for example WriteMillis = WriteNanos / 1e6, or WriteMegabits = WriteBytes * 8 / 1e6 to compare against link bandwidth.
Identify a table
Tables are identified by their TableId and TableKey. The TableId is determined by the source table's System.identityHashCode(). The TableKey defaults to Table.getDescription() but can be overridden by setting the table attribute via with_attributes.
Note
The web client applies transformations to every table to which it subscribes. If a table is also subscribed to by a non-web client, then statistics for the original table and the transformed table will both appear in the metrics table. Their TableId will differ. Most transformations clear the TableKey attribute, such as when a column is sorted or filtered, both programmatically and through the GUI.
Extra configuration
Here are server-side flags that change the behavior of Barrage metrics.
-DBarragePerformanceLog.enableAll: record metrics for tables that do not have an explicitTableKey(default:true).-DBarragePerformanceLog.cycleDurationMillis: the interval to flush aggregated statistics (default:60000- once per minute).
Control subscription snapshot size
When a client subscribes to a ticking table, the server sends an initial snapshot of the table data. For large tables, constructing this snapshot requires holding the data in memory on the server side, which can lead to out-of-memory (OOM) errors.
To address this, Deephaven can break the initial snapshot into smaller chunks spread across multiple update cycles. This behavior is controlled by the following properties:
-DBarrageMessageProducer.subscriptionGrowthEnabled: Whentrue(the default), the server limits the size of each snapshot chunk. Whenfalse, the server sends the entire snapshot at once (unlimited size).
When subscription growth is enabled, these additional properties control the chunk size:
-DBarrageUtil.minSnapshotCellCount: The minimum number of cells (rows × columns) per snapshot chunk. Default:8192.-DBarrageUtil.maxSnapshotCellCount: The maximum number of cells per snapshot chunk. Default:16777216(approximately 16 million).
The server adaptively adjusts the chunk size between these bounds based on how long each snapshot takes to generate, targeting a percentage of the update graph cycle time.
Reducing publisher memory usage
For systems serving very large tables to many subscribers, you can reduce publisher-side memory usage by lowering maxSnapshotCellCount. Setting minSnapshotCellCount equal to maxSnapshotCellCount fixes the chunk size and disables adaptive sizing:
This configuration limits each snapshot chunk to exactly 1 million cells — well below the 16 million default maximum. Subscribers receive the full table data incrementally over multiple update cycles rather than all at once.
Note
Setting smaller snapshot sizes increases the time required for subscribers to receive the initial table state but reduces peak memory usage on the server. These settings only affect initial snapshots — incremental updates are unaffected and must still be maintained in memory.
Compact pending deltas
The server records one delta — the set of changes from a single update graph cycle — for each subscriber, then sends the accumulated deltas when that subscriber's update interval elapses. A subscriber served less often than its table ticks therefore holds every intervening cycle's data at once, even though the message it eventually receives is the size of the combined change rather than the sum of the individual ones. Memory grows with the number of cycles per update interval, not with the size of the update.
To limit that growth, the server combines the pending deltas in the background, before the interval elapses. Compacting costs processor time and saves memory, so the server pays for it only where there is memory to reclaim. It compares the storage the pending deltas occupy against the storage they would occupy compacted, and compacts when the saving clears both of two thresholds:
held is the storage the pending deltas currently occupy, which the server reports as PendingDeltaBytes. compacted is an estimate of what they would occupy after compacting. Both measure the capacity of the chunks allocated rather than the rows stored in them, so a queue of many small updates is scored on the memory it actually holds.
The two thresholds answer different questions. The fraction asks whether compacting is worthwhile at all; the floor asks whether the saving is large enough to be worth the work.
-DBarrageMessageProducer.compactionEnabled: Whentrue(the default), the server compacts a subscriber's pending deltas between update intervals. Whenfalse, deltas accumulate untouched until the interval elapses.-DBarrageMessageProducer.compactionMinFreedFraction: The fraction of the pending deltas' storage that compacting must release for the server to do it. Default:0.5. A higher value copies less data but lets the pending deltas grow larger — at0.9the server copies about a ninth as much and holds about ten times the compacted footprint.-DBarrageMessageProducer.compactionFloorBytes: The number of bytes compacting must release, whatever fraction of the total that represents. Default:4194304(4 MiB). This keeps a stream of very small updates from compacting on every cycle, where the work costs the same as a compaction that reclaims far more.-DBarrageMessageProducer.deltaChunkSize: The number of rows in each chunk a delta records. Default:65536. A value that is not a power of two rounds up to the next one.
Note
The PendingDeltaCount and PendingDeltaBytes metrics in the subscription table measure what the server holds for subscribers it has not yet served, so they are the place to look when tuning these properties.
Additional Barrage configuration
The following properties control other aspects of Barrage behavior:
Update interval
-Dbarrage.minUpdateInterval: The minimum interval (in milliseconds) between update batches sent to subscribers. Default:1000(1 second). Lower values reduce latency but increase CPU and network usage.
Message batching
-DBarrageMessageWriterImpl.batchSize: Maximum rows per Arrow record batch. Default:Integer.MAX_VALUE. Reduce this if clients have trouble processing very large batches.-DBarrageMessageWriterImpl.initialBatchSize: Initial batch size for the first message. Default:4096. A smaller initial batch ensures clients receive data quickly while the server calibrates optimal batch sizes.-DBarrageMessageWriterImpl.maxOutboundMessageSize: Maximum size (in bytes) for outbound messages. Default:104857600(100 MB). This matches the default incoming message limit for Java clients.
Troubleshooting
Use the metrics tables described above to diagnose common Barrage issues.
High SnapshotNanos
If SnapshotNanos is consistently high:
- The source table may be very large. Consider using viewports or filtering data before subscription.
- The update graph may be holding a lock. Check for long-running operations blocking the cycle.
- Consider enabling subscription growth with smaller chunk sizes (see Control subscription snapshot size).
High WriteNanos or WriteBytes
If WriteNanos is high or WriteBytes is large:
- Network bandwidth may be saturated. Check network utilization.
- Consider subscribing to fewer columns or using viewports to reduce data volume.
- Increase
barrage.minUpdateIntervalto batch more updates together.
High PropagateNanos
If PropagateNanos is consistently high:
- Many subscribers may be connected to the same table. Consider load balancing across multiple server instances.
- The server may be under memory pressure. Check JVM heap usage and garbage collection metrics.
Subscription errors
Common subscription issues:
- "Ticket not found": The table was released or the session that published it closed. Ensure the publishing session remains active.
- Authentication failures: Verify that the
auth_typeandauth_tokenmatch the server configuration. - Connection refused: Ensure the server is running and the host/port are correct. Check firewall rules.
Memory issues
If the server experiences out-of-memory errors during subscriptions:
- Enable subscription growth:
-DBarrageMessageProducer.subscriptionGrowthEnabled=true - Lower snapshot cell counts to reduce peak memory usage.
- Monitor the metrics tables to identify which tables consume the most resources.