deephaven.ui
Now that you're more familiar with the table API and visualizing data, it's time to consider how to present your work. The deephaven.ui package provides a rich set of tools for building interactive user experiences that show off the tables, plots, and other widgets your queries created.
What is deephaven.ui?
deephaven.ui is a React-like framework for building user experiences in Python. No front-end development, JavaScript, or CSS experience is required to hit the ground running. Key features include:
- Components: Create user interfaces from components defined entirely with Python.
- Live dataframe integration: Components are live dataframe aware and can use Deephaven tables as a data source.
- Reactive UI updates: UI components automatically update when the underlying data changes.
- Declarative UI framework: Describe the UI as a function of the data and let the framework handle the rest.
- Composability: Combine and re-use components to build complex interfaces.
- Wide range of components: From simple text fields to complex tables and plots, the library has a wide range of components to build your app.
deephaven.ui exposes many React Spectrum components (Adobe's implementation of the Spectrum design system) to Python. If you're already familiar with React Spectrum, the component names and props are nearly identical — Python uses snake_case instead of camelCase (e.g., on_press instead of onPress, default_value instead of defaultValue).
Components
At the core of deephaven.ui are components, which are reusable building blocks for your user interface. Take, for instance, a simple heading:

This component isn't very exciting. What about a component that handles events, such as a button click?

With deephaven.ui, you can decorate functions with @ui.component to define components that combine several elements and have custom behavior. The following example is a simple component that builds off the button example.

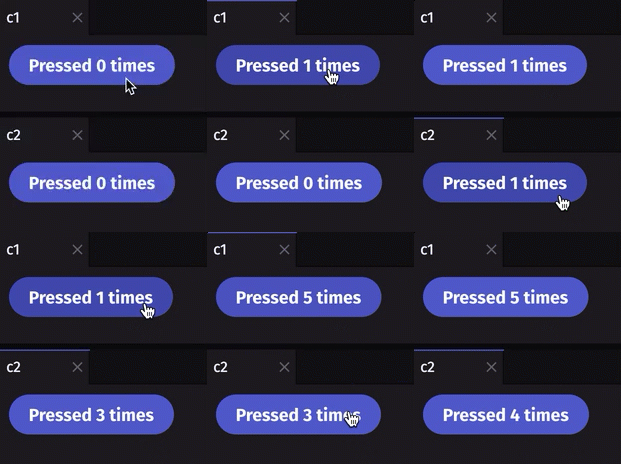
Simple enough. To make components more useful, deephaven.ui also offers the use_state hook, which allows you to manage state within components. For instance, you can track how many times a button has been clicked. Each component has its own state, as shown by clicking on c1 and c2 separately:
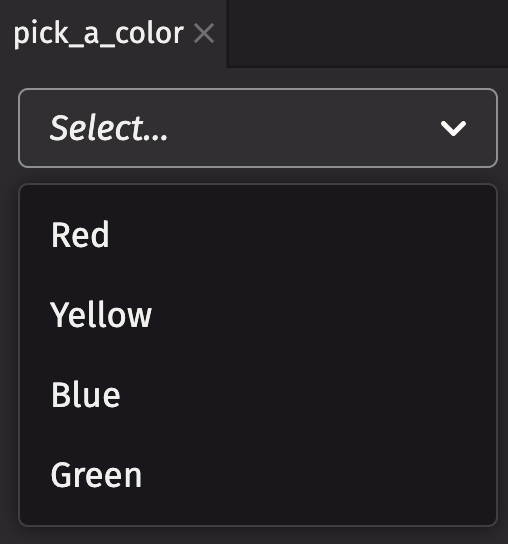
Buttons are only one of the many components available in deephaven.ui. The following code shows off a few more components including a picker, slider, and combo box:
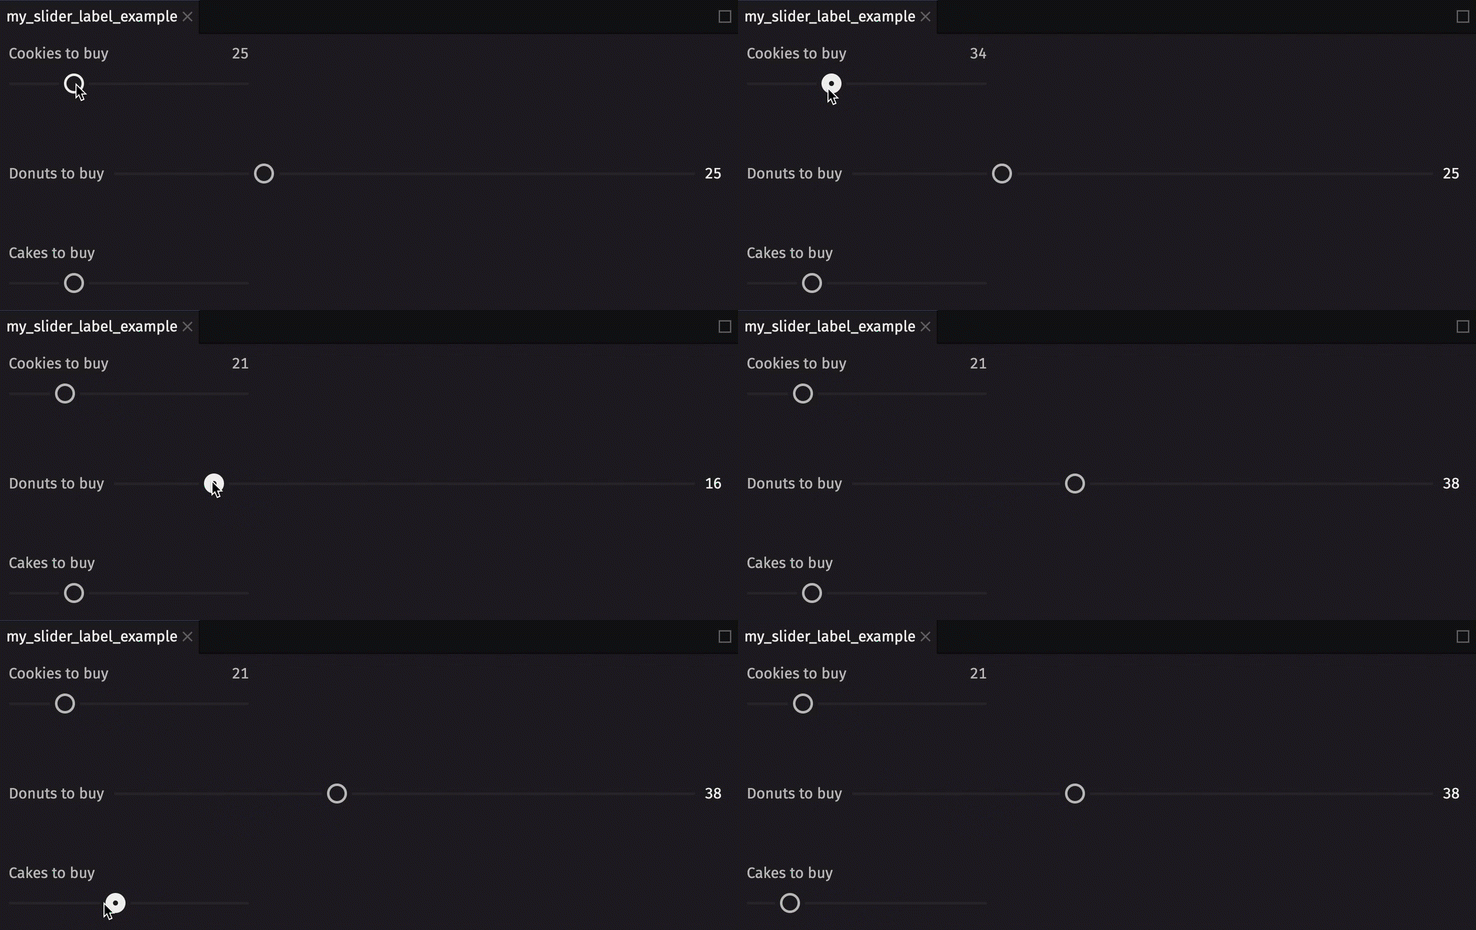
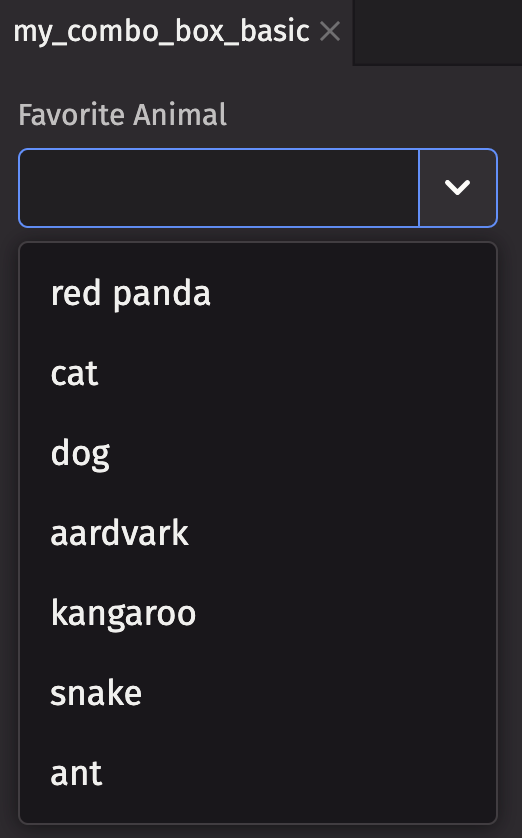
For a full list of available components, see the Components overview.
Table-backed components
Things get a lot more interesting when you source components from Deephaven tables. Components tick in lock-step with the underlying data if it's streaming.
Components can be passed tables as input to display data. Take the picker example above. What if you want to choose from the available values in a column of a table?
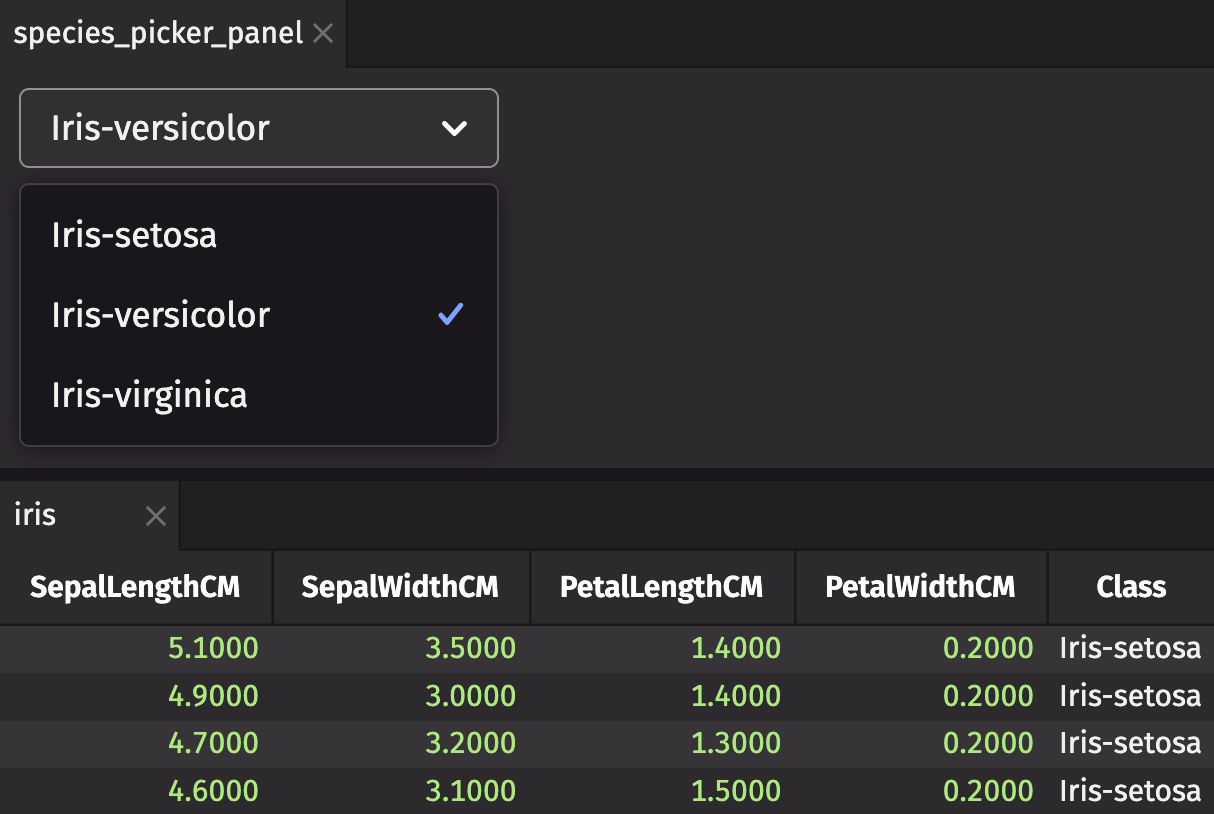
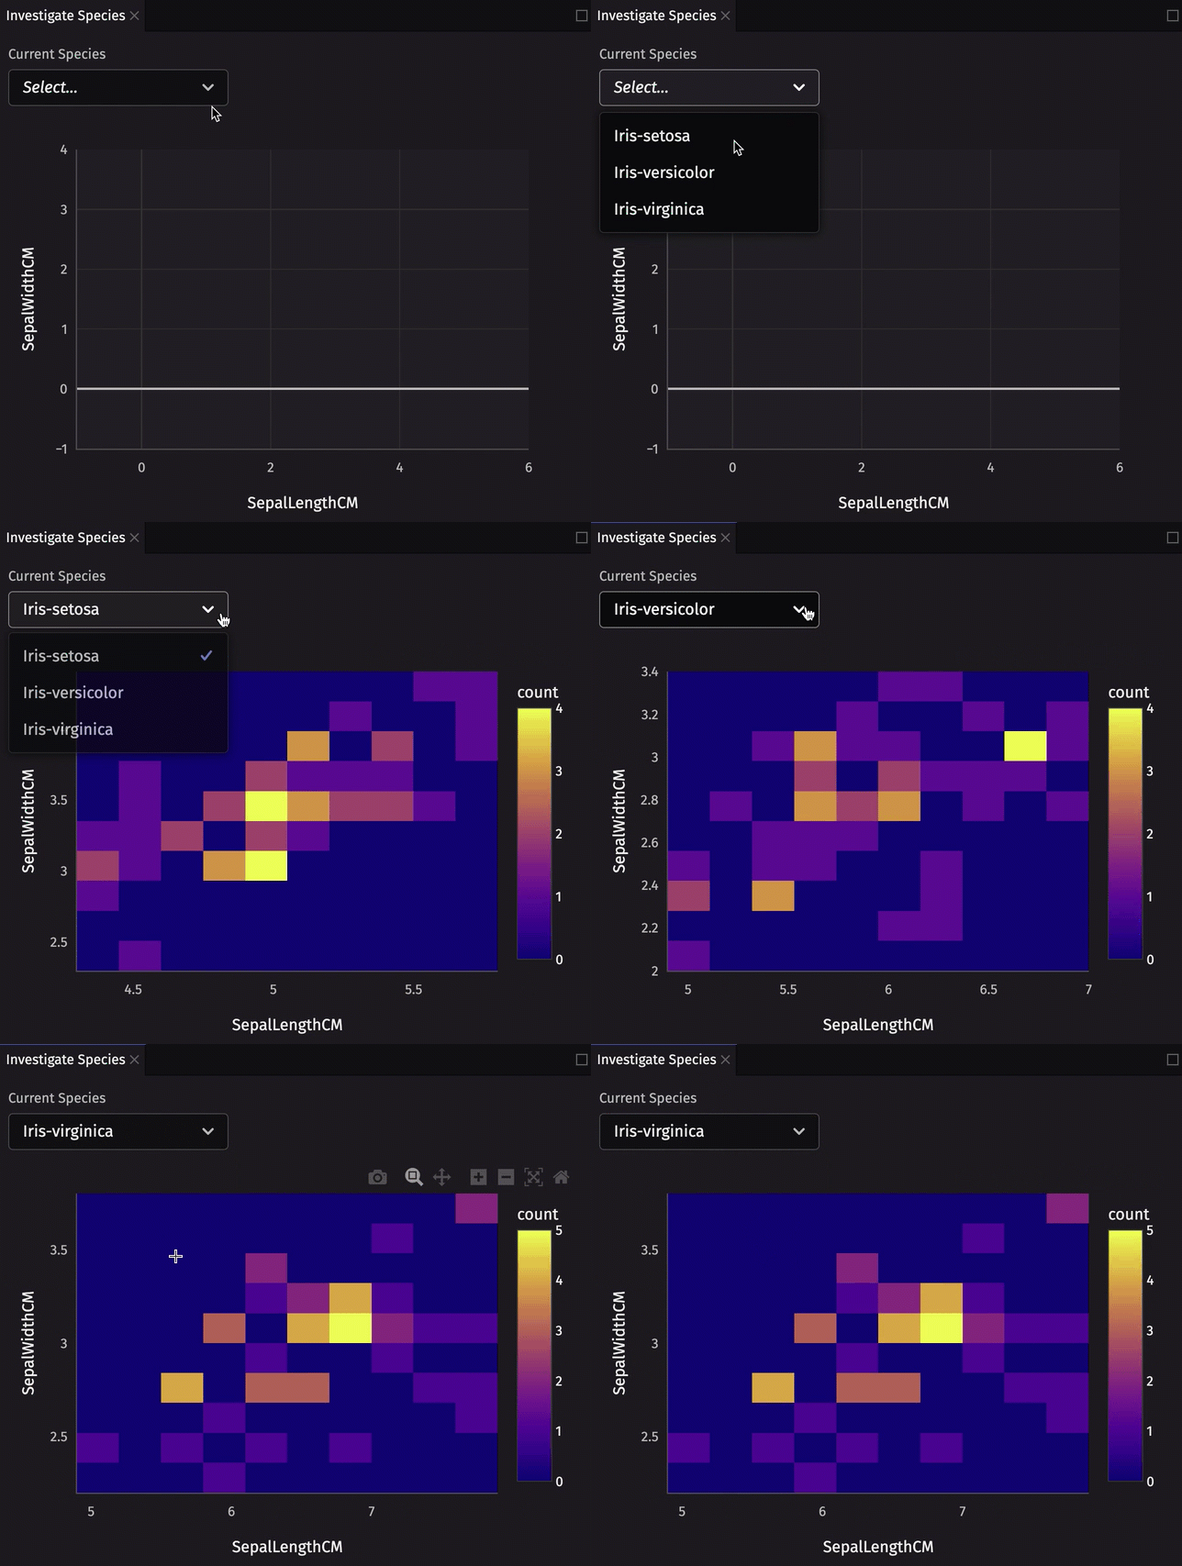
You can take this a step further and use the selected value to filter a table. The following example stores the selected species in component state and uses it to produce a Deephaven Express heatmap showing the joint density of sepal length and sepal width for that species:
Dashboards
Dashboards are collections of components arranged in a grid layout. These grids are arranged into rows and columns, allowing you to create simple and complex layouts depending on your application's needs. They are a great way to present data and visualizations in a single view.
The following example creates a simple 2x2 dashboard with components that don't have much use. This shows how the grid layout of a dashboard is created programmatically.
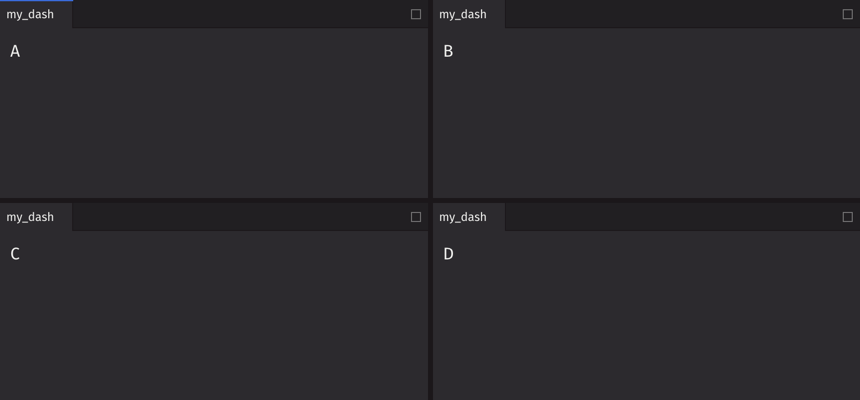
Dashboard layouts can be customized to fit your needs. A simple 2x2 grid won't suffice for many applications. What if you need more rows, where each row has a different layout? The following example shows a more complex dashboard layout:
Obviously, dashboards are much more interesting when they contain components with real data, plots, widgets, and information.
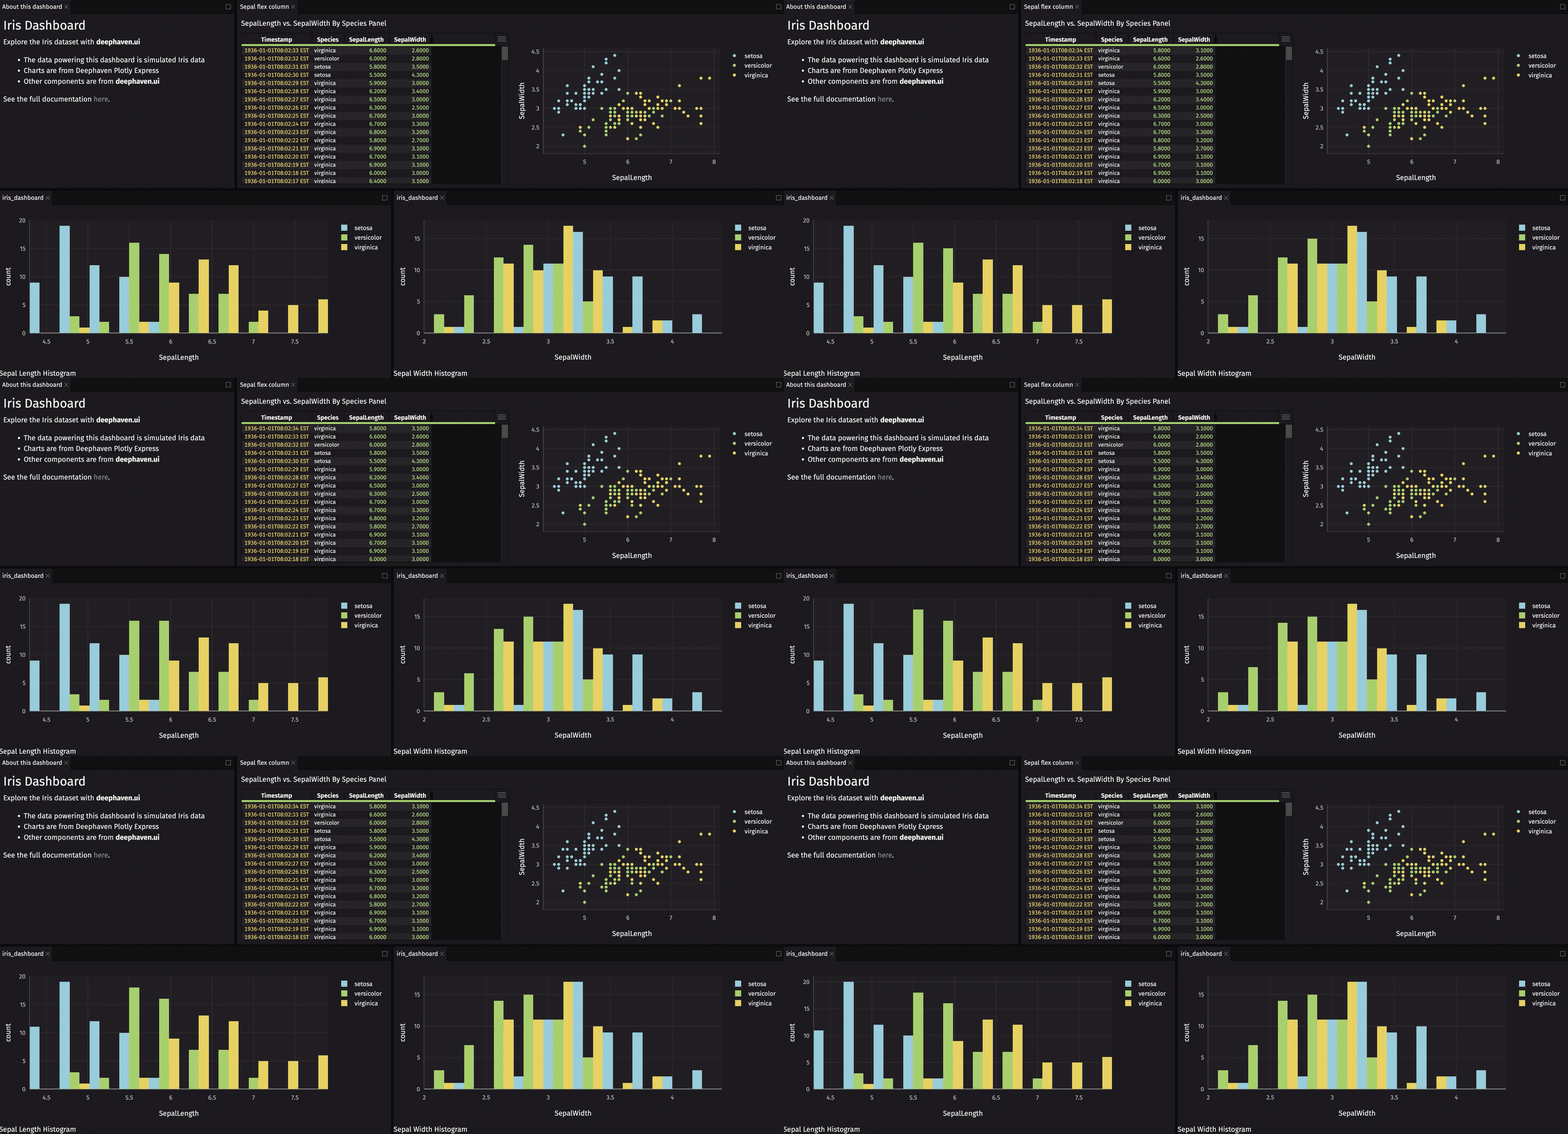
Dashboards combine multiple components into a single user experience. Dashboards are built with rows and columns of previously created components. Below is a full example that builds a dashboard with a table, a scatter plot, two histograms, and a Markdown panel describing the Iris dataset:
This crash course page only scratches the surface of what you can do with deephaven.ui. For the full deephaven.ui documentation with detailed information on everything possible, see deephaven.ui.