Use TensorBoard with Deephaven
This guide shows how to use TensorBoard with either TensorFlow or PyTorch in Deephaven queries.
TensorBoard is one of the most useful tools when training deep neural networks. Many consider the neural network to be a black box, but TensorBoard can shed some light on how to improve your model. TensorBoard can:
- Track experiment metrics such as loss and accuracy.
- Visualize the model's architecture.
- Show model weights and biases.
- Profile your model's performance.
- Help tune hyperparameters.
- Project embeddings to a lower-dimensional space.
If training your neural network takes hours or days, you can watch its statistics update in a TensorBoard dashboard in real time. That makes TensorBoard a natural fit for Deephaven's real-time tables.
To keep the TensorBoard steps short, the examples below train on a static table. To apply a trained model to a live table that updates as new data arrives, see Predict on a live table in the TensorFlow guide and Predict on live data in the PyTorch guide.
Don't sweat: using TensorBoard with Deephaven's powerful table engine is easy and takes only a few lines of code!
Set up the server
To follow along, you need a Deephaven server with TensorBoard and either TensorFlow or PyTorch installed, and port 6006 published so your browser can reach TensorBoard. The image named in each section below includes TensorBoard and that section's framework, and the docker-compose.yml file linked there also publishes port 6006.
If you start an image with docker run instead, publish port 6006 alongside port 10000. This command starts the server-tensorflow image:
For the PyTorch example, replace server-tensorflow with server-pytorch.
For other ways to launch Deephaven from pre-built images, see the Docker install guide.
Use TensorBoard with TensorFlow
This example uses the server-tensorflow image, which includes TensorFlow and TensorBoard. Start it with the TensorFlow docker-compose.yml file.
This example classifies the Iris dataset with Deephaven tables, using the same neural network that the TensorFlow guide builds with Keras, TensorFlow's high-level API for building models. You only need to add a few lines of code to enable TensorBoard!
Enable TensorFlow logging and start TensorBoard
First, set a log directory. The training code writes its logs to this directory, and TensorBoard reads them to build its visualizations:
Second, run TensorBoard with the log directory and port number. The --bind_all flag makes TensorBoard listen on all network interfaces, so your browser can reach it through the published port from outside the container:
With port 6006 published, your TensorBoard dashboard is now available in the browser at the following URL: http://localhost:6006
TensorBoard keeps running in the background. If you run this code again, delete the tensorboard_logs directory first, or set log_dir to a new folder, so the new run's charts don't overlay the old ones.
The TensorBoard dashboard has no data to show yet. To give it data, use a Keras callback: an object that Keras calls during training. Create a TensorBoard callback and pass it to the model's fit method. With the settings below, it writes most of its logs at the end of each epoch:
Each argument controls what the callback logs:
update_freq="epoch"writes the loss and metrics once per epoch.write_graph=Truelogs the model's layer structure, which the Graphs tab shows as a conceptual graph.histogram_freq=1logs weight and bias histograms every epoch.write_images=Truelogs the weights as images each timehistogram_freqlogs histograms, so it has no effect whenhistogram_freqis 0.profile_batch=2profiles the second training batch. Viewing the profile needs an extra package; see View the TensorFlow results.embeddings_freq=1logs data for any embedding layers. This model has none; see View the TensorFlow results.
See the TensorBoard callback reference for every option.
The final step is to pass the callback to the model's fit method. In the complete script below, that call is inside train_model, the function that Deephaven's learn function calls to train the model on table data:
Complete TensorFlow example
The complete script below does the following:
- Reads the Iris dataset with
read_csv. - Converts the class names to numbers with
update. The-> np.intctype hint onget_class_numbermakes the resultingClasscolumn anintcolumn. - Calls
learntwice: once to train the model, and once to createiris_predicted_static, a copy ofiriswith aPredictedClasscolumn of predictions.learn.Inputandlearn.Outputmap table columns to and from the model, andgatherconverts columns to arrays. How to usedeephaven.learnexplains these in detail.
Here is the full script:
View the TensorFlow results
After training the model, you can open the TensorBoard dashboard at http://localhost:6006 and explore the data the callback logged.
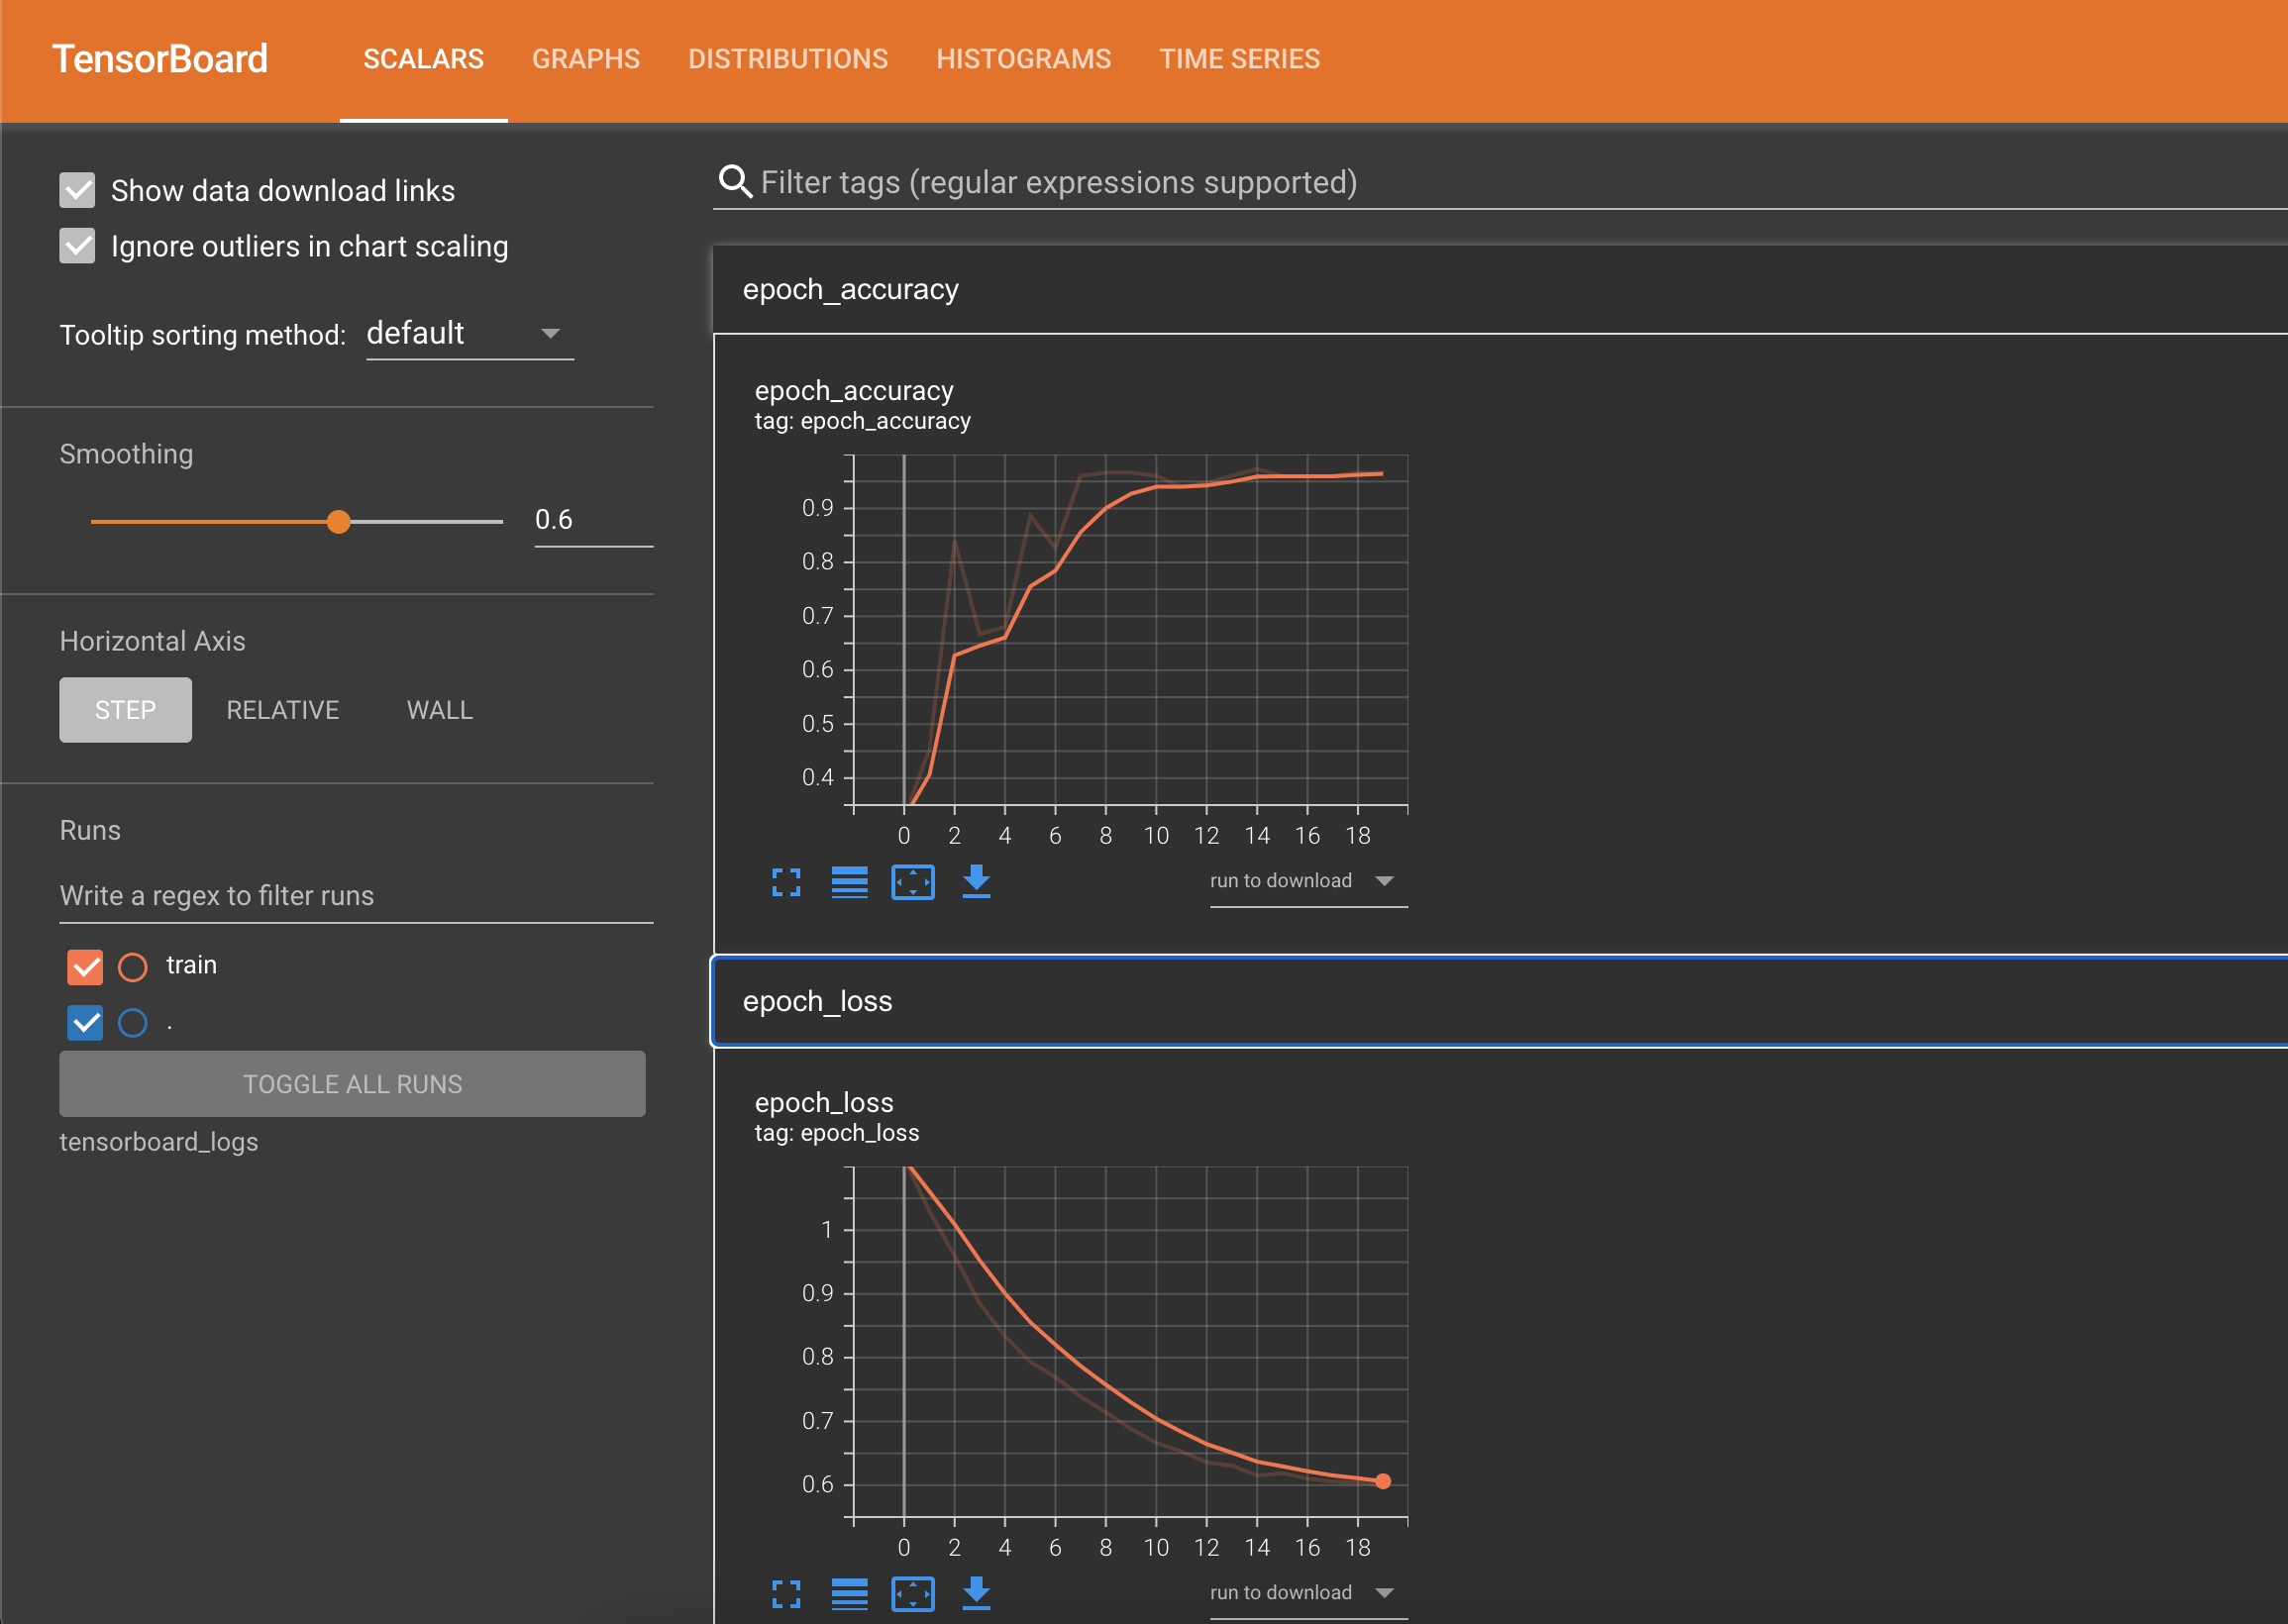
The Scalars tab shows how the loss, the metrics, and the optimizer's learning rate changed over the epochs. To also log training speed, add write_steps_per_second=True to the callback. The following screenshot shows the loss and accuracy charts:
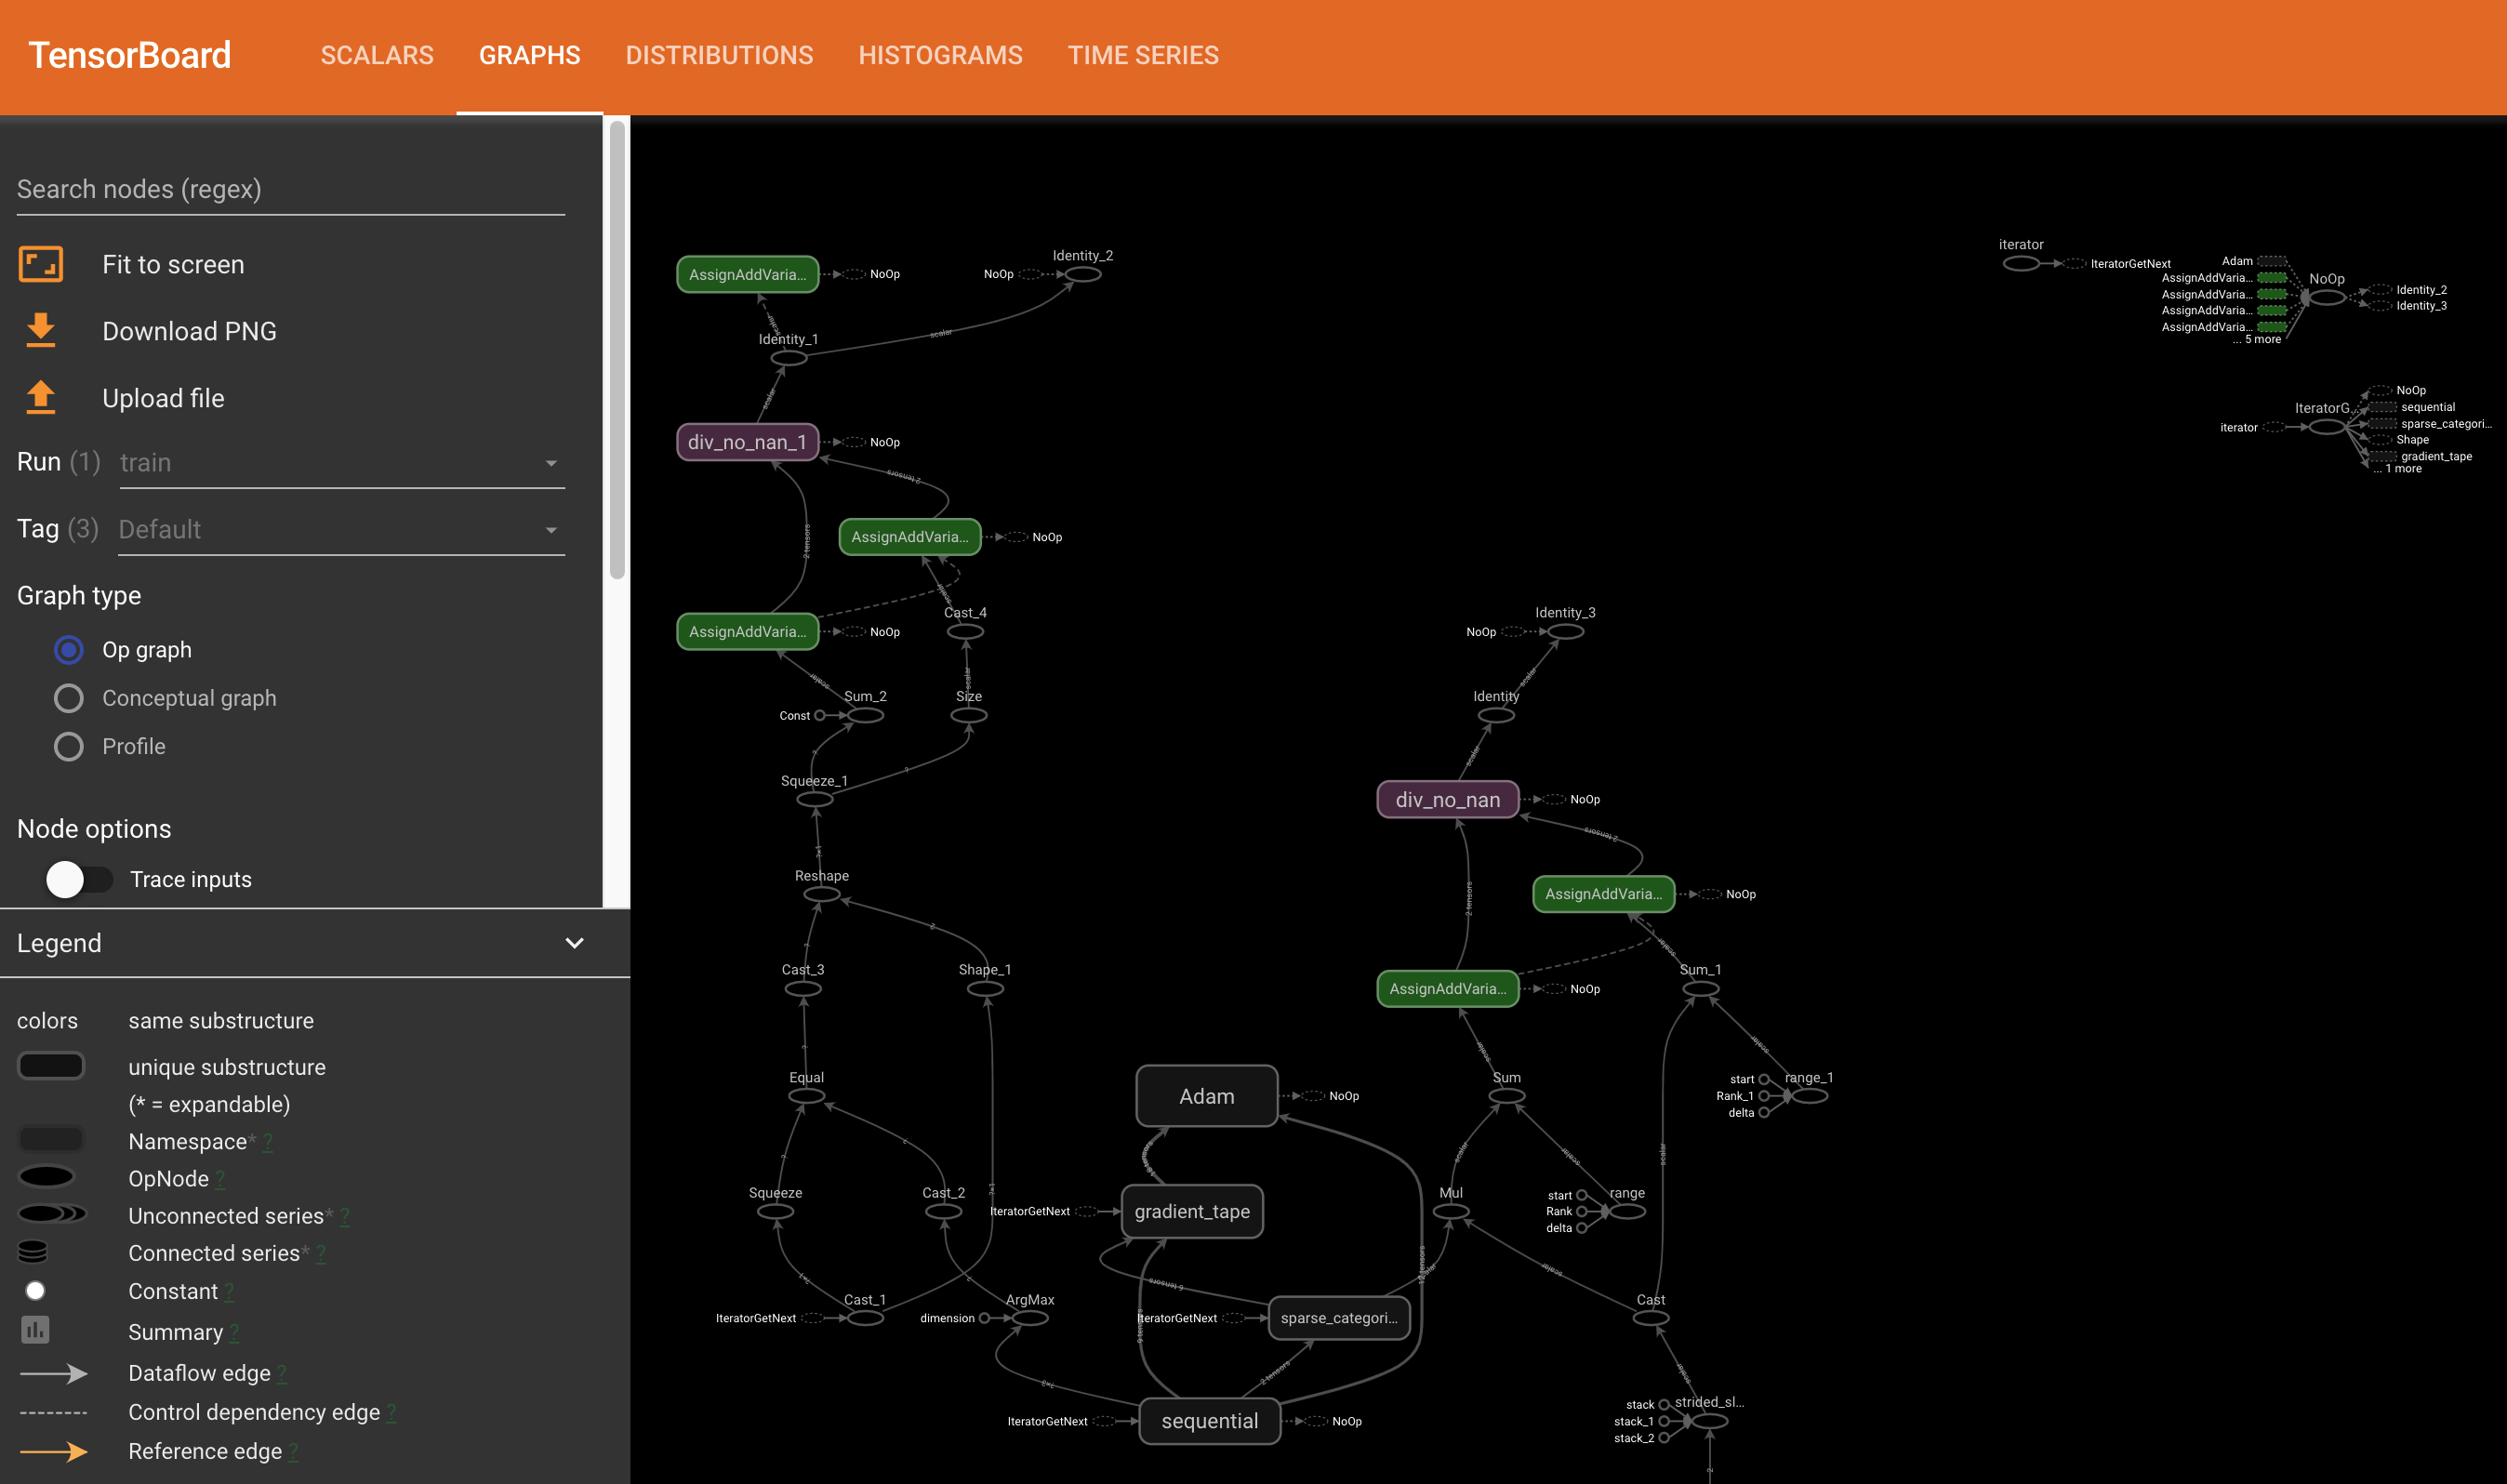
To see your model's layers and check that the architecture looks as intended, open the Graphs tab, choose the keras tag, and select Conceptual graph under Graph type. Then expand the sequential node to show the layers. The tab opens on the batch_2 tag instead, which the profile_batch argument adds. In the current server-tensorflow image, that op graph is empty, and TensorBoard reports that it couldn't trace a graph.
The Distributions and Histograms tabs show how the weights and biases changed over the epochs. The histogram_freq argument logs this data.
The Images tab draws the weights that write_images logs as images. It logs them on the same epochs as the histograms.
Two callback arguments log data that this example can't fully display:
embeddings_freq: this model has no embedding layers, so there is nothing to project. The callback still saves a weights checkpoint to the log directory'strainfolder every epoch.profile_batch: the callback records a performance profile of batch 2 and adds abatch_2tag to the Graphs tab, which is empty in the currentserver-tensorflowimage. To display the profile, TensorBoard needs thetensorboard-plugin-profilepackage, which theserver-tensorflowimage doesn't include. To add it, see How to install and use Python packages.
Use TensorBoard with PyTorch
This example uses the server-pytorch image, which includes PyTorch and TensorBoard. Start it with the PyTorch docker-compose.yml file.
This example classifies the Iris dataset with Deephaven tables, using the same PyTorch neural network (IrisANN) built in the PyTorch guide. You only need to add a few lines of code to enable TensorBoard!
Enable PyTorch logging and start TensorBoard
First, create a log directory and run TensorBoard with that directory and port number. The --bind_all flag makes TensorBoard listen on all network interfaces, so your browser can reach it through the published port from outside the container:
With port 6006 published, your TensorBoard dashboard is now available in the browser at the following URL: http://localhost:6006
TensorBoard keeps running in the background. If you run this code again, delete the tensorboard_logs directory first, or set log_dir to a new folder, so the new run's charts don't overlay the old ones.
Second, create a SummaryWriter instance that writes the logs TensorBoard reads:
The TensorBoard dashboard has no data to show yet. To give it something to show, use the SummaryWriter to log the metrics you want to track, such as the training loss. In the complete script below, train_model runs a loop over the epochs, where i is the epoch number and loss is that epoch's loss. Inside that loop, this line logs the loss for each epoch:
By default, SummaryWriter writes pending data to disk once 10 events are queued or every two minutes, whichever comes first. To make the dashboard show the final results right away, call flush on the writer when training finishes. The complete script below does this at the end of train_model:
Complete PyTorch example
The complete script below does the following:
- Reads the Iris dataset with
read_csv. - Converts the class names to numbers with
update. The-> np.intctype hint onget_class_numbermakes the resultingClasscolumn anintcolumn. - Calls
learntwice: once to train the model, and once to createiris_predicted_static, a copy ofiriswith aPredictedClasscolumn of predictions.learn.Inputandlearn.Outputmap table columns to and from the model, andgatherconverts columns to arrays. How to usedeephaven.learnexplains these in detail.
Here is the full script:
View the PyTorch results
After training the model, you can open the TensorBoard dashboard at http://localhost:6006 and see the results of your neural network's training runs:
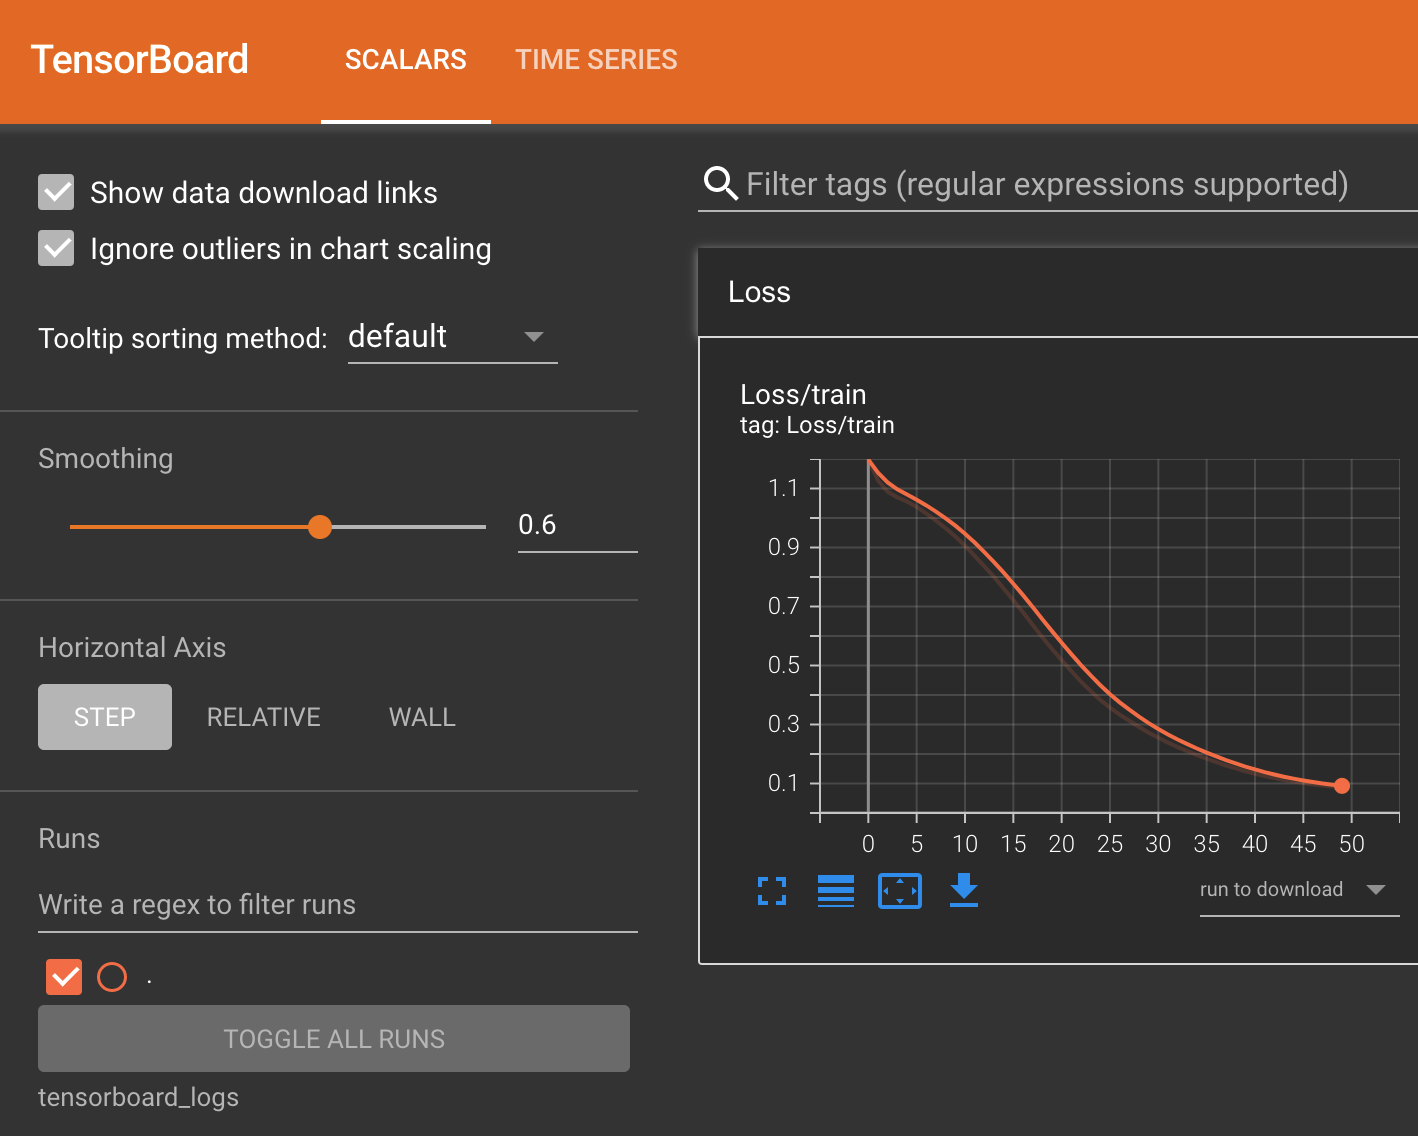
This example logs only the training loss, so the dashboard shows a single curve on the Scalars tab. To fill in TensorBoard's other tabs, log more data with SummaryWriter in train_model:
add_histogramlogs histograms of weights and biases.add_graphlogs the model graph.add_embeddinglogs embeddings.add_hparamslogs hyperparameters.