Debug Docker-run Deephaven with PyCharm
This guide shows you how to set up a remote debugging server in PyCharm Professional to debug Deephaven code running in a Docker container.
When Deephaven runs in Docker, the engine and user code execute inside a Docker container. Debugging requires a remote debugging server, like the one available in PyCharm Professional.
Warning
Debugging Deephaven with PyCharm has only been shown to work for PyCharm major version 2024 or higher. Some issues have been discovered with using PyCharm 2023, and there is no plan to fix these issues.
Note
PyCharm Professional is a paid product.
1. Install pydevd
Remote debugging in PyCharm requires the pydevd Python package to be installed on the target machine. In this case, the "target machine" is the Docker container where the Deephaven server is running. One way to install pydevd is to install it from the Deephaven IDE console:
This will create a non-persistent installation into the Deephaven container, and this command will have to be re-run every time the server restarts.
For a permanent installation that persists across restarts, place these three files in a new, empty directory:
requirements.txt
Dockerfile
docker-compose.yml
When docker compose up is run from this directory, it will build a new Deephaven Docker image with pydevd permanently installed. We will use this approach in this guide, as it provides a more natural setup for creating a PyCharm project.
2. Create PyCharm project
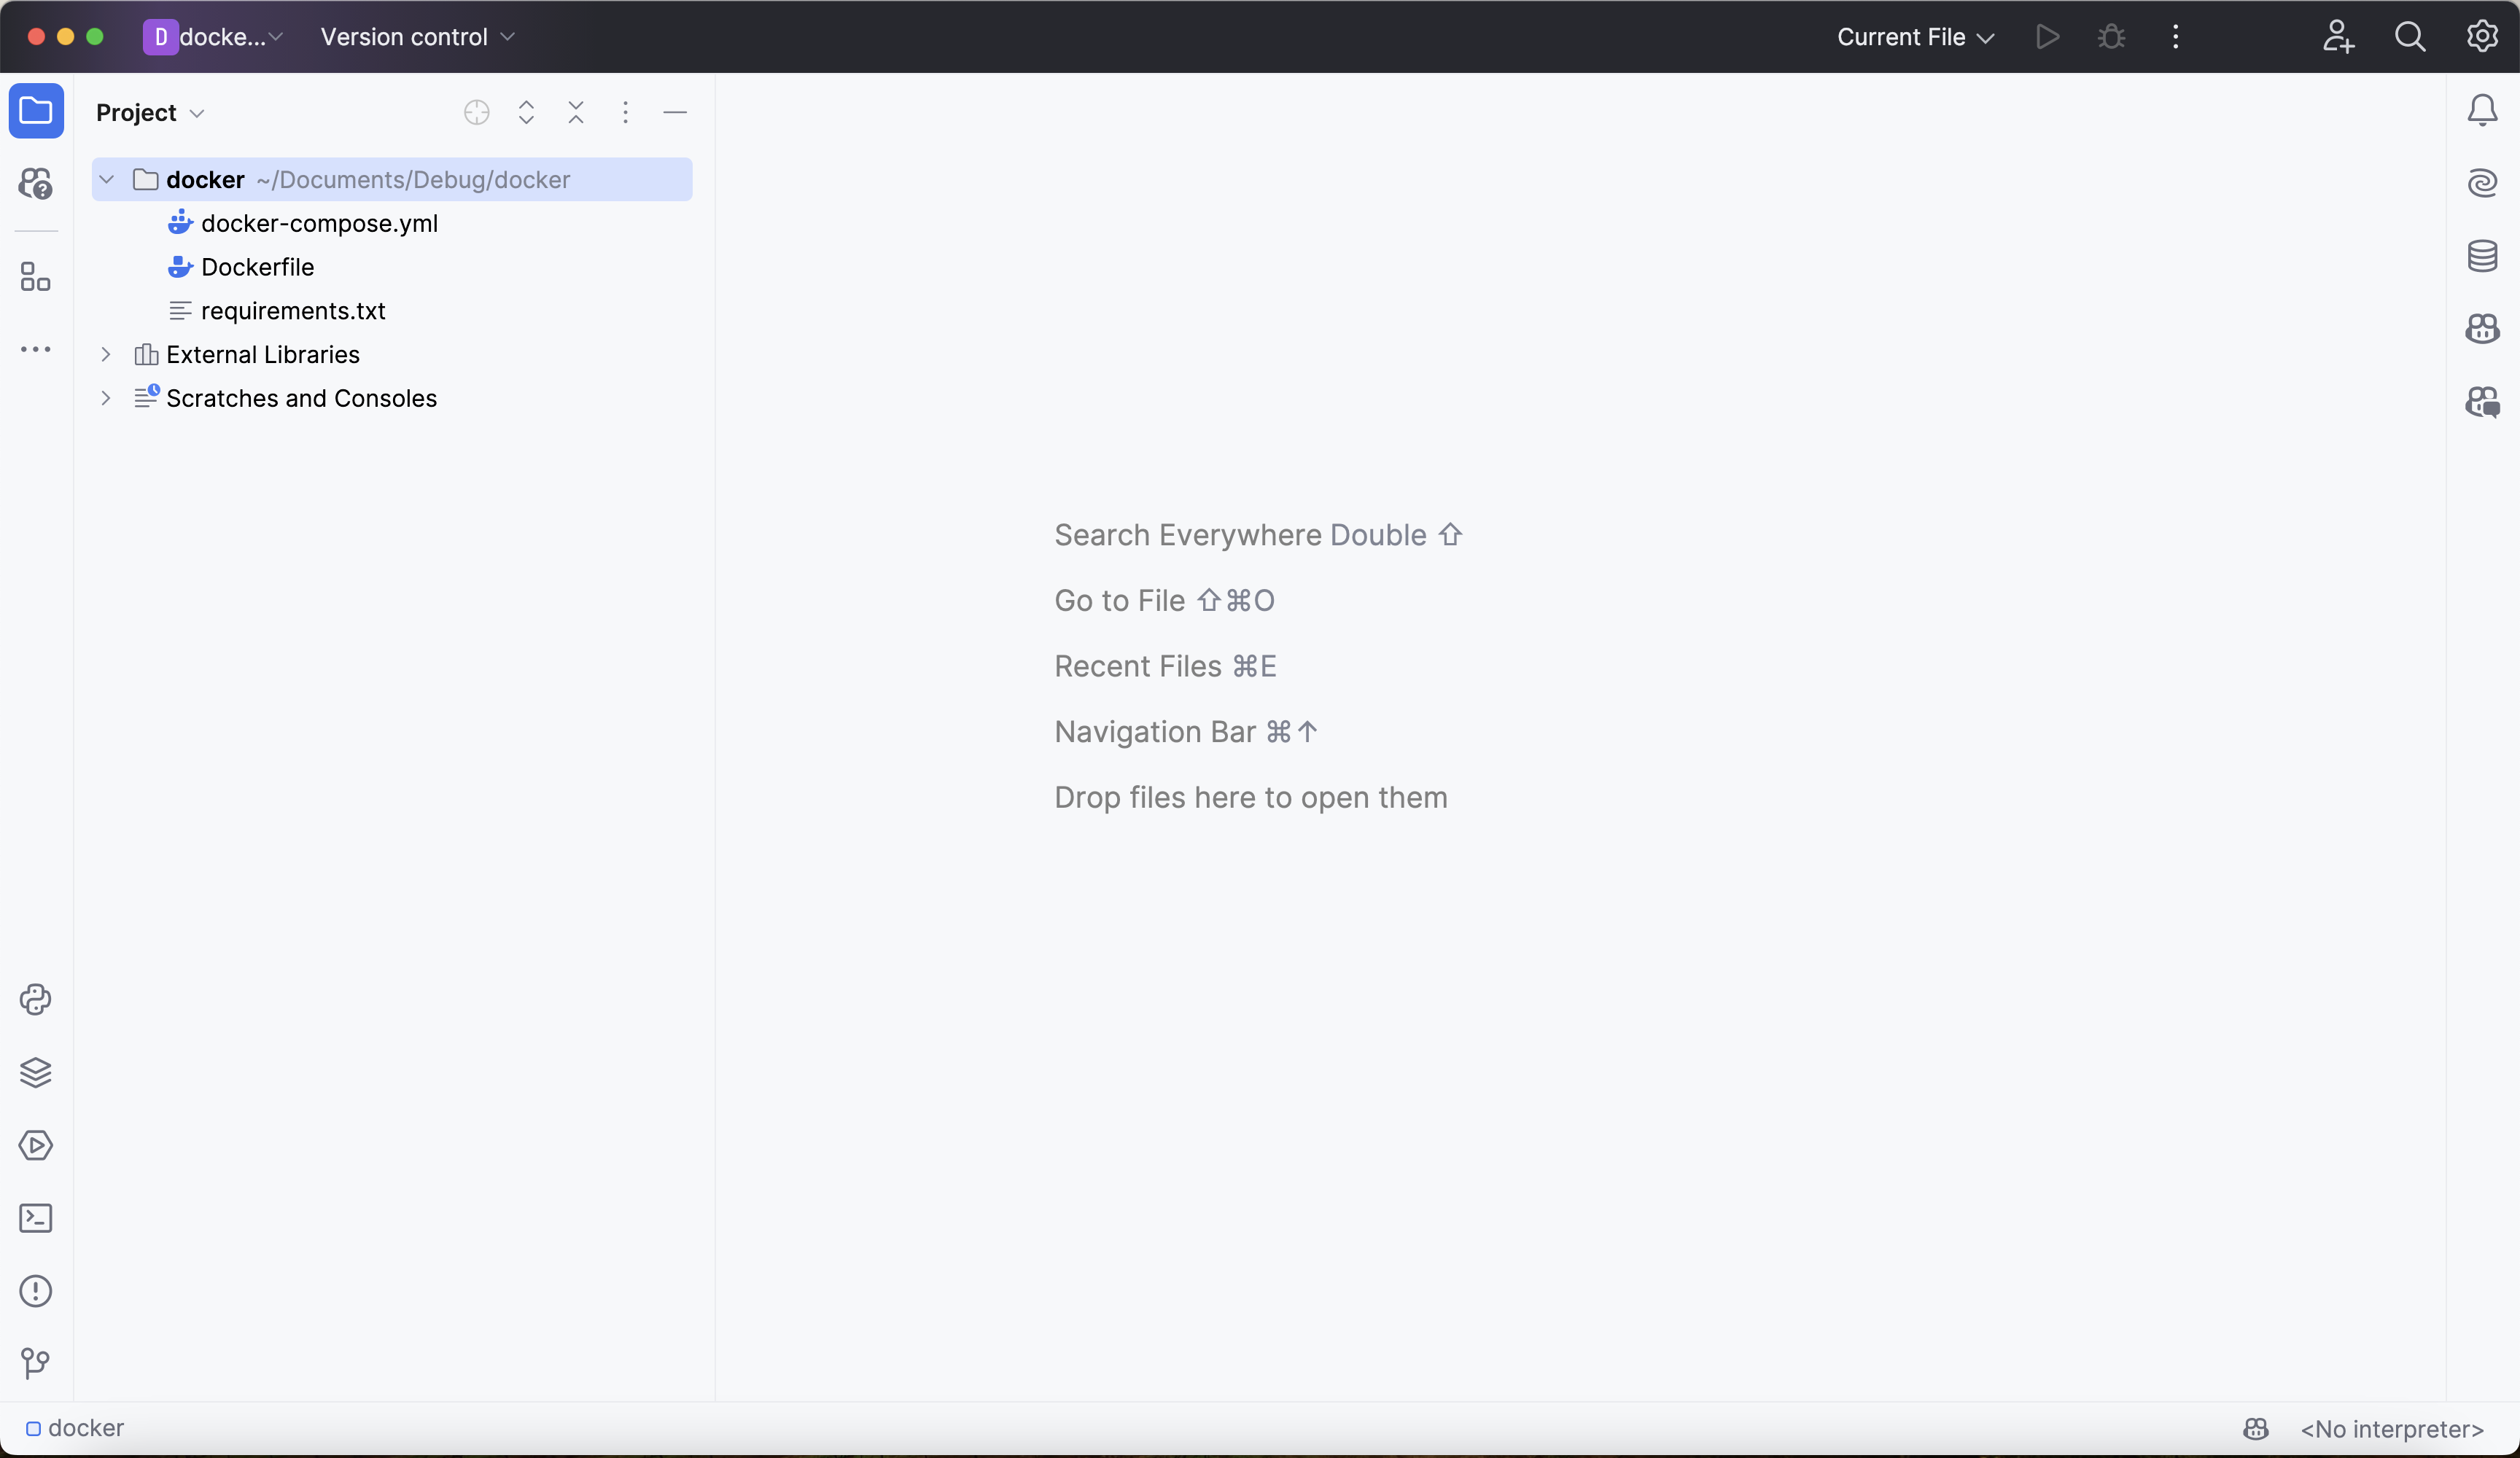
PyCharm requires that its debugger be used from within the context of a PyCharm project. The new directory created in step 1 provides a natural starting point for the new project. The new project should look like this:
3. Create debugging server
Next, create a remote debugging server from PyCharm.
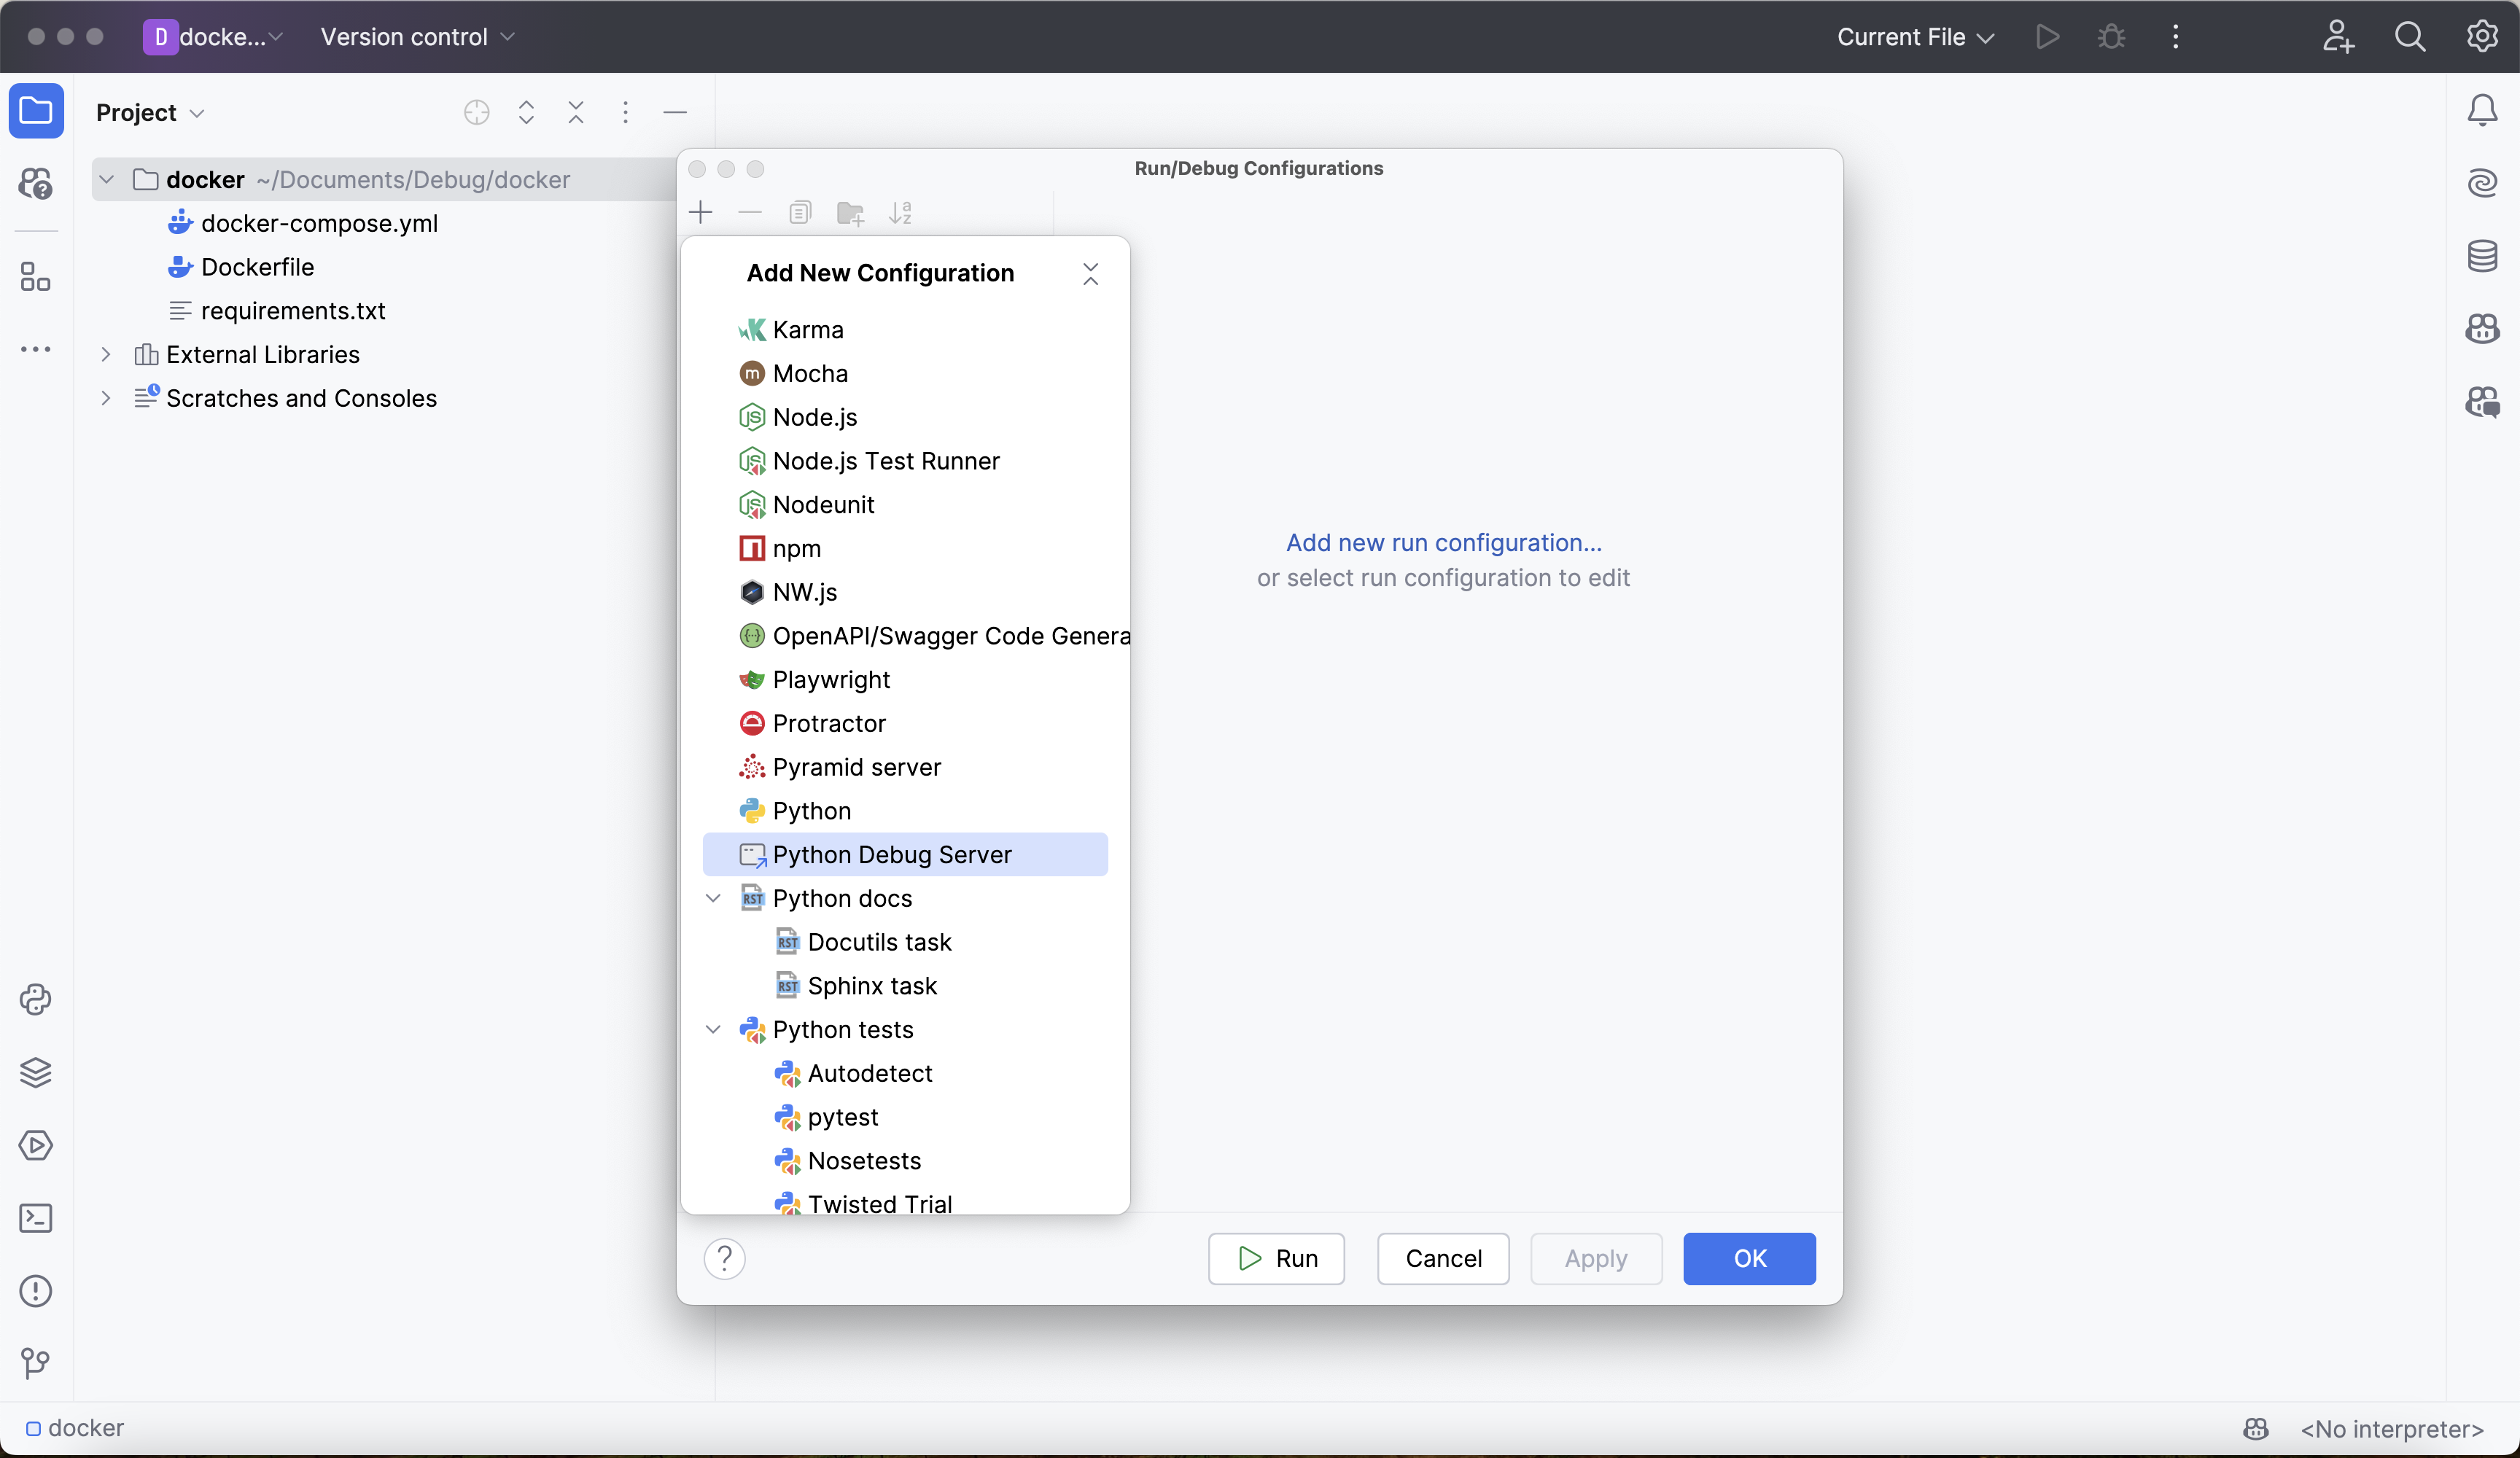
Go to Run > Edit Configurations, which opens up the Run/Debug Configurations window. Click on + in the top left corner to add a new configuration. This will bring up a list of configuration types to select. Scroll down and select the Python Debug Server configuration option:
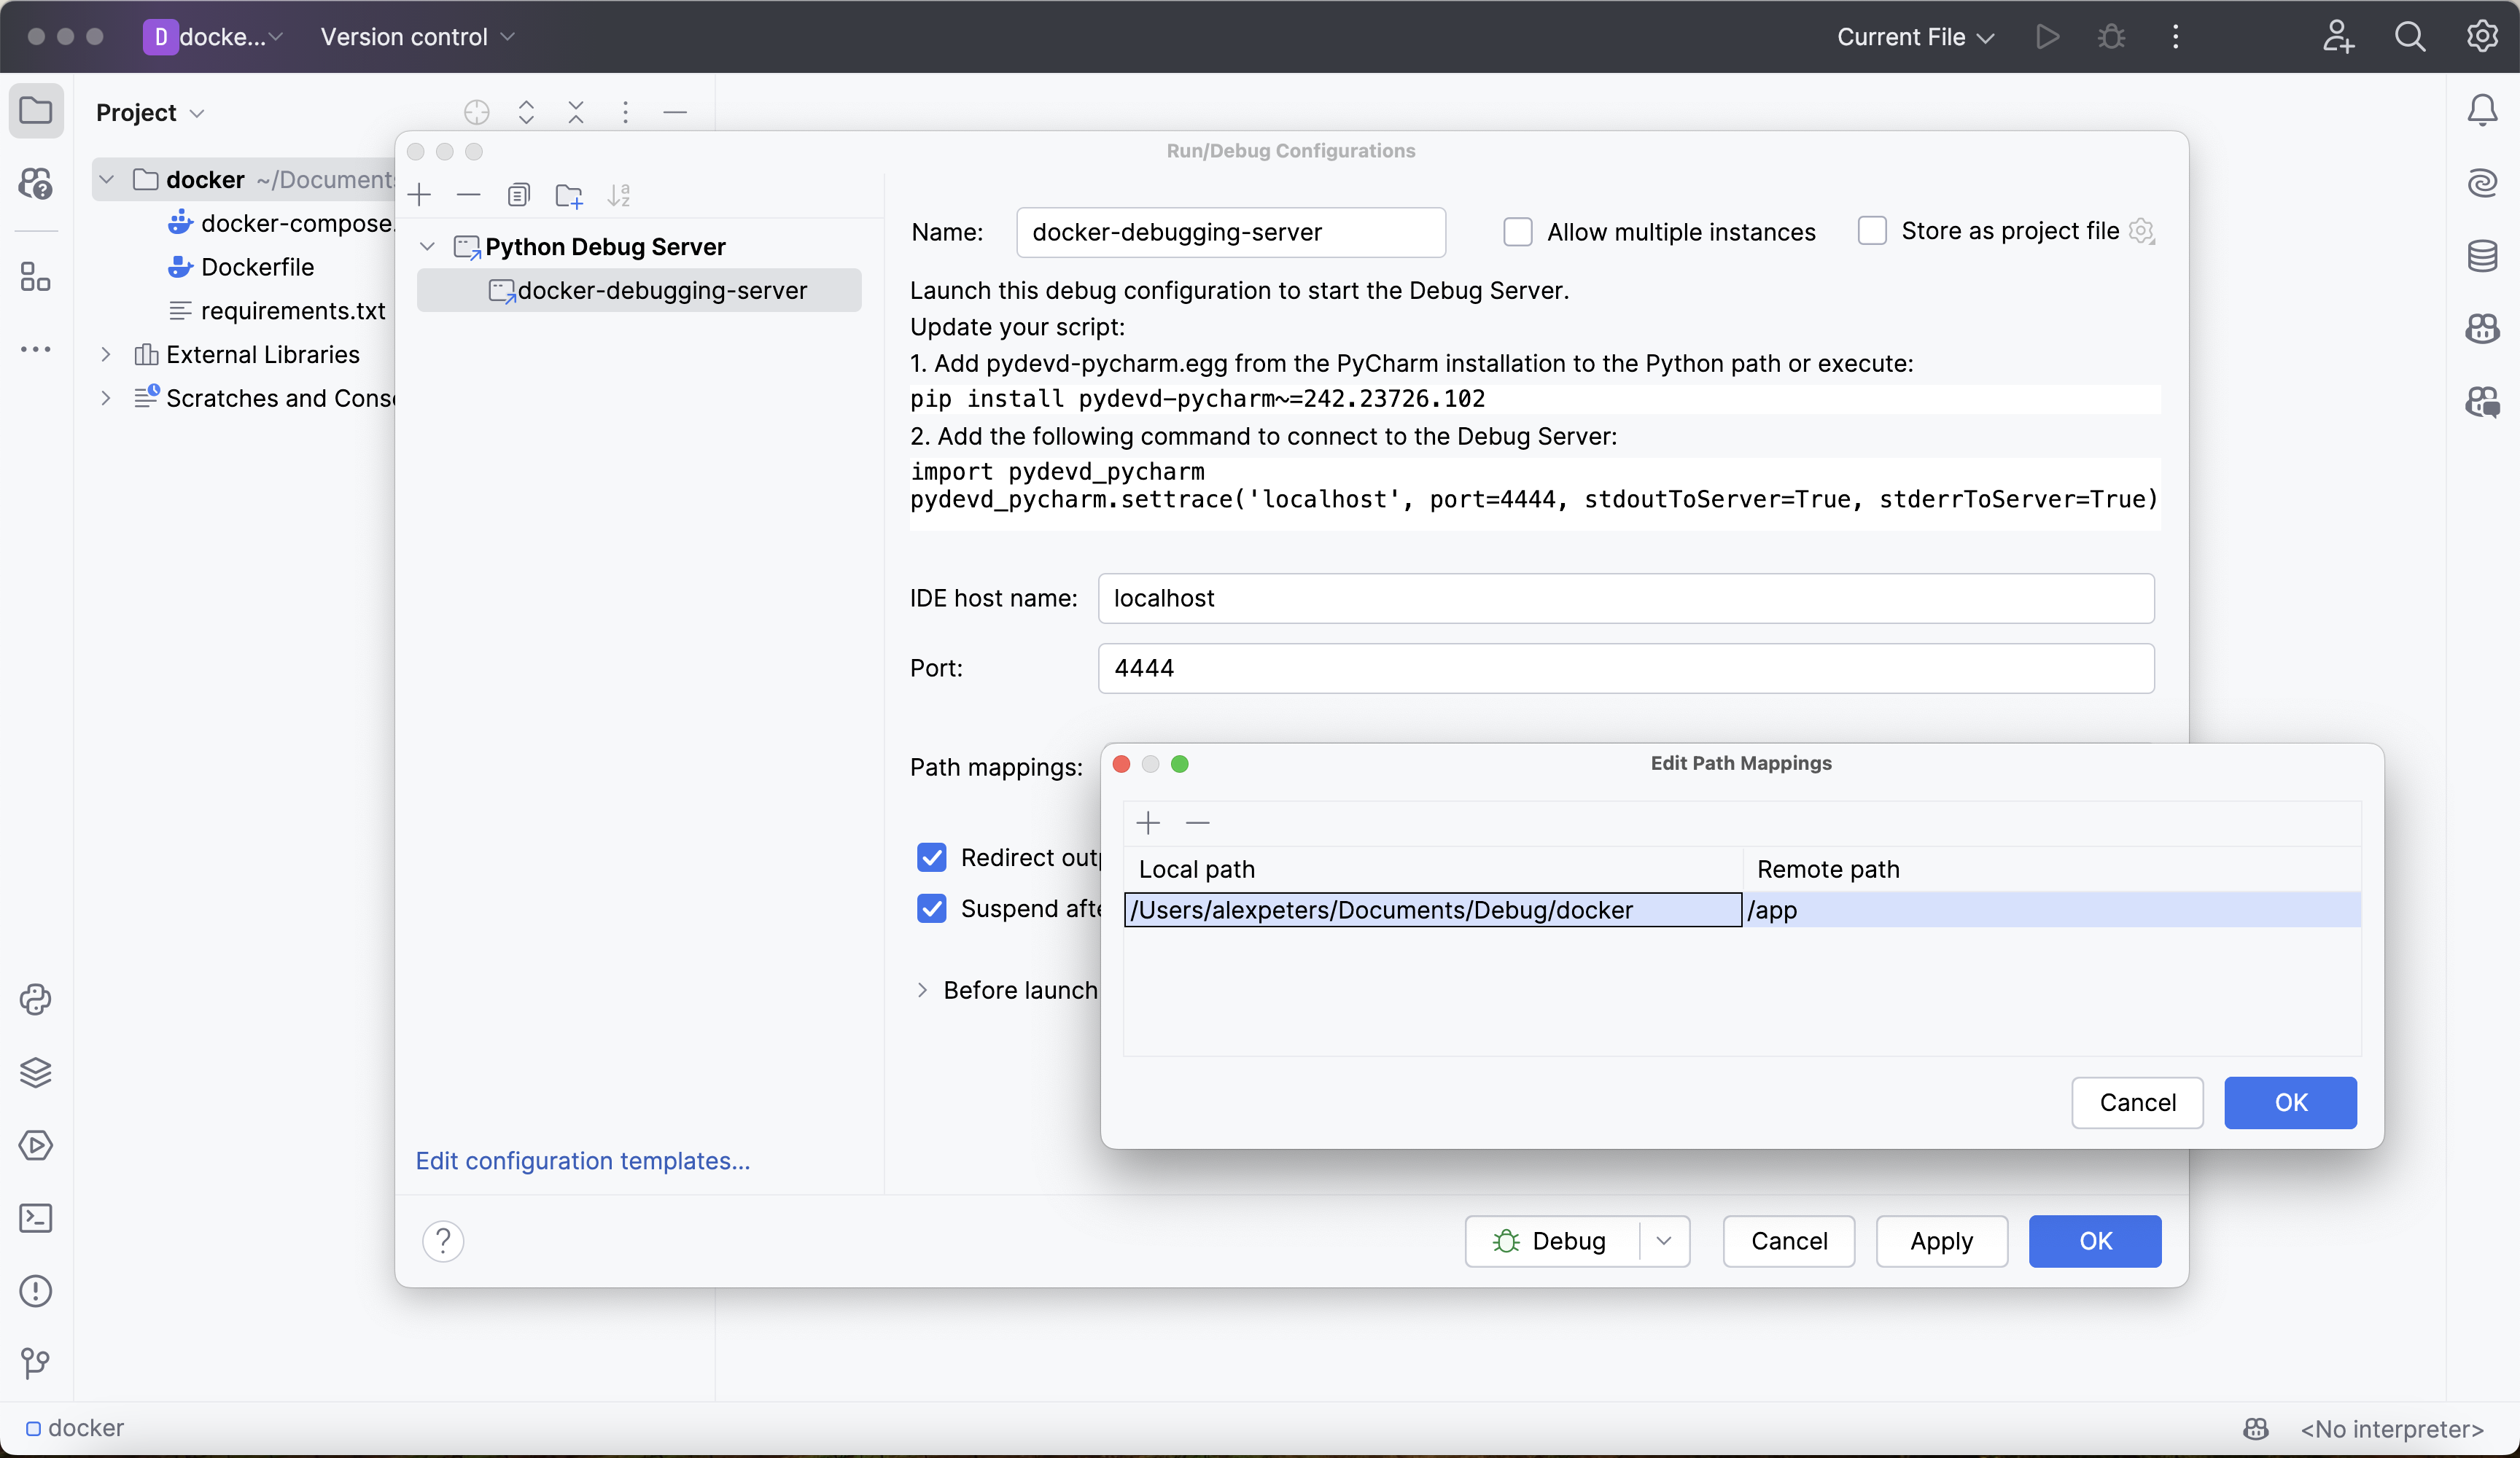
Give the configuration a reasonable, memorable name, like docker-debugging-server.
Next, set the IDE host name to localhost. This is the hostname from PyCharm's perspective - the debug server runs on your local machine.
Now, choose a port for the debug server to run on. Note that this is not the same as the port that the Deephaven server runs on, which is port 10000 by default. Any unused port will work for this - we will use port 4444.
Finally, configure path mapping to map the local PyCharm project directory to the Deephaven container's working directory. This allows PyCharm to correctly map breakpoints and source files between your local machine and the container:
- Local path: The absolute path to your current PyCharm project (e.g.,
/Users/yourname/docker-debug-project) - Remote path:
/app(the Deephaven container's working directory)
Click Apply and Ok, and the new debug server will be immediately available.
4. Attach debugger to Deephaven
Warning
The Deephaven server must be run with anonymous authentication for this kind of debugging to work. The docker-compose.yml file above includes the required -DAuthHandlers=io.deephaven.auth.AnonymousAuthenticationHandler setting.
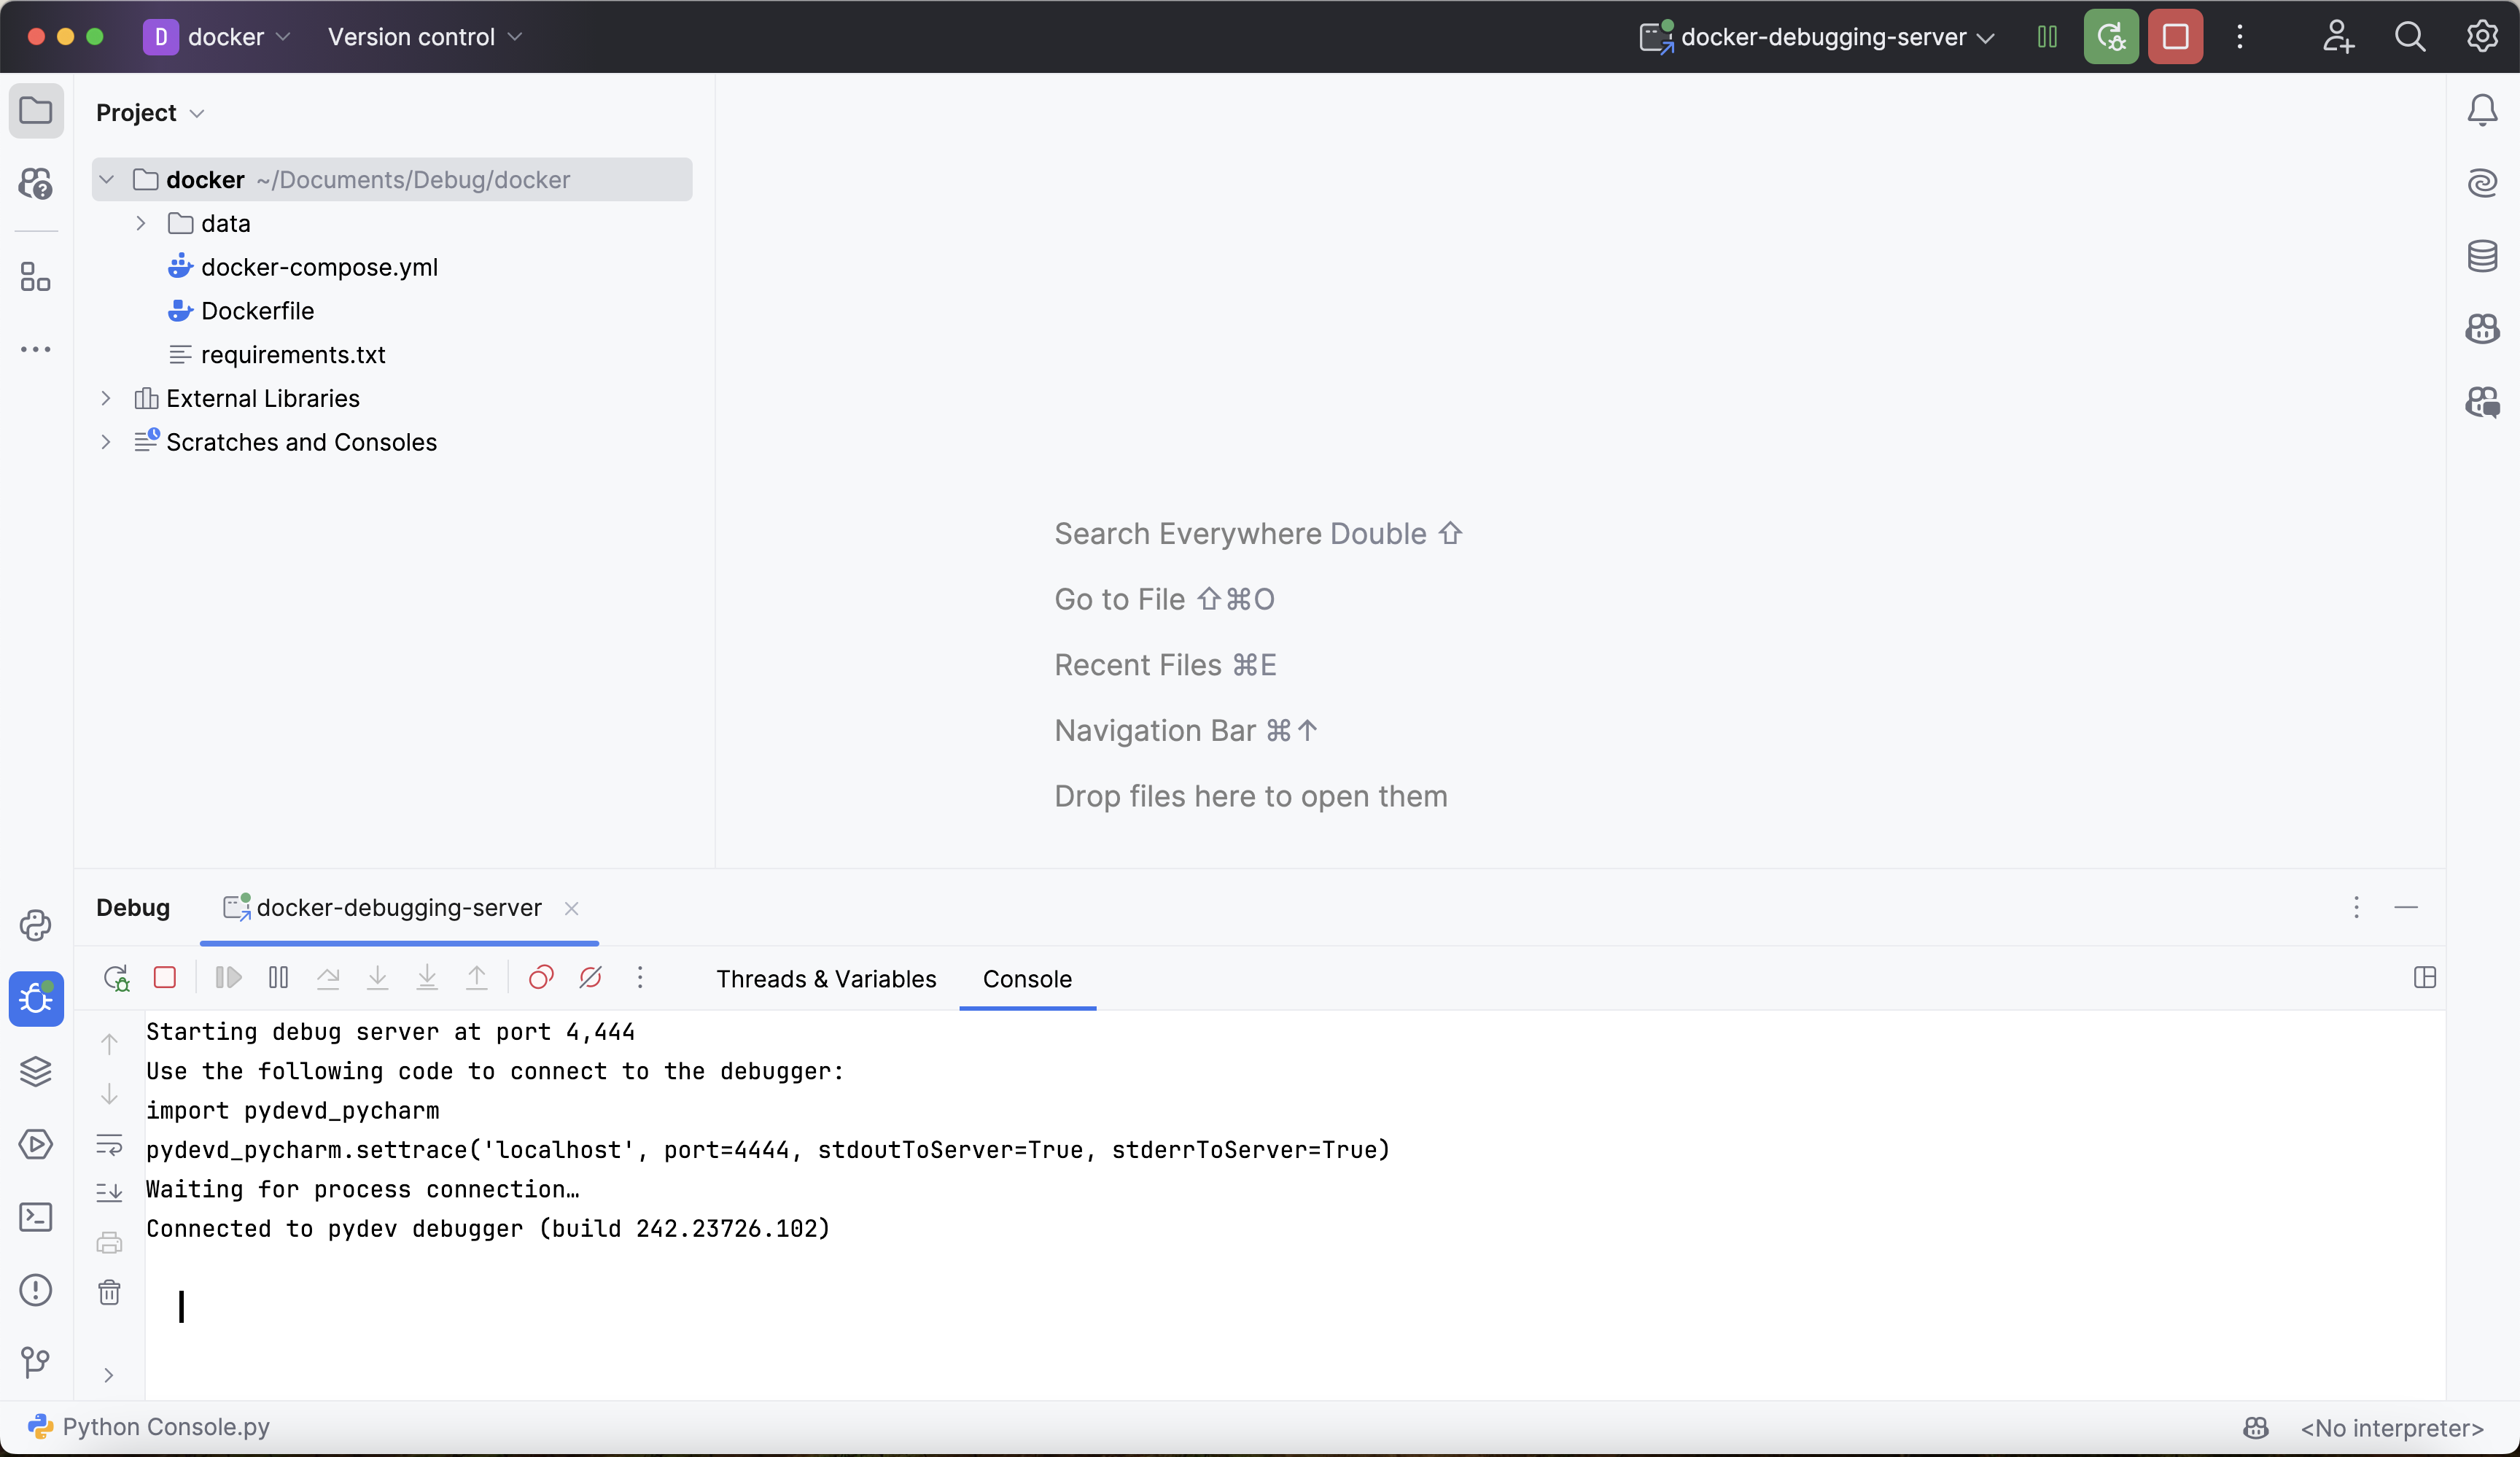
Start the debugger in PyCharm by clicking the small green bug icon in the window's top right corner. This will start the debugger and open a debugging console:
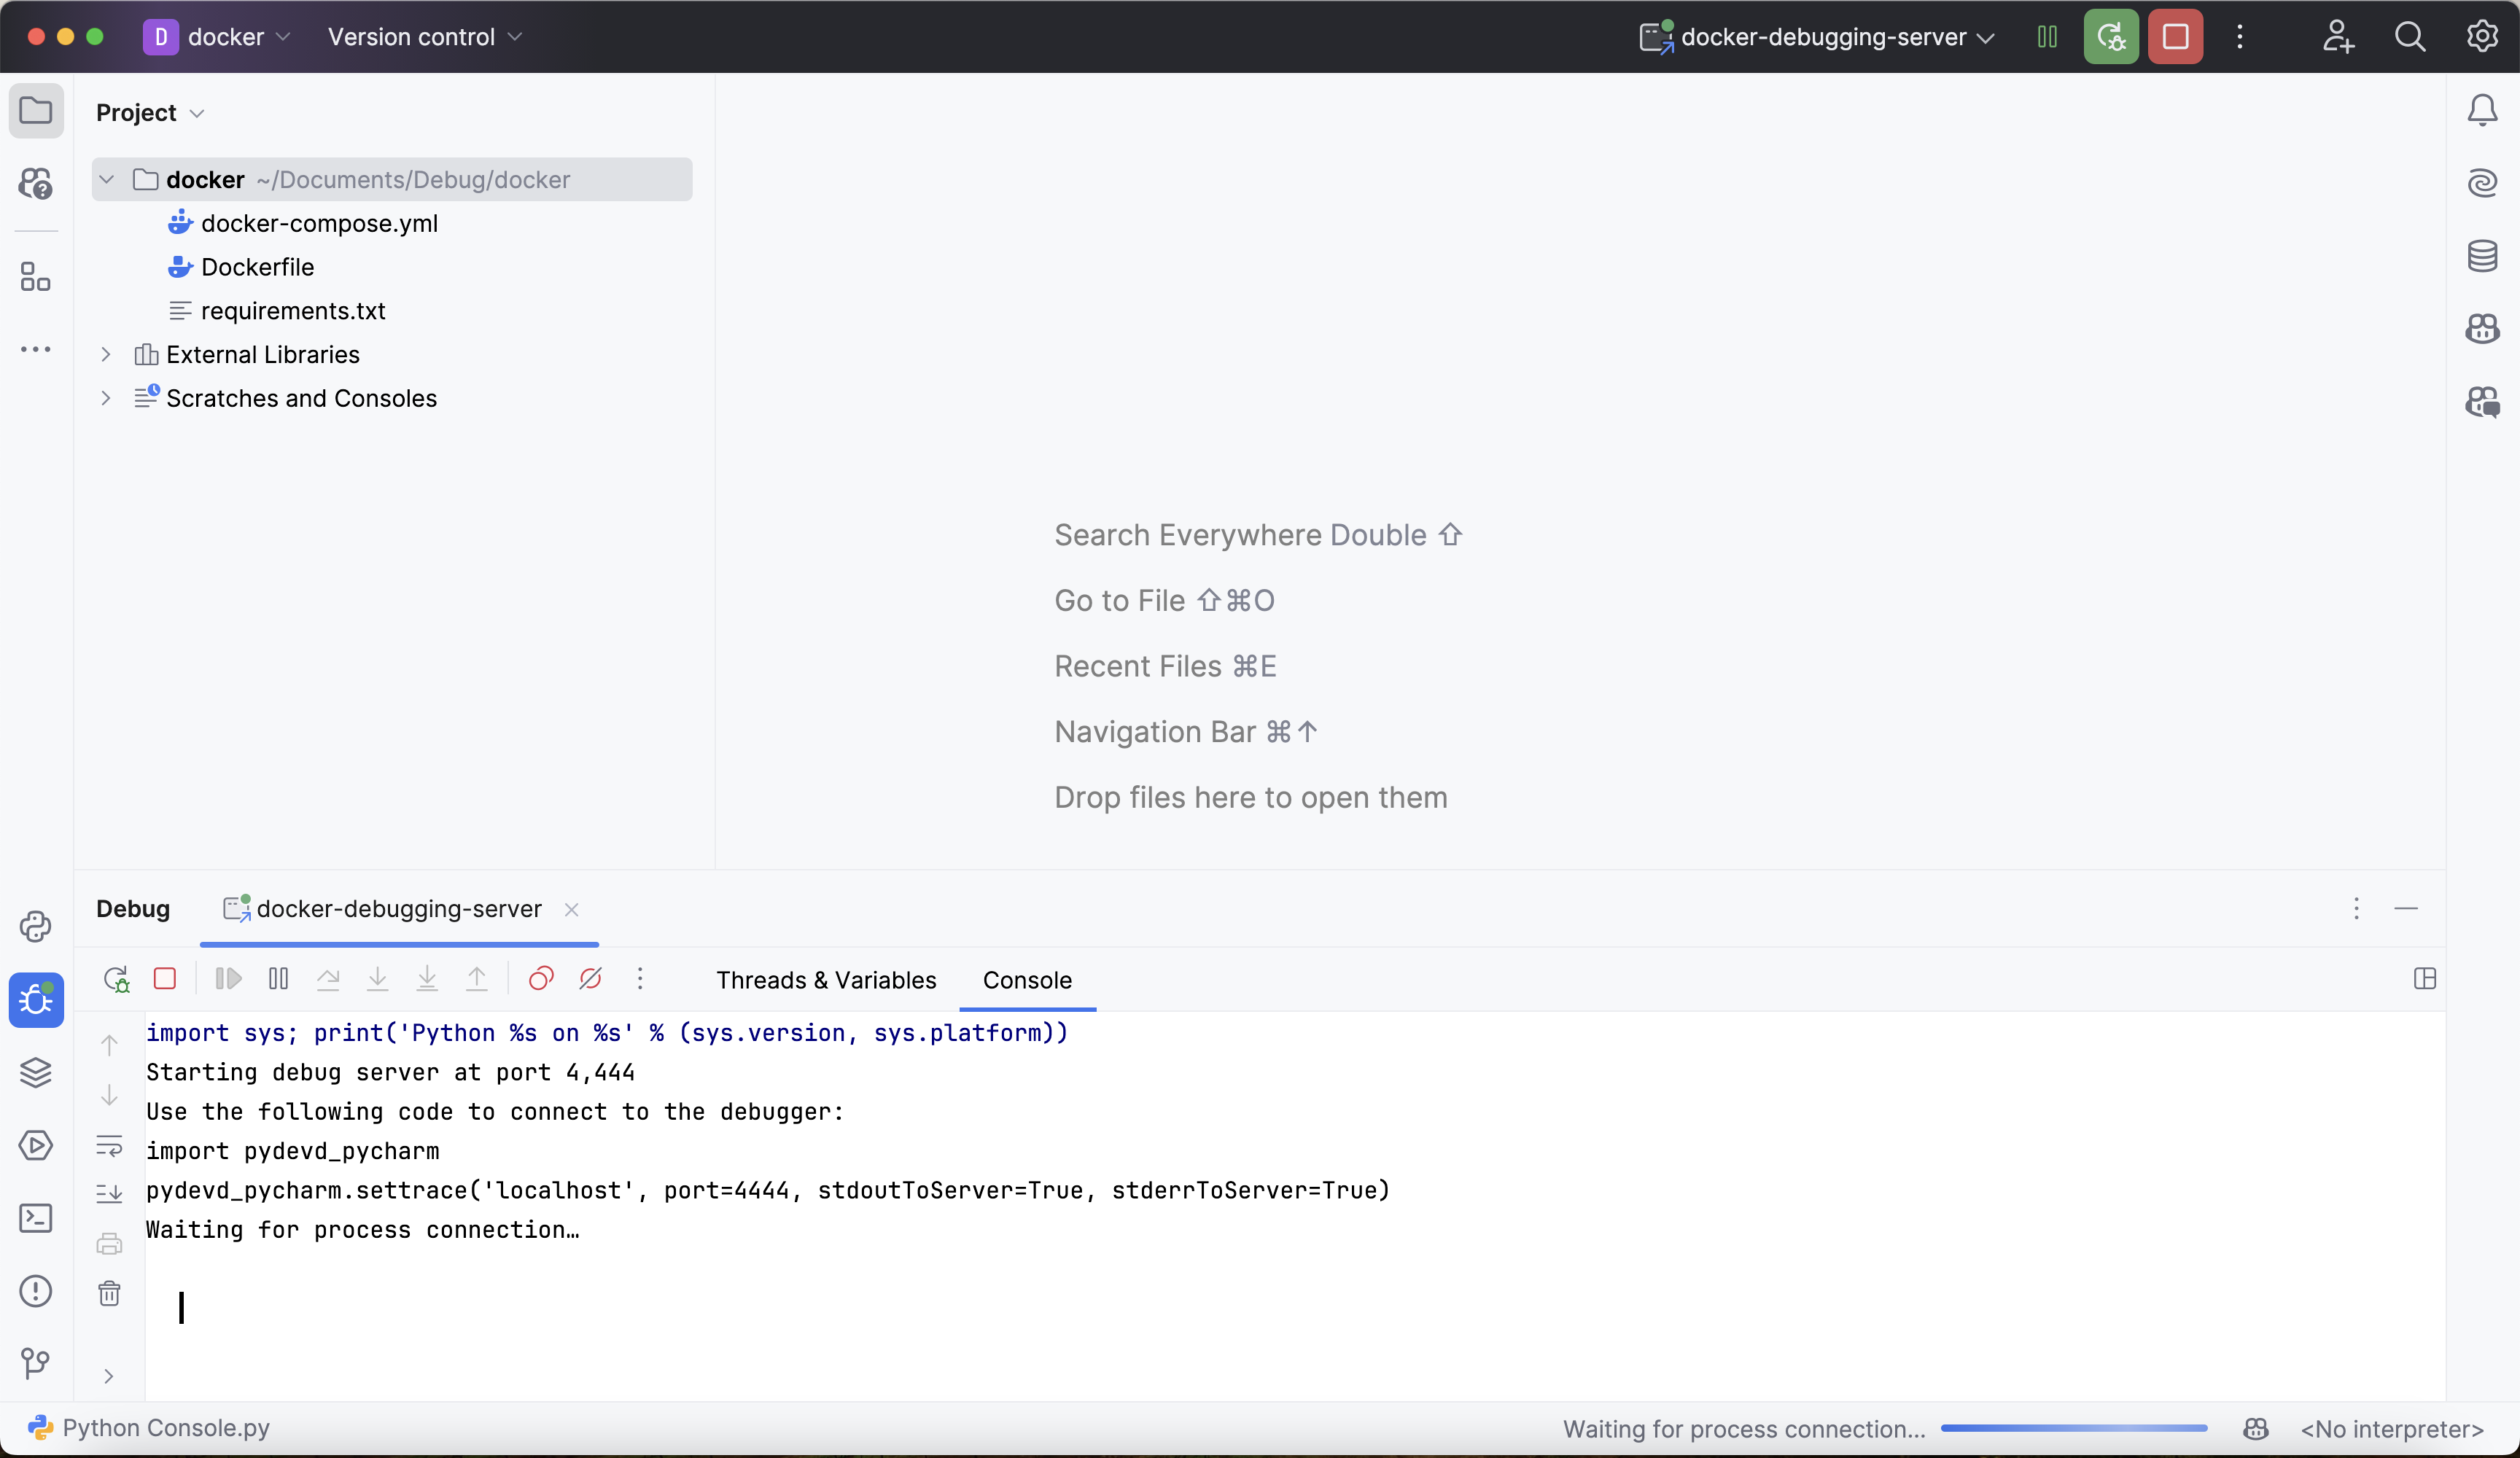
The output above states that the debugger is "waiting for process connection". This means that the debugger is not yet attached to the Deephaven process.
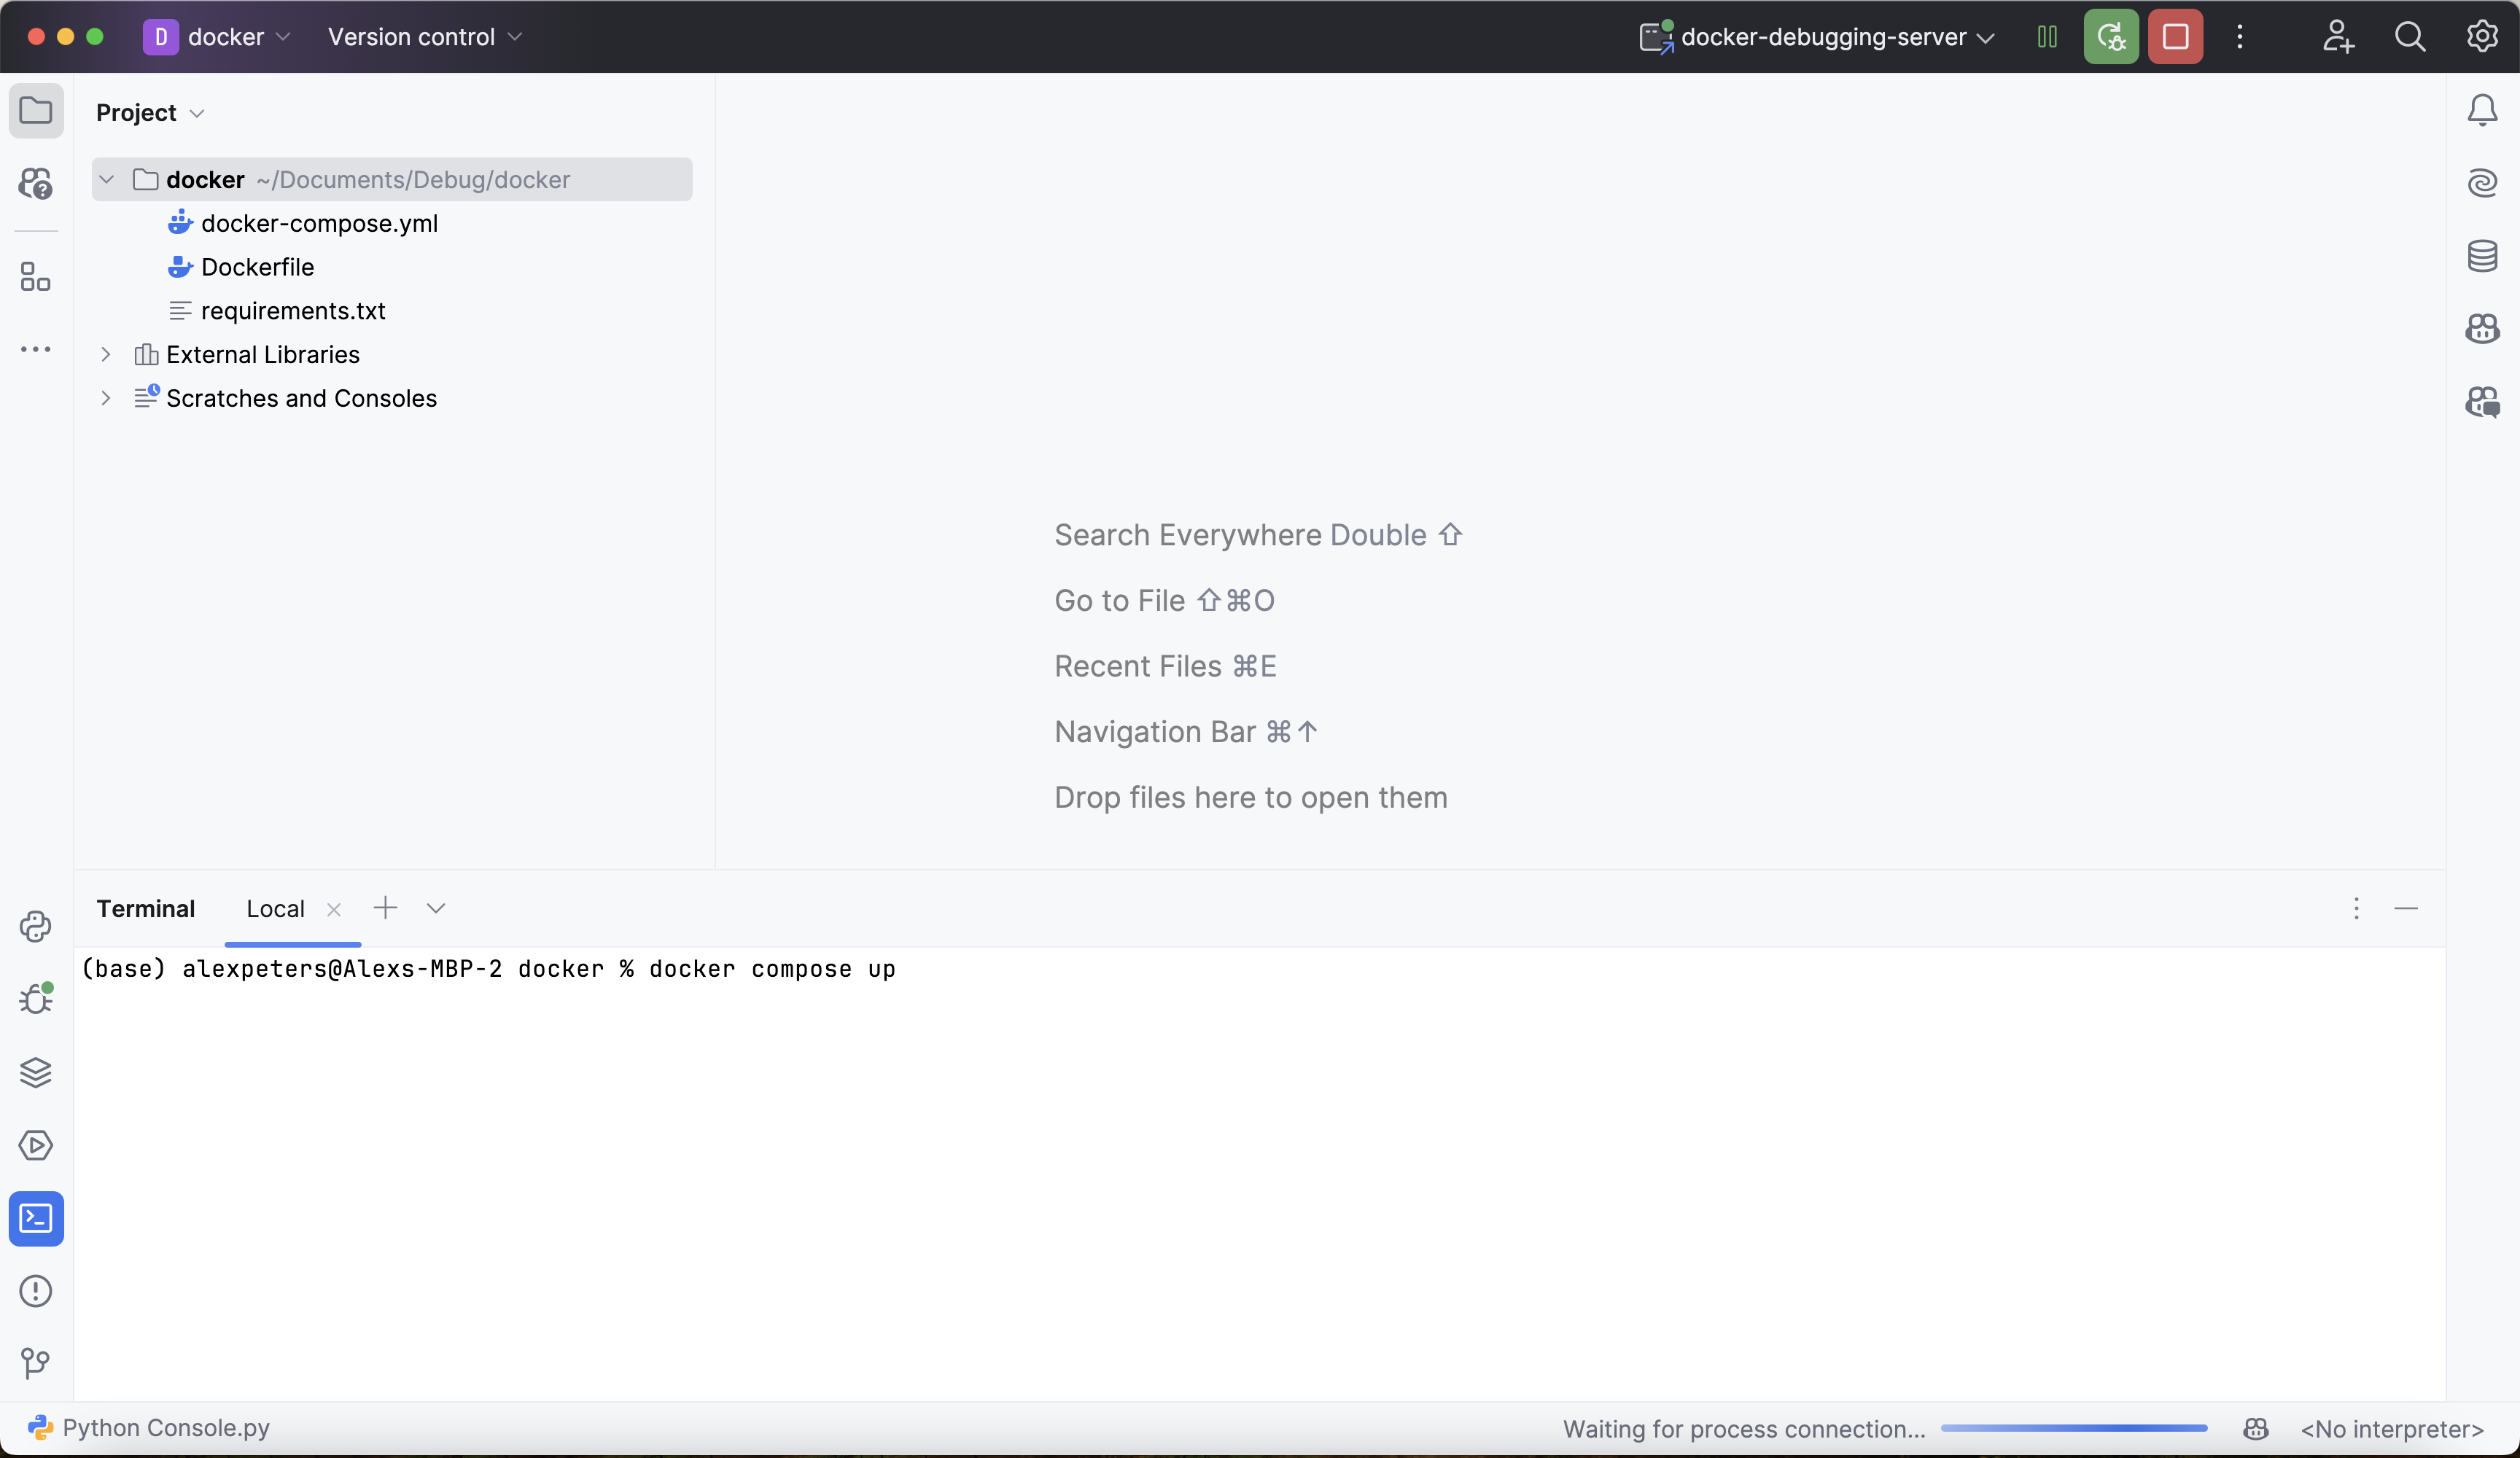
If the Deephaven server with pydevd installed is already running, navigate to the Deephaven IDE. Otherwise, start the server by opening a new PyCharm terminal and running docker compose up in the project root directory:
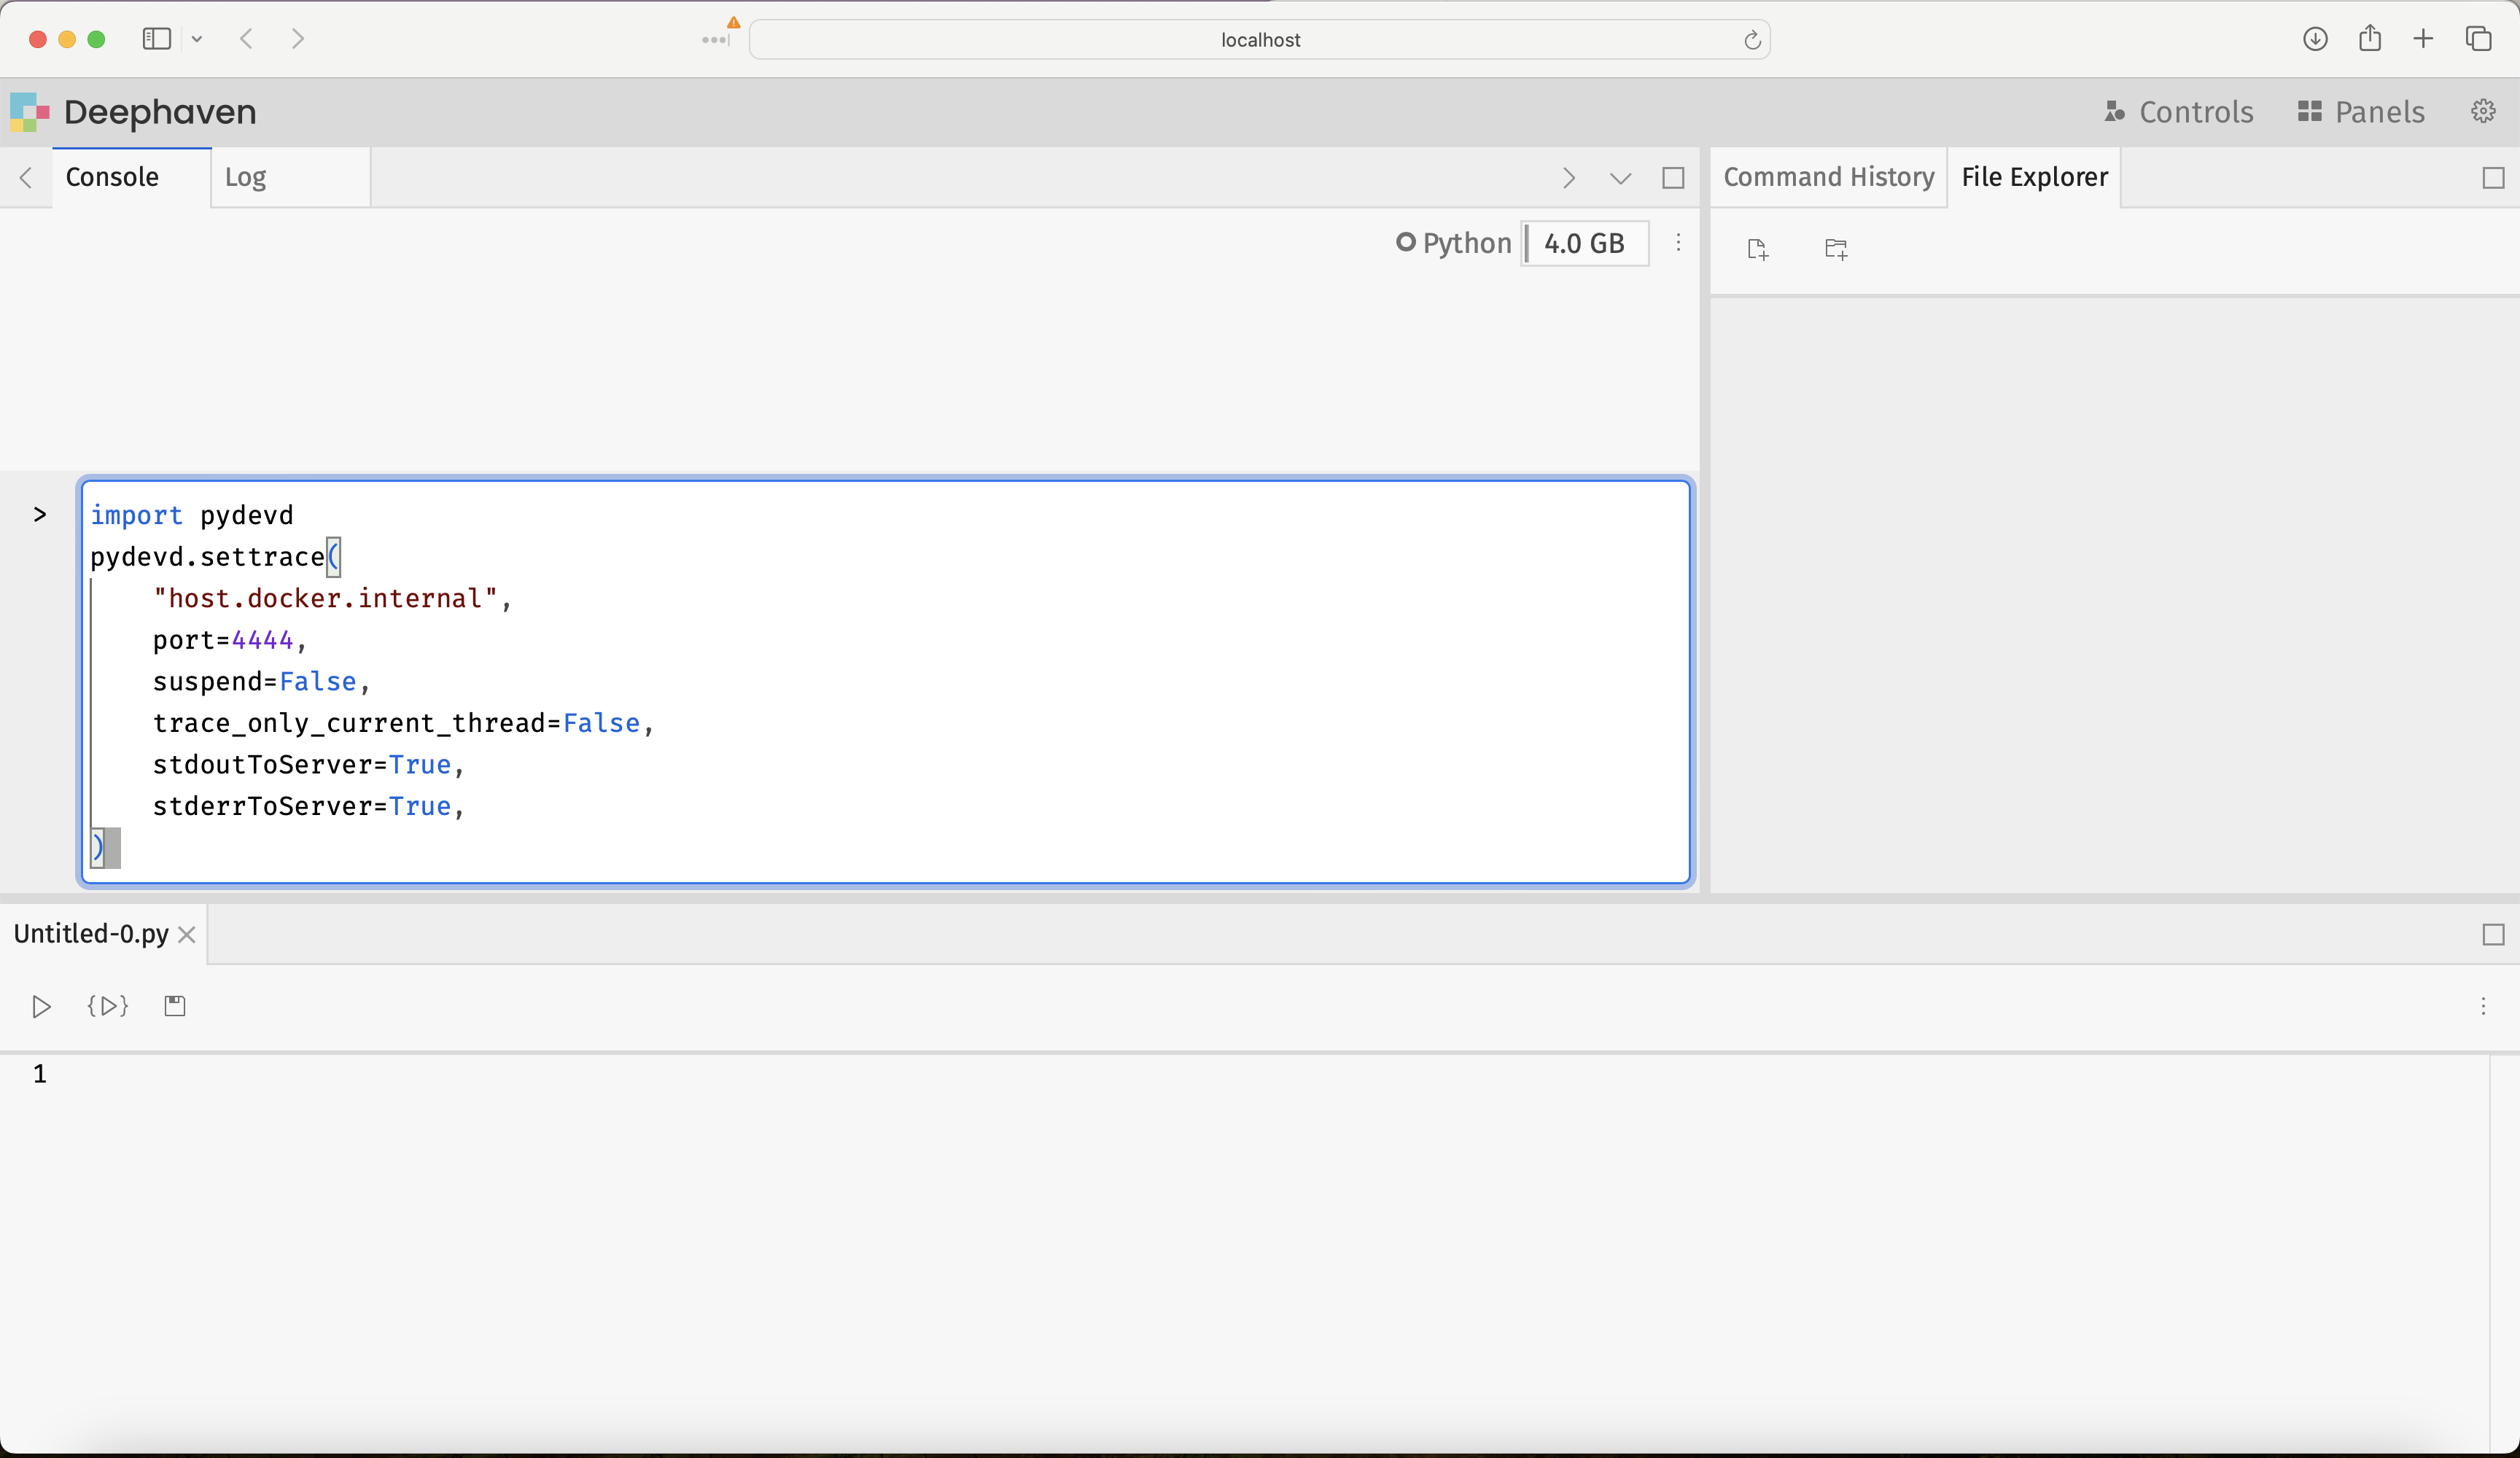
Attach the debugger to Deephaven by executing the following commands in the Deephaven console:
Note
Linux users: host.docker.internal works on Docker Desktop for Mac/Windows. On Linux, use --add-host=host.docker.internal:host-gateway in your docker-compose.yml or replace host.docker.internal with your host machine's IP address (e.g., 192.168.1.x).
Navigate back to PyCharm and verify that Deephaven is connected by finding this new line of output in the debugging console:
This means that the debugger is ready to go!
5. Use the PyCharm debugger
Once connected, you can use the PyCharm debugger in two ways:
- Set breakpoints in PyCharm: Click in the left margin of your code editor to set breakpoints on any line
- Use
pydevd.settrace()in code: Call this function to programmatically pause execution at that point
After the initial connection (step 4), you no longer need to pass parameters to settrace. Here's an example using it as a breakpoint:
Navigating over to PyCharm, the debugger's full suite of capabilities is on offer. It can assist in stepping through Deephaven source code, setting breakpoints to halt execution, inspecting variables and intermediate values from deep within function calls, and much more. Many resources are available online for using PyCharm's debugger, and this Jetbrains guide is a good starting point.
There are some Deephaven-specific things to consider when debugging. Check out Common problems for issues specific to debugging Deephaven's table operations and ticking tables.
Troubleshooting
Debugger won't connect
Problem: pydevd.settrace() fails with connection error.
Solutions:
- Verify the PyCharm debug server is running (green bug icon should be active).
- Check that port 4444 is not blocked by a firewall.
- On Linux, verify
host.docker.internalis correctly configured. - Ensure the port in
settracematches the PyCharm configuration.
Path mapping not working
Problem: When stepping through code in PyCharm, source files don't match or show incorrectly.
When this matters: Path mapping is primarily needed when stepping into Deephaven's internal source code or debugging Python files mounted into the container. It's less critical for console-based debugging with pydevd.settrace().
Solutions:
- Verify the local path in PyCharm configuration points to your actual project directory (absolute path).
- Ensure the remote path is
/app(the Deephaven container's working directory). - If debugging mounted Python files, verify your volume mappings in docker-compose.yml match the path configuration.
Debugger disconnects after attaching
Problem: Connection is established but immediately drops.
Solutions:
- Ensure anonymous authentication is enabled in docker-compose.yml (see the configuration in step 1).
- Review PyCharm debug console for error messages that indicate the disconnect cause.
- Try increasing JVM memory if you see out-of-memory errors (adjust
-Xmx4gin START_OPTS).
Version compatibility issues
Problem: Debugger behaves unexpectedly, shows errors, or features don't work.
Solutions:
- Verify PyCharm version is 2024 or higher (earlier versions have known compatibility issues).
- Check that
pydevdversion is compatible with your PyCharm version.- Run
pip show pydevdin the container to check the installed version. - PyCharm may suggest a specific version in the debug server configuration.
- Run
- If versions mismatch, reinstall
pydevdwith the version PyCharm recommends.