Debug pip-installed Deephaven with PyCharm
This guide shows you how to set up a debugger for pip-installed Deephaven.
With pip-installed Deephaven, there are two main debugging approaches:
-
Local debugging with IDE scripts (Recommended): Write your Deephaven code in Python scripts and use your IDE's built-in debugger. This works with PyCharm Community/Professional and VS Code. This is the simpler approach.
-
Remote debugging with Deephaven web IDE (Advanced): Use the Deephaven web IDE to run queries and connect a remote debugger from PyCharm Professional. This requires more setup but allows debugging code written in the Deephaven console.
This guide covers both approaches.
Setup
Every case covered in this guide assumes that Deephaven is installed in a Python virtual environment. This is the strongly-recommended approach to using pip-installed Deephaven. Create and activate a virtual environment as follows:
This creates a virtual environment called dh-venv and makes it usable. The rest of this guide assumes that your virtual environment is called dh-venv.
Then, install Deephaven into this environment using pip:
PyCharm
Warning
Debugging Deephaven with PyCharm has only been shown to work for PyCharm major version 2024 or higher. Some issues have been discovered with using PyCharm 2023, and there is no plan to fix these issues.
With the proper setup, PyCharm's built-in debugger works well with Deephaven scripts hosted in PyCharm. The steps given here will work with both PyCharm Community Edition and PyCharm Professional. If an existing PyCharm project is set up for using pip-installed Deephaven, skip to step 2.
1. Create and configure PyCharm project
First, create a new PyCharm project from the directory containing the dh-venv virtual environment. The fresh PyCharm project looks like this:
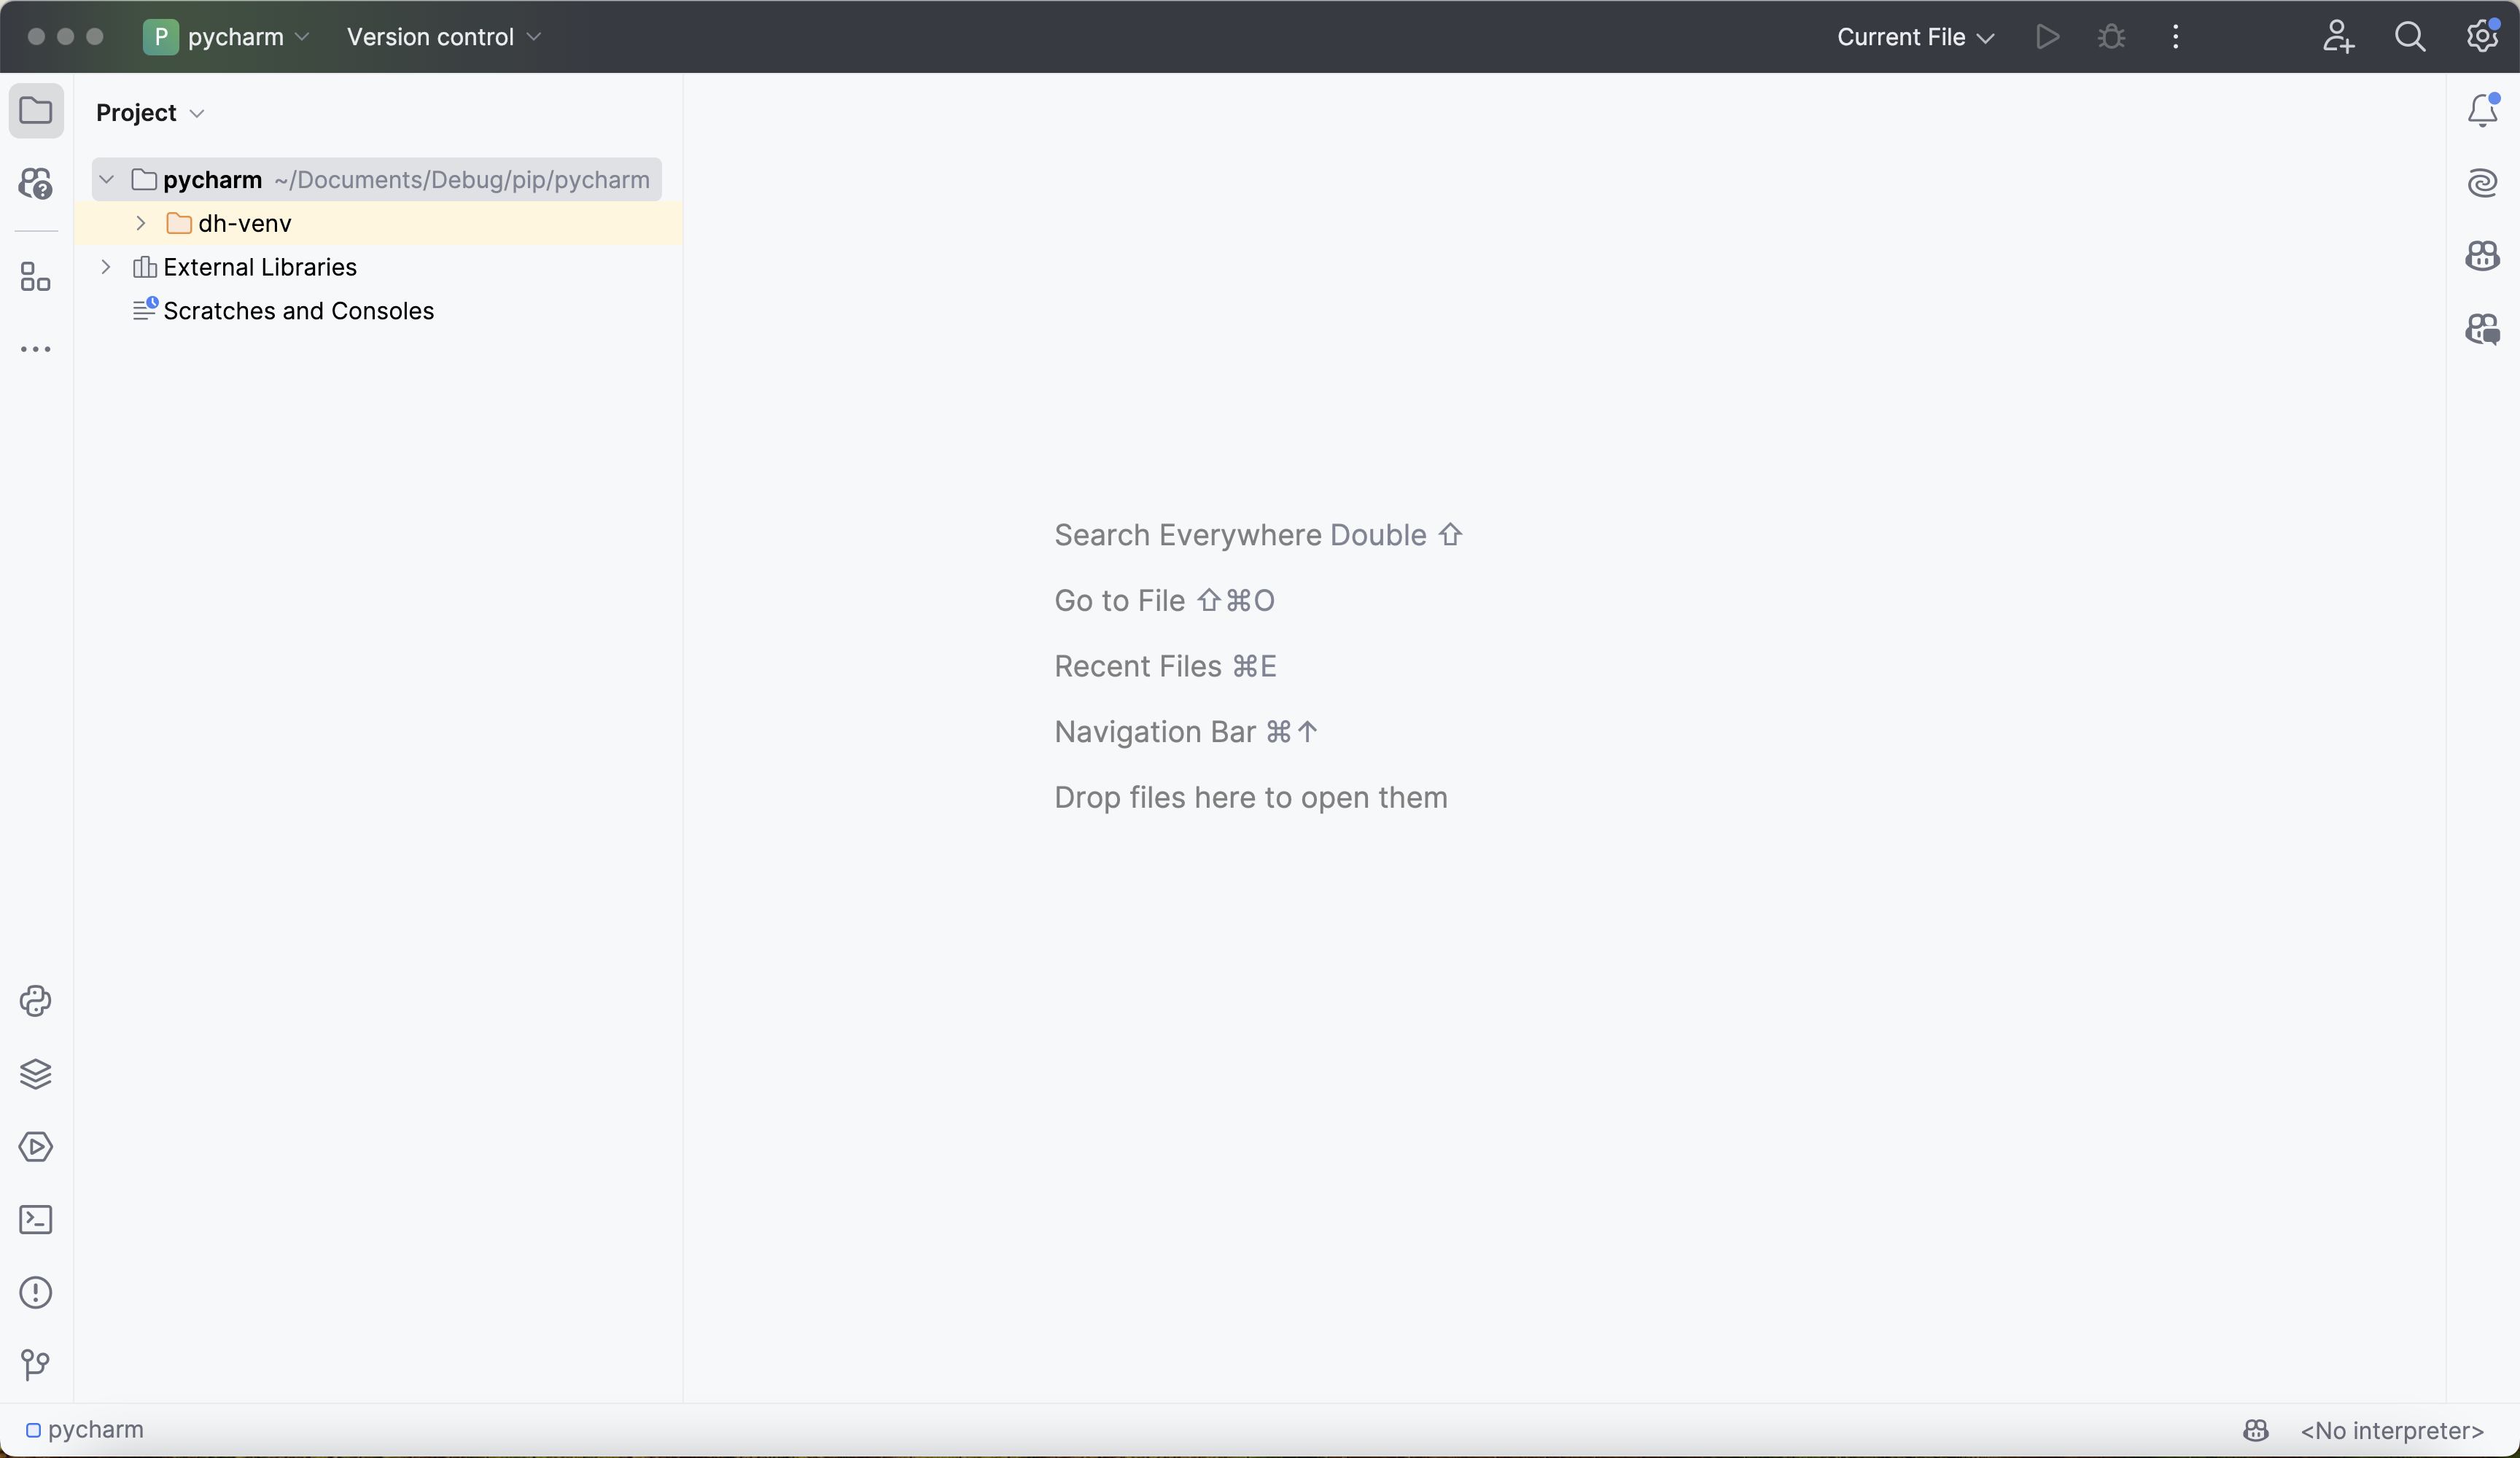
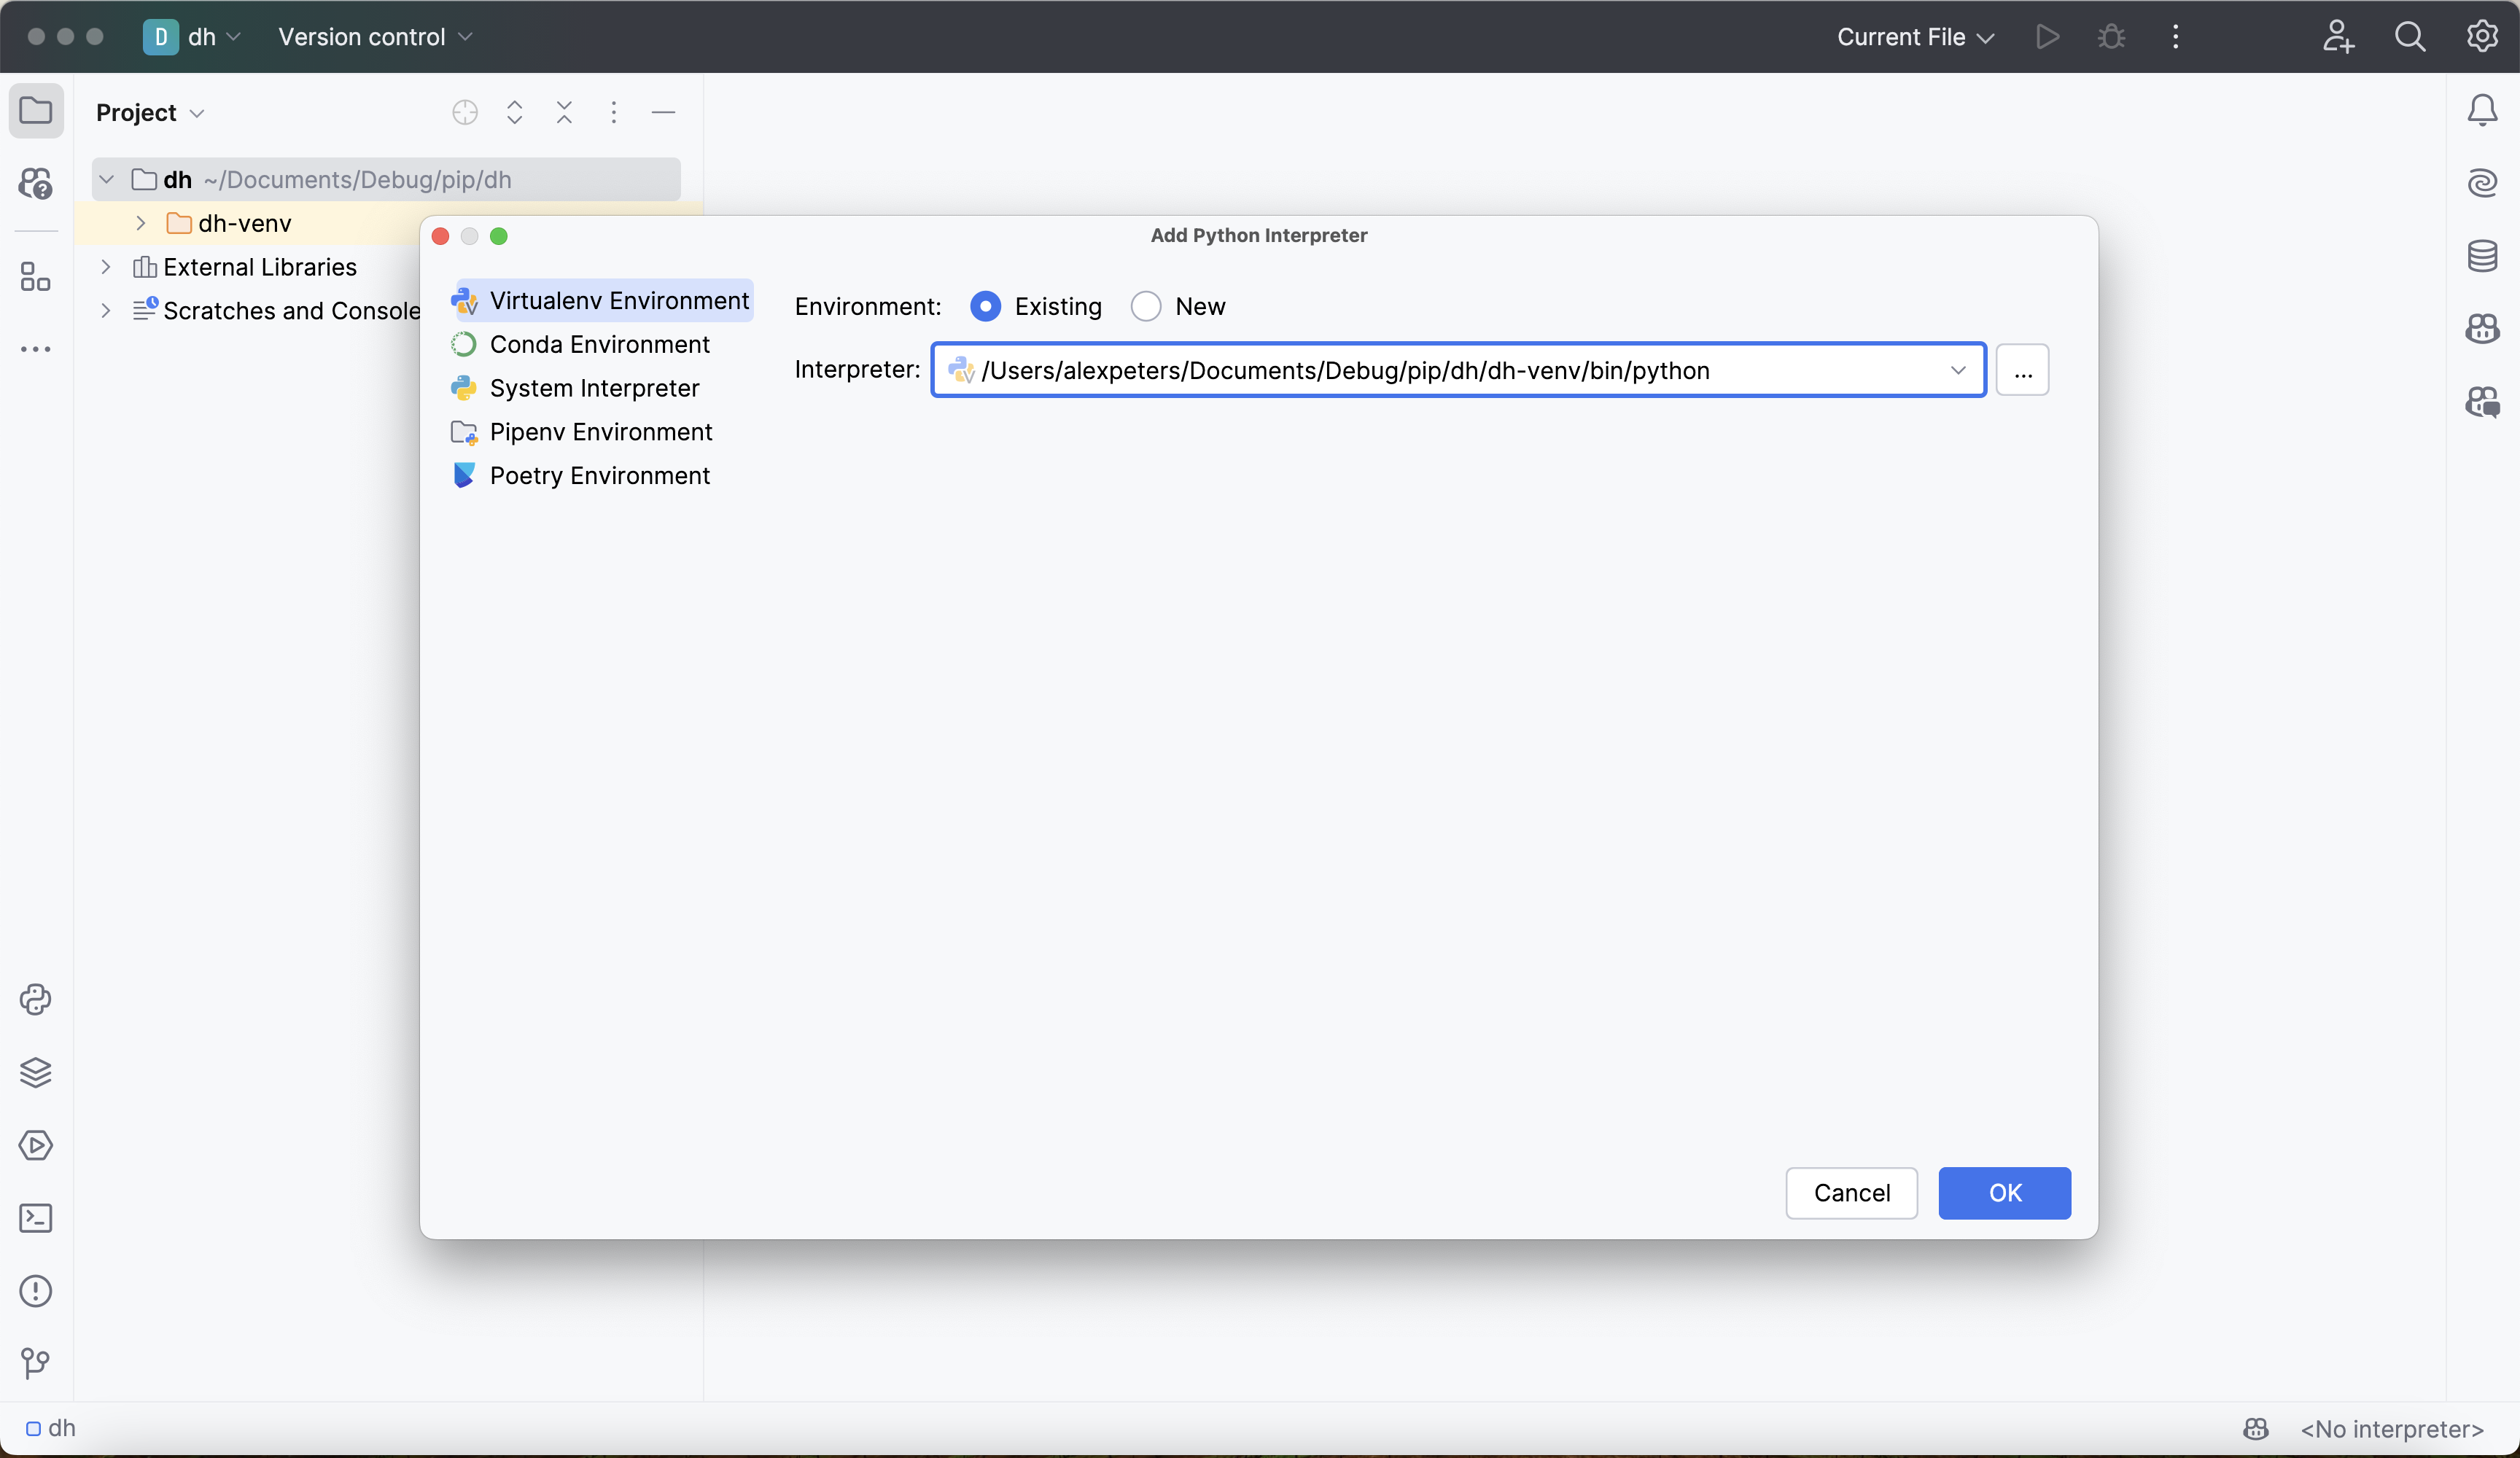
Next, click on No interpreter in the bottom-right-hand corner, click Add New Interpreter > Add Local Interpreter, select Existing, and navigate to the python executable in dh-venv:
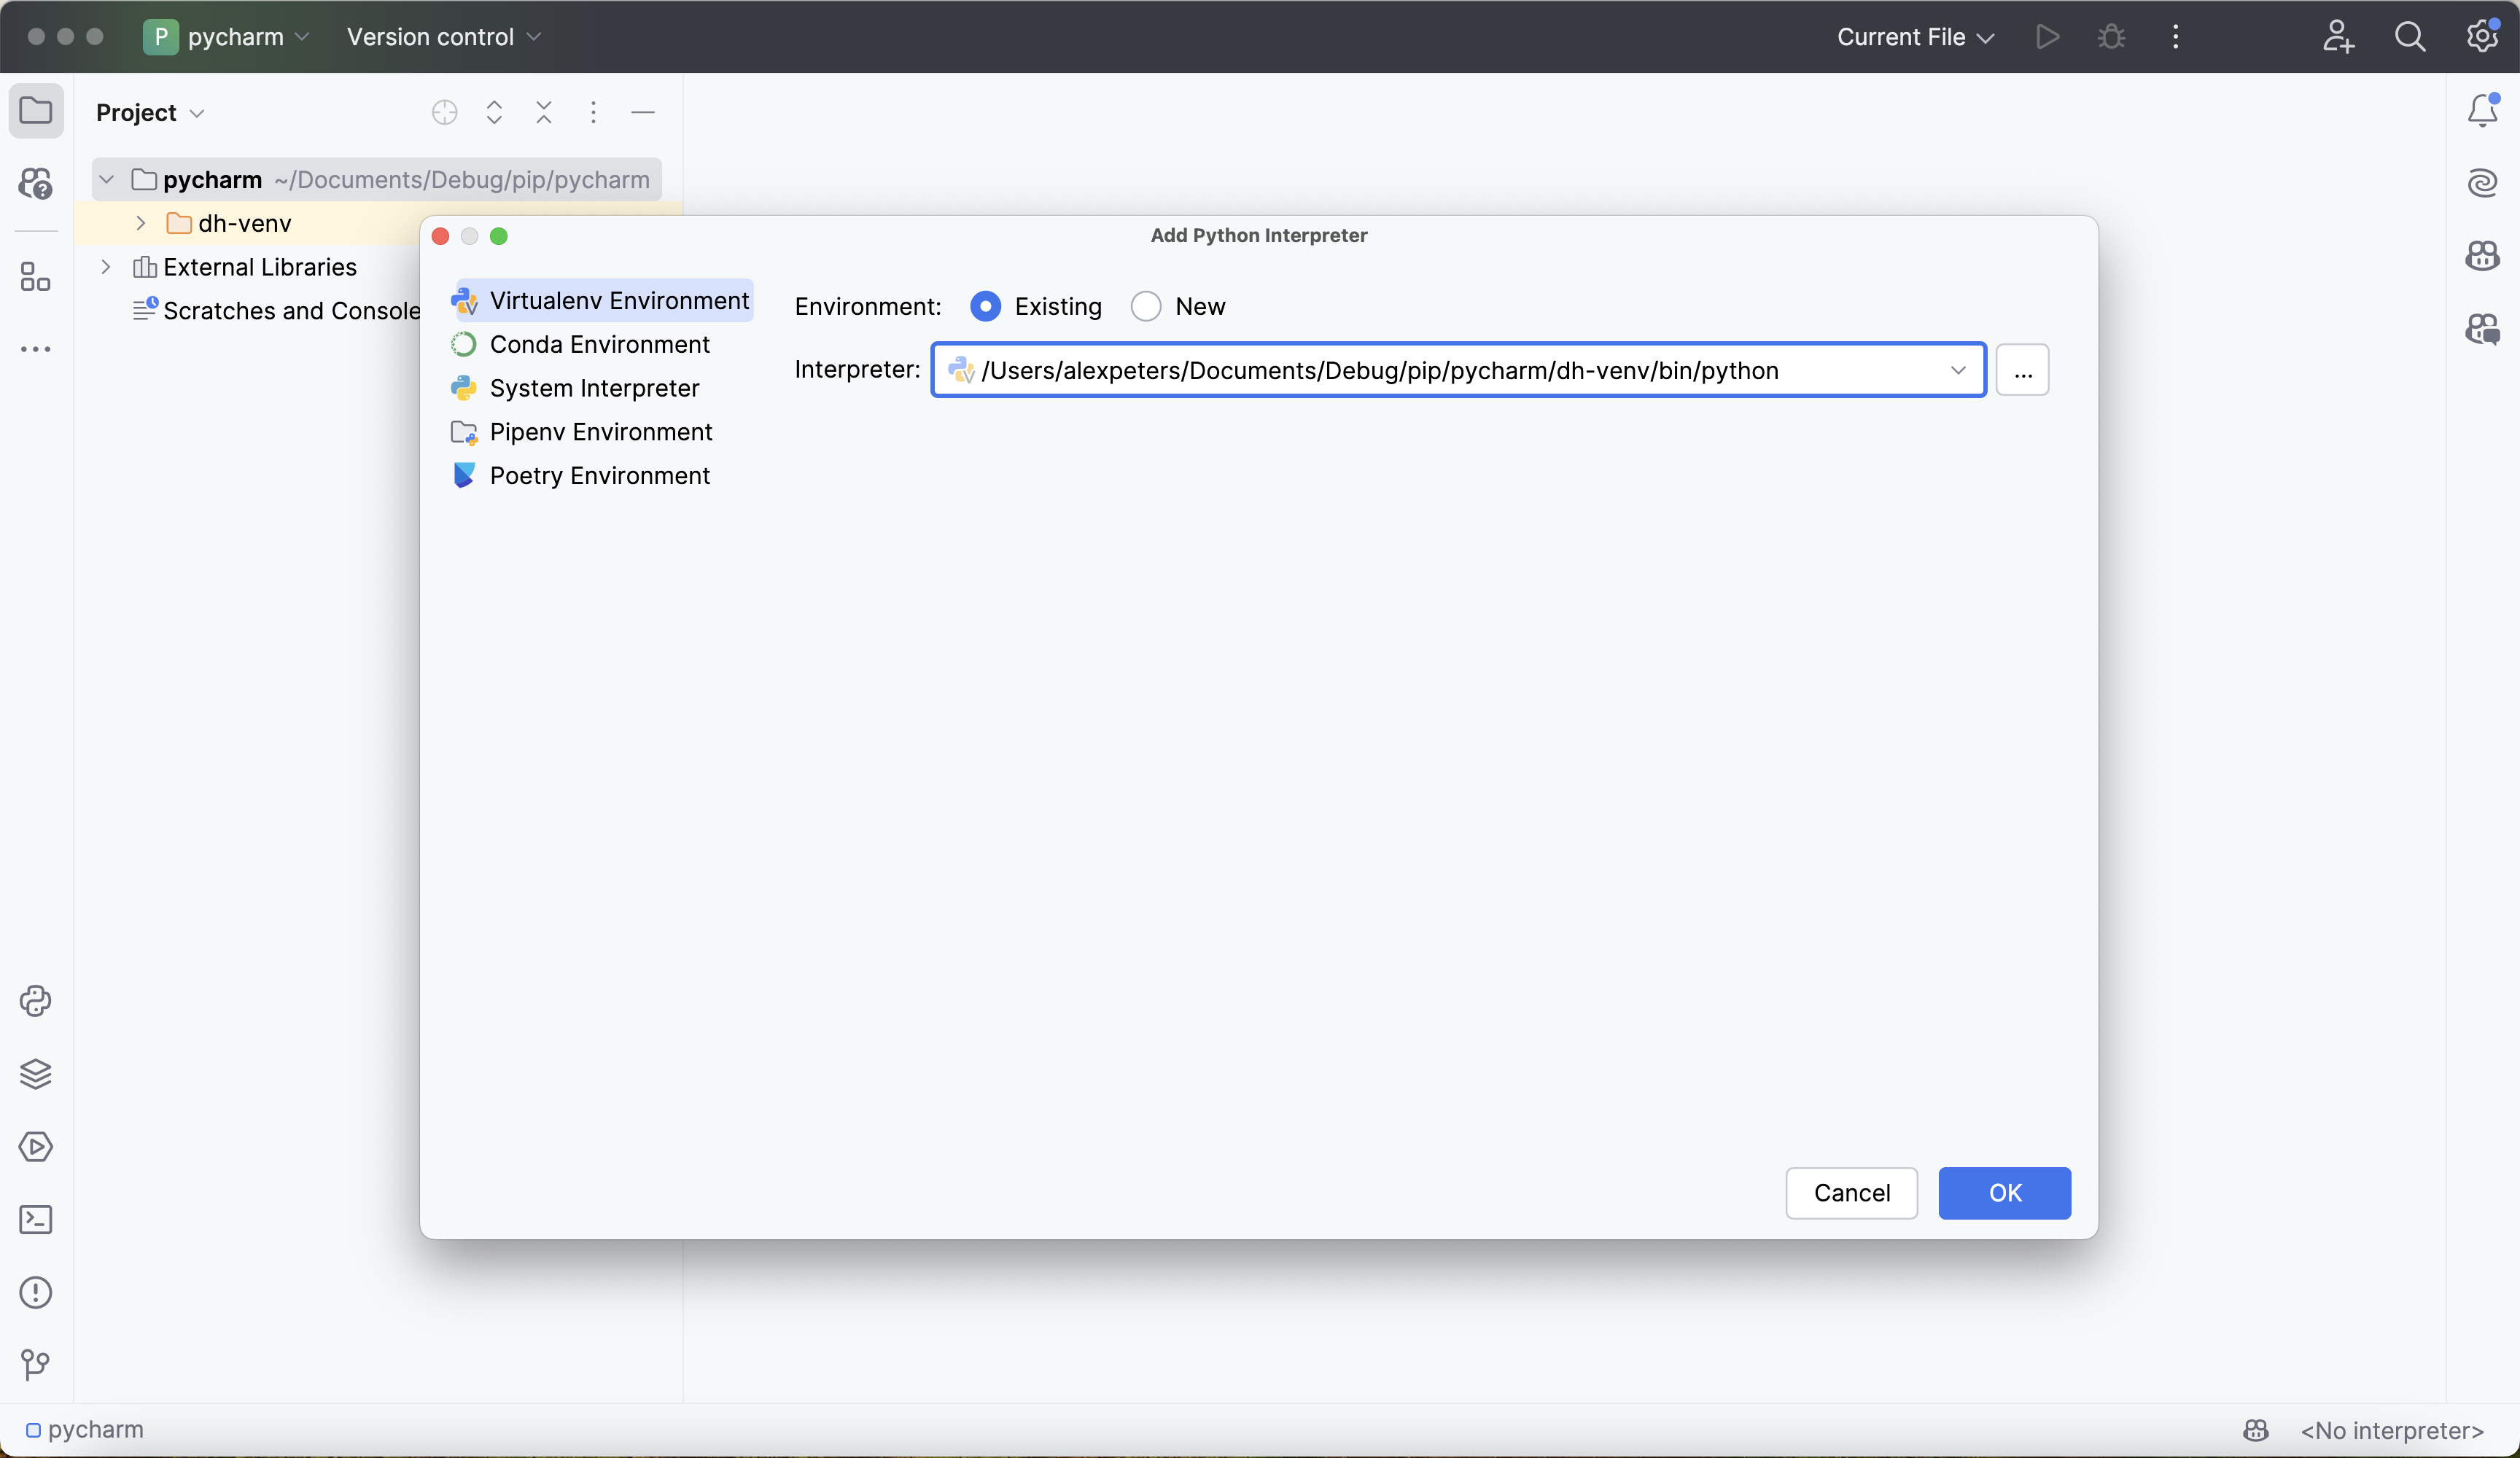
Click OK.
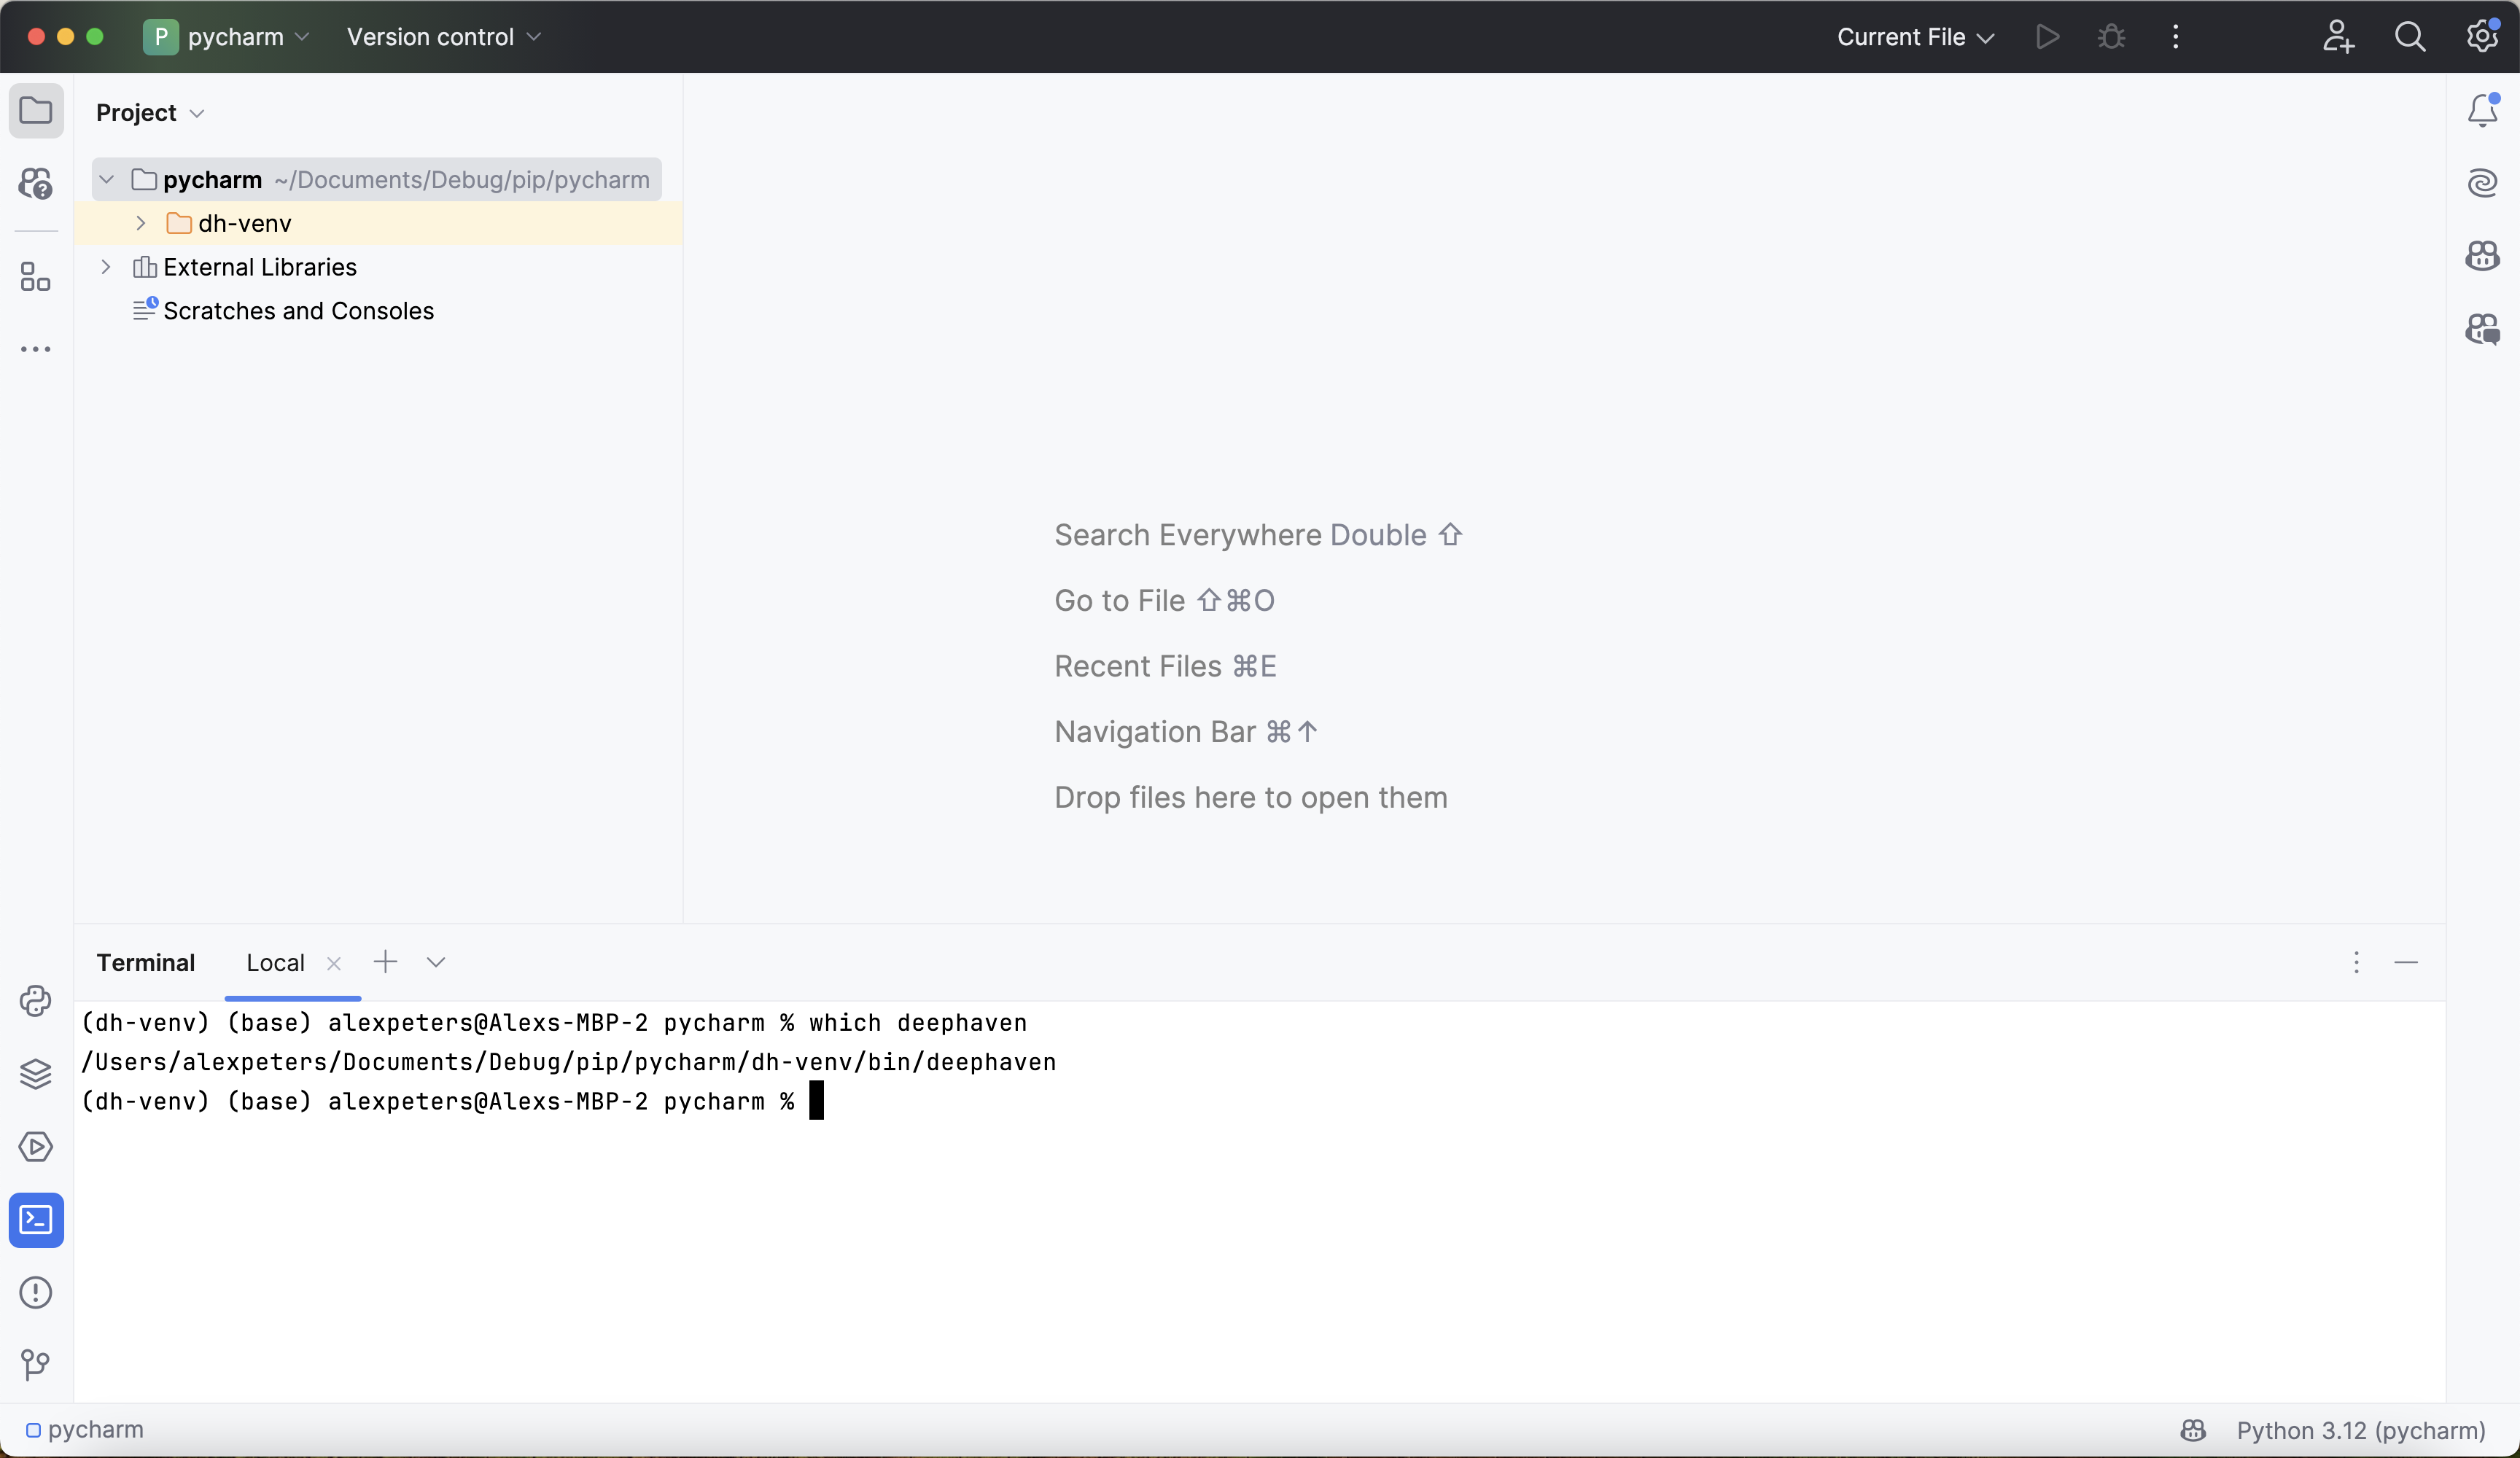
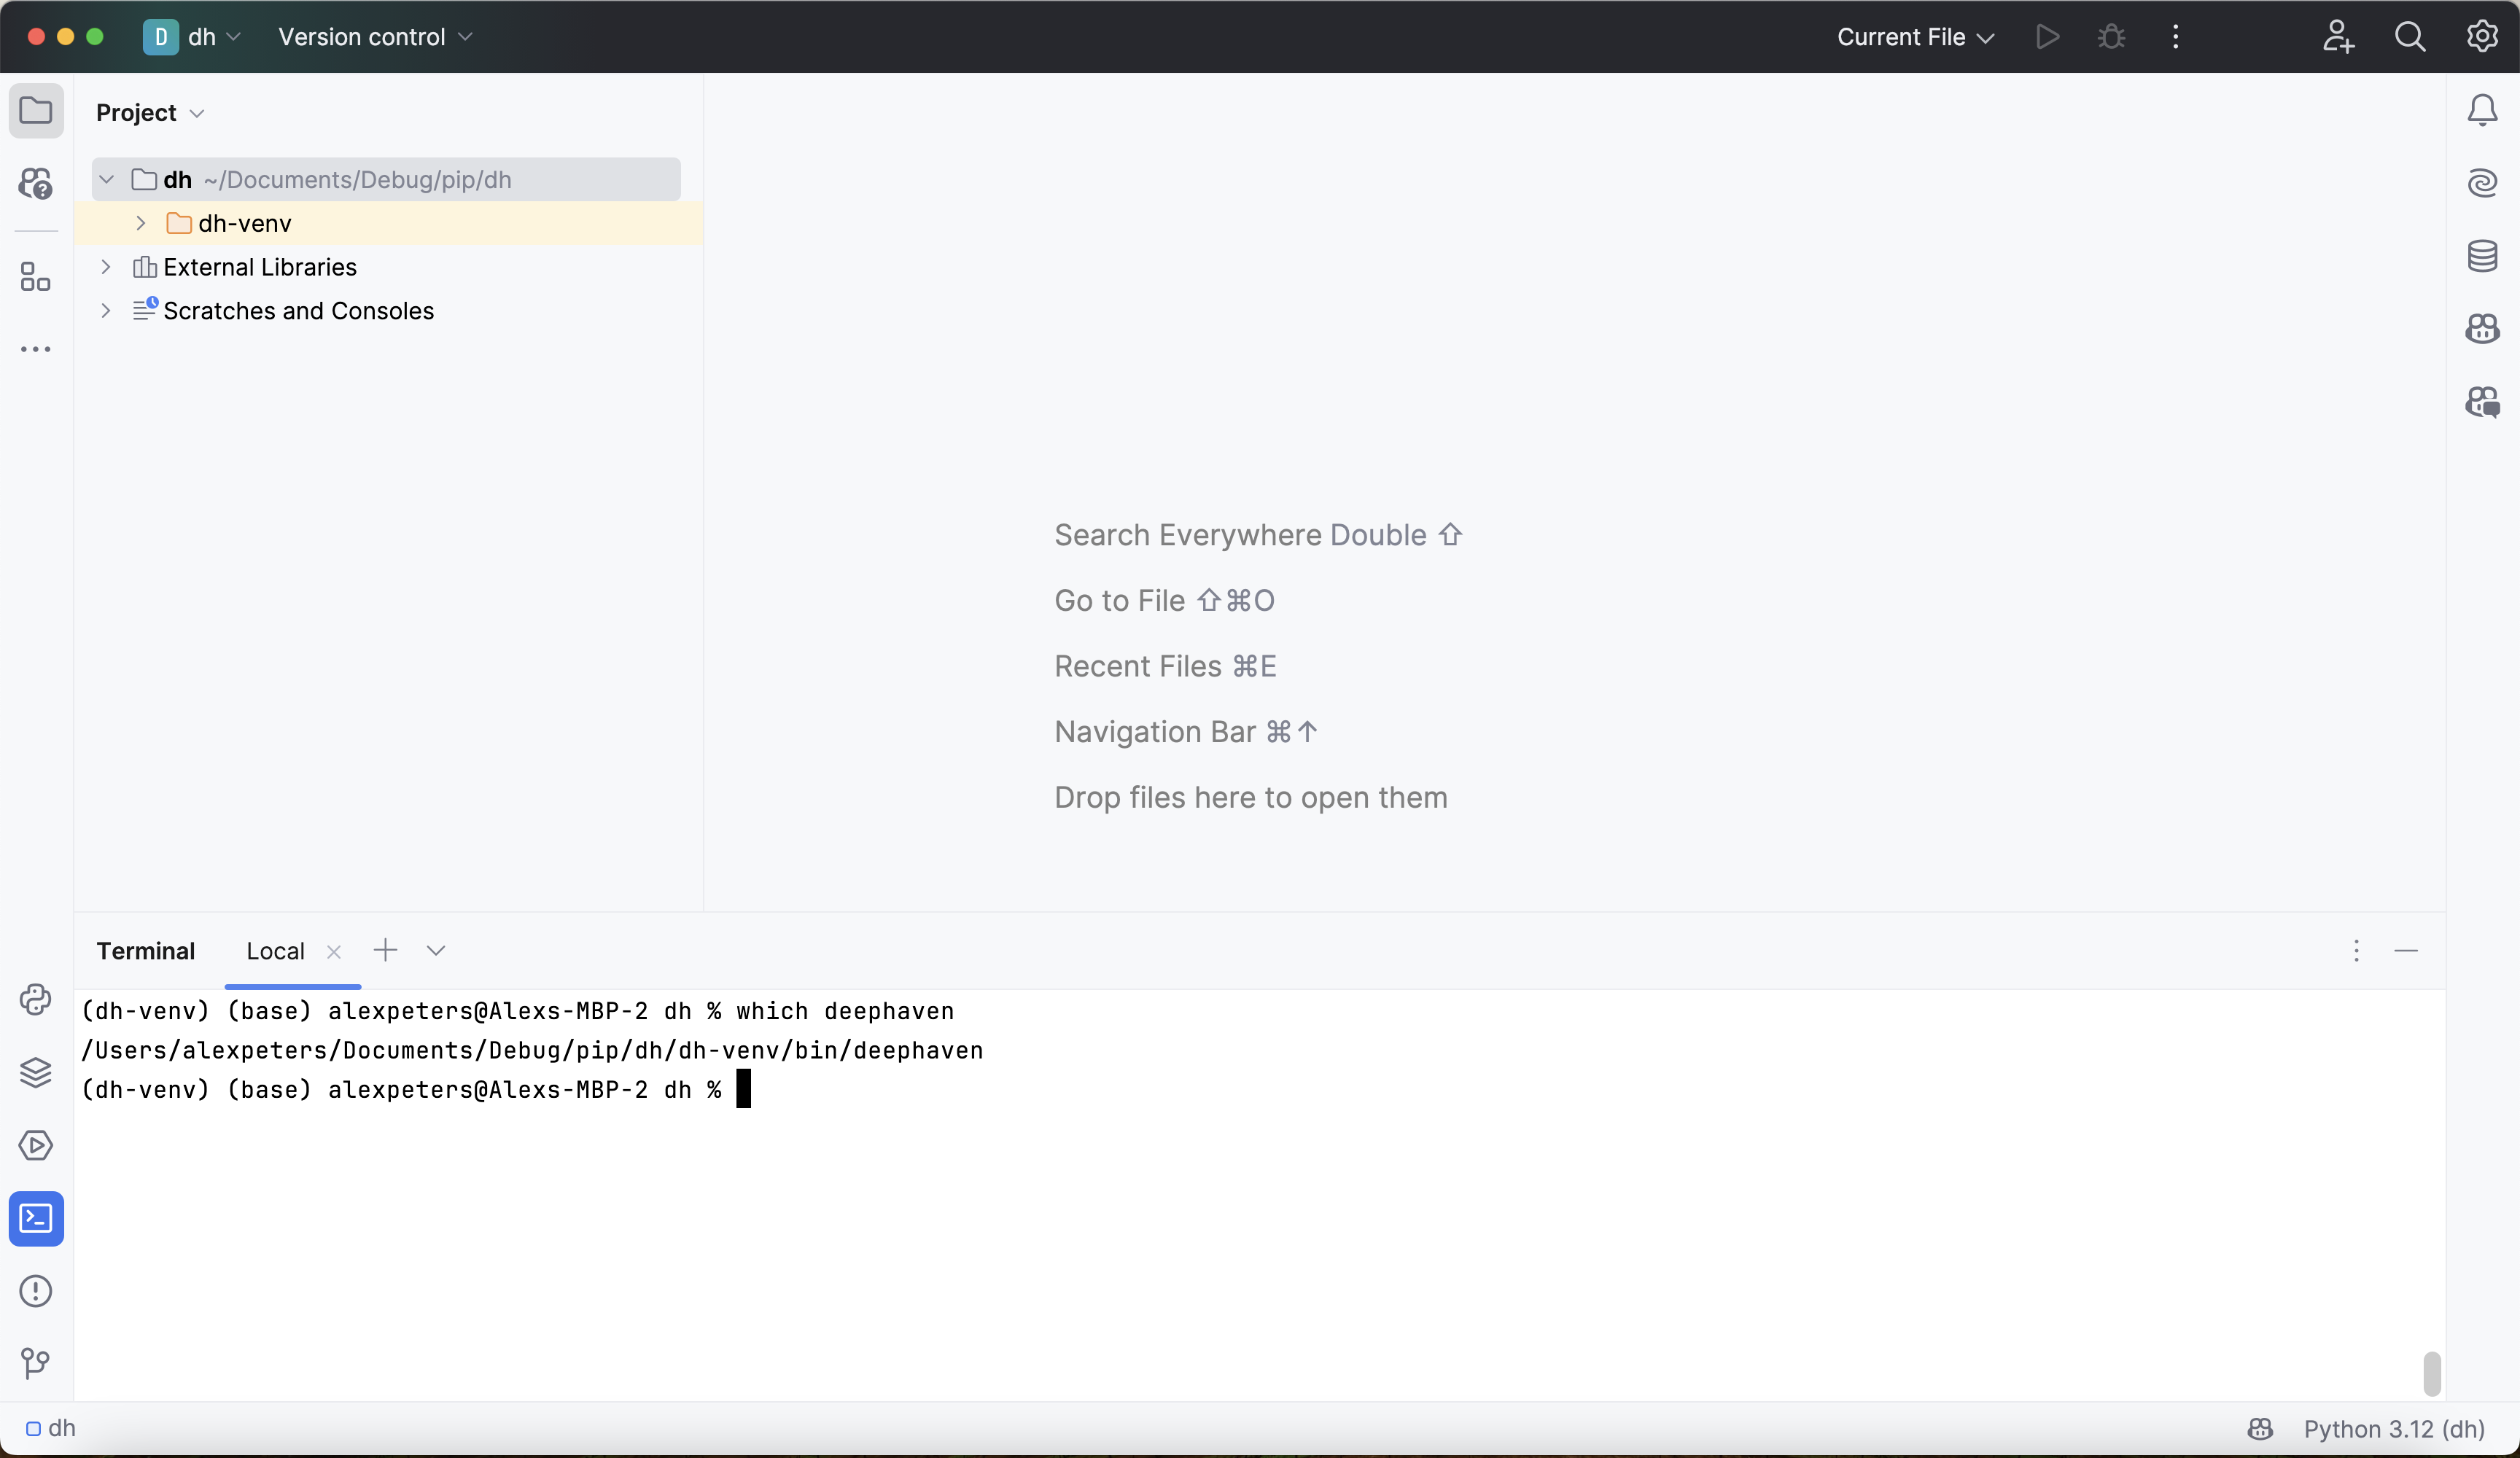
Verify that the interpreter is configured correctly by opening the terminal and running which deephaven. It should return the path of the deephaven package inside of dh-venv:
2. Test debugger
To ensure that PyCharm's debugger will run correctly with Deephaven, create a test script called script.py that starts and uses the Deephaven server:
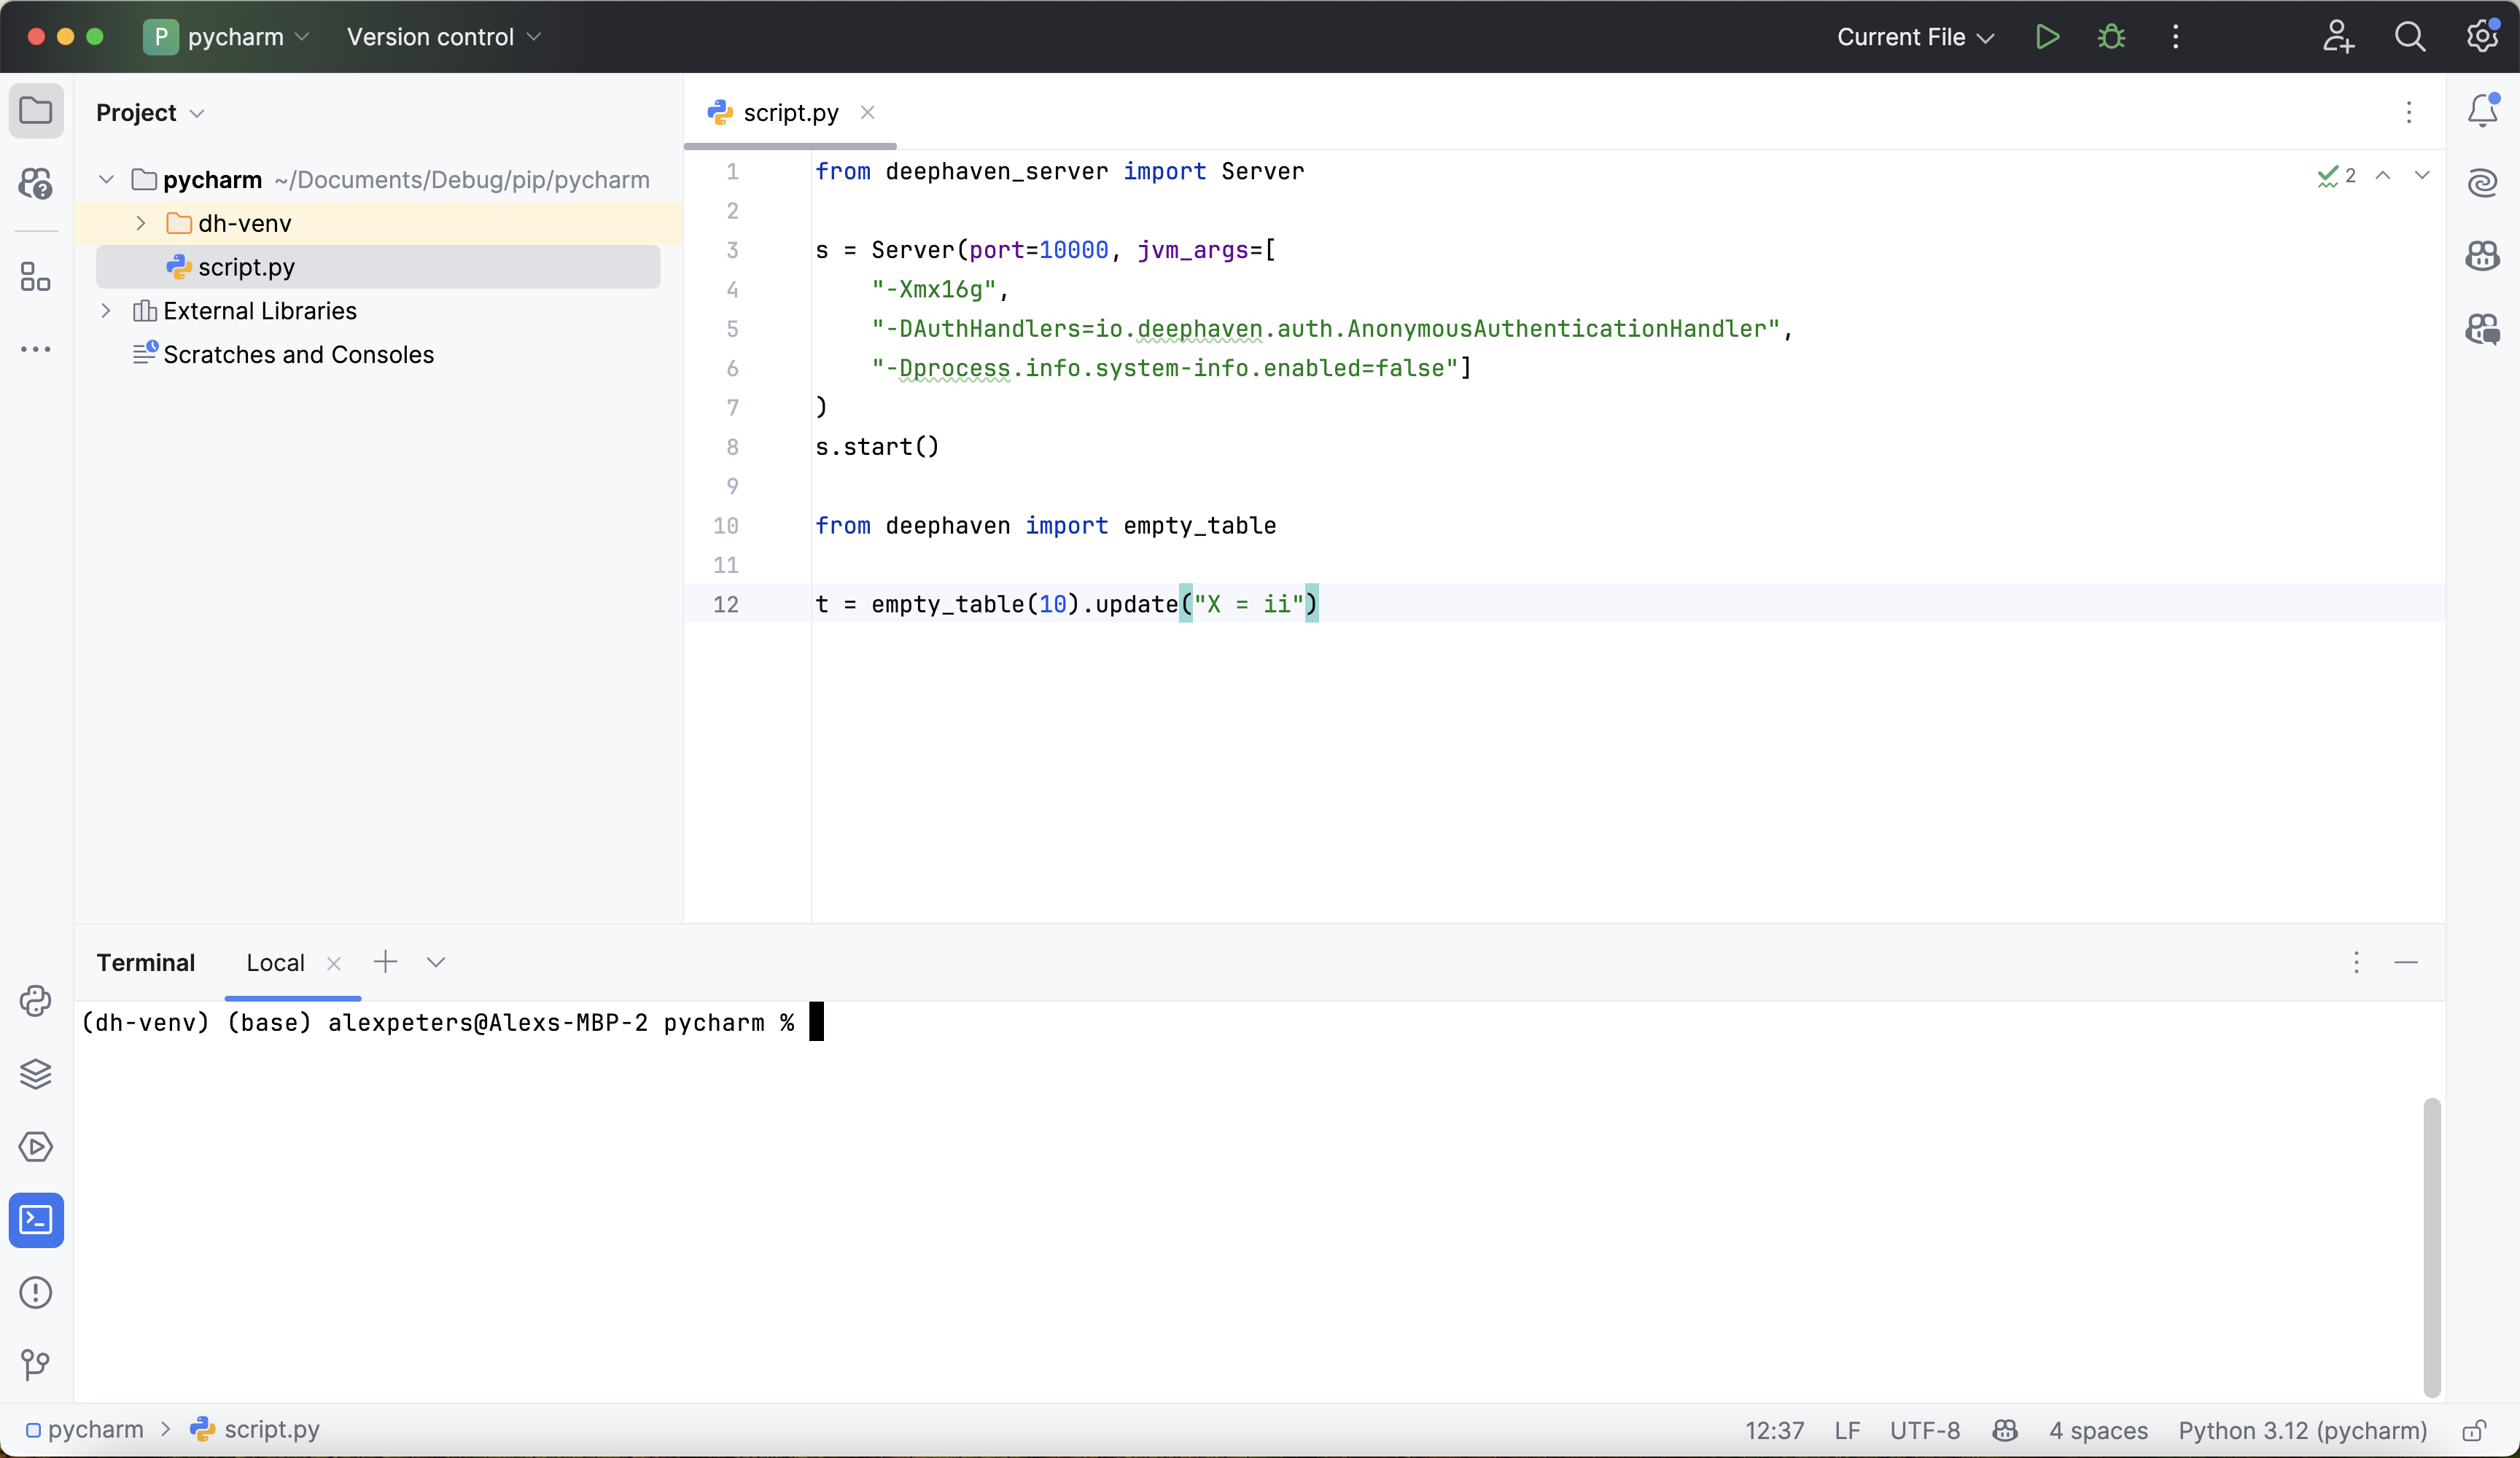
Expand for test script
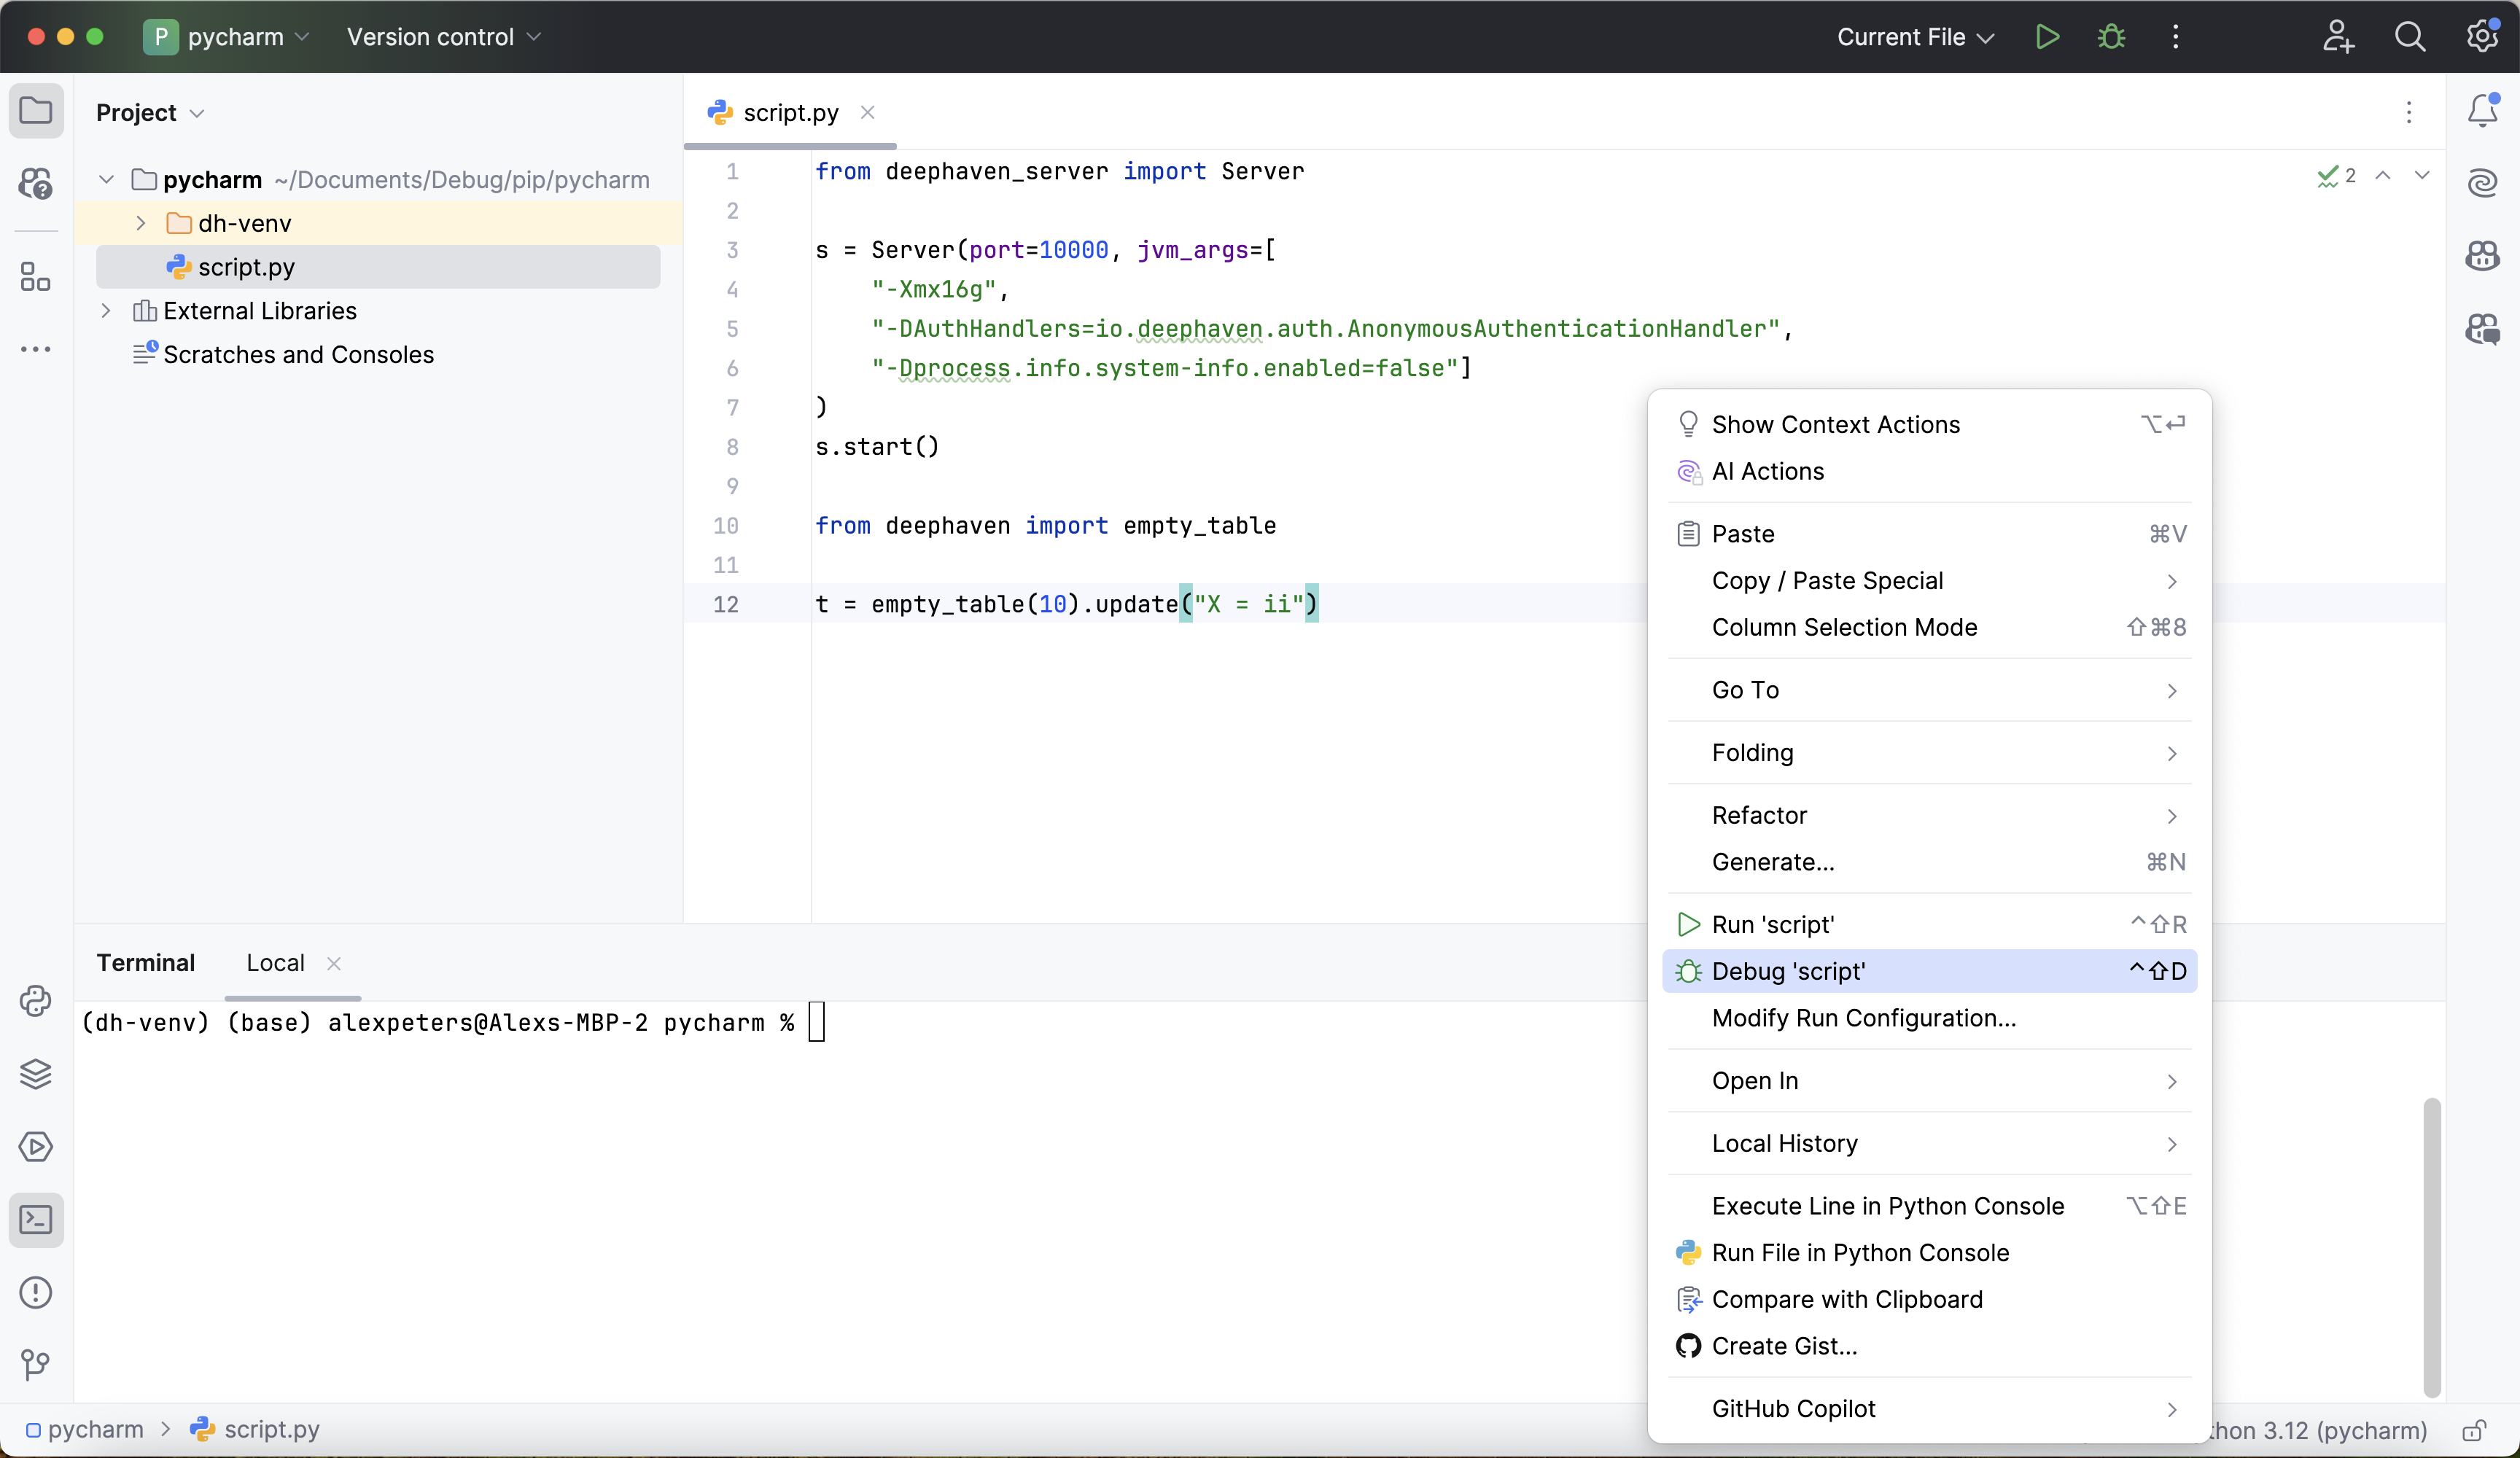
Then, right-click anywhere in the editor window and select Debug 'script':
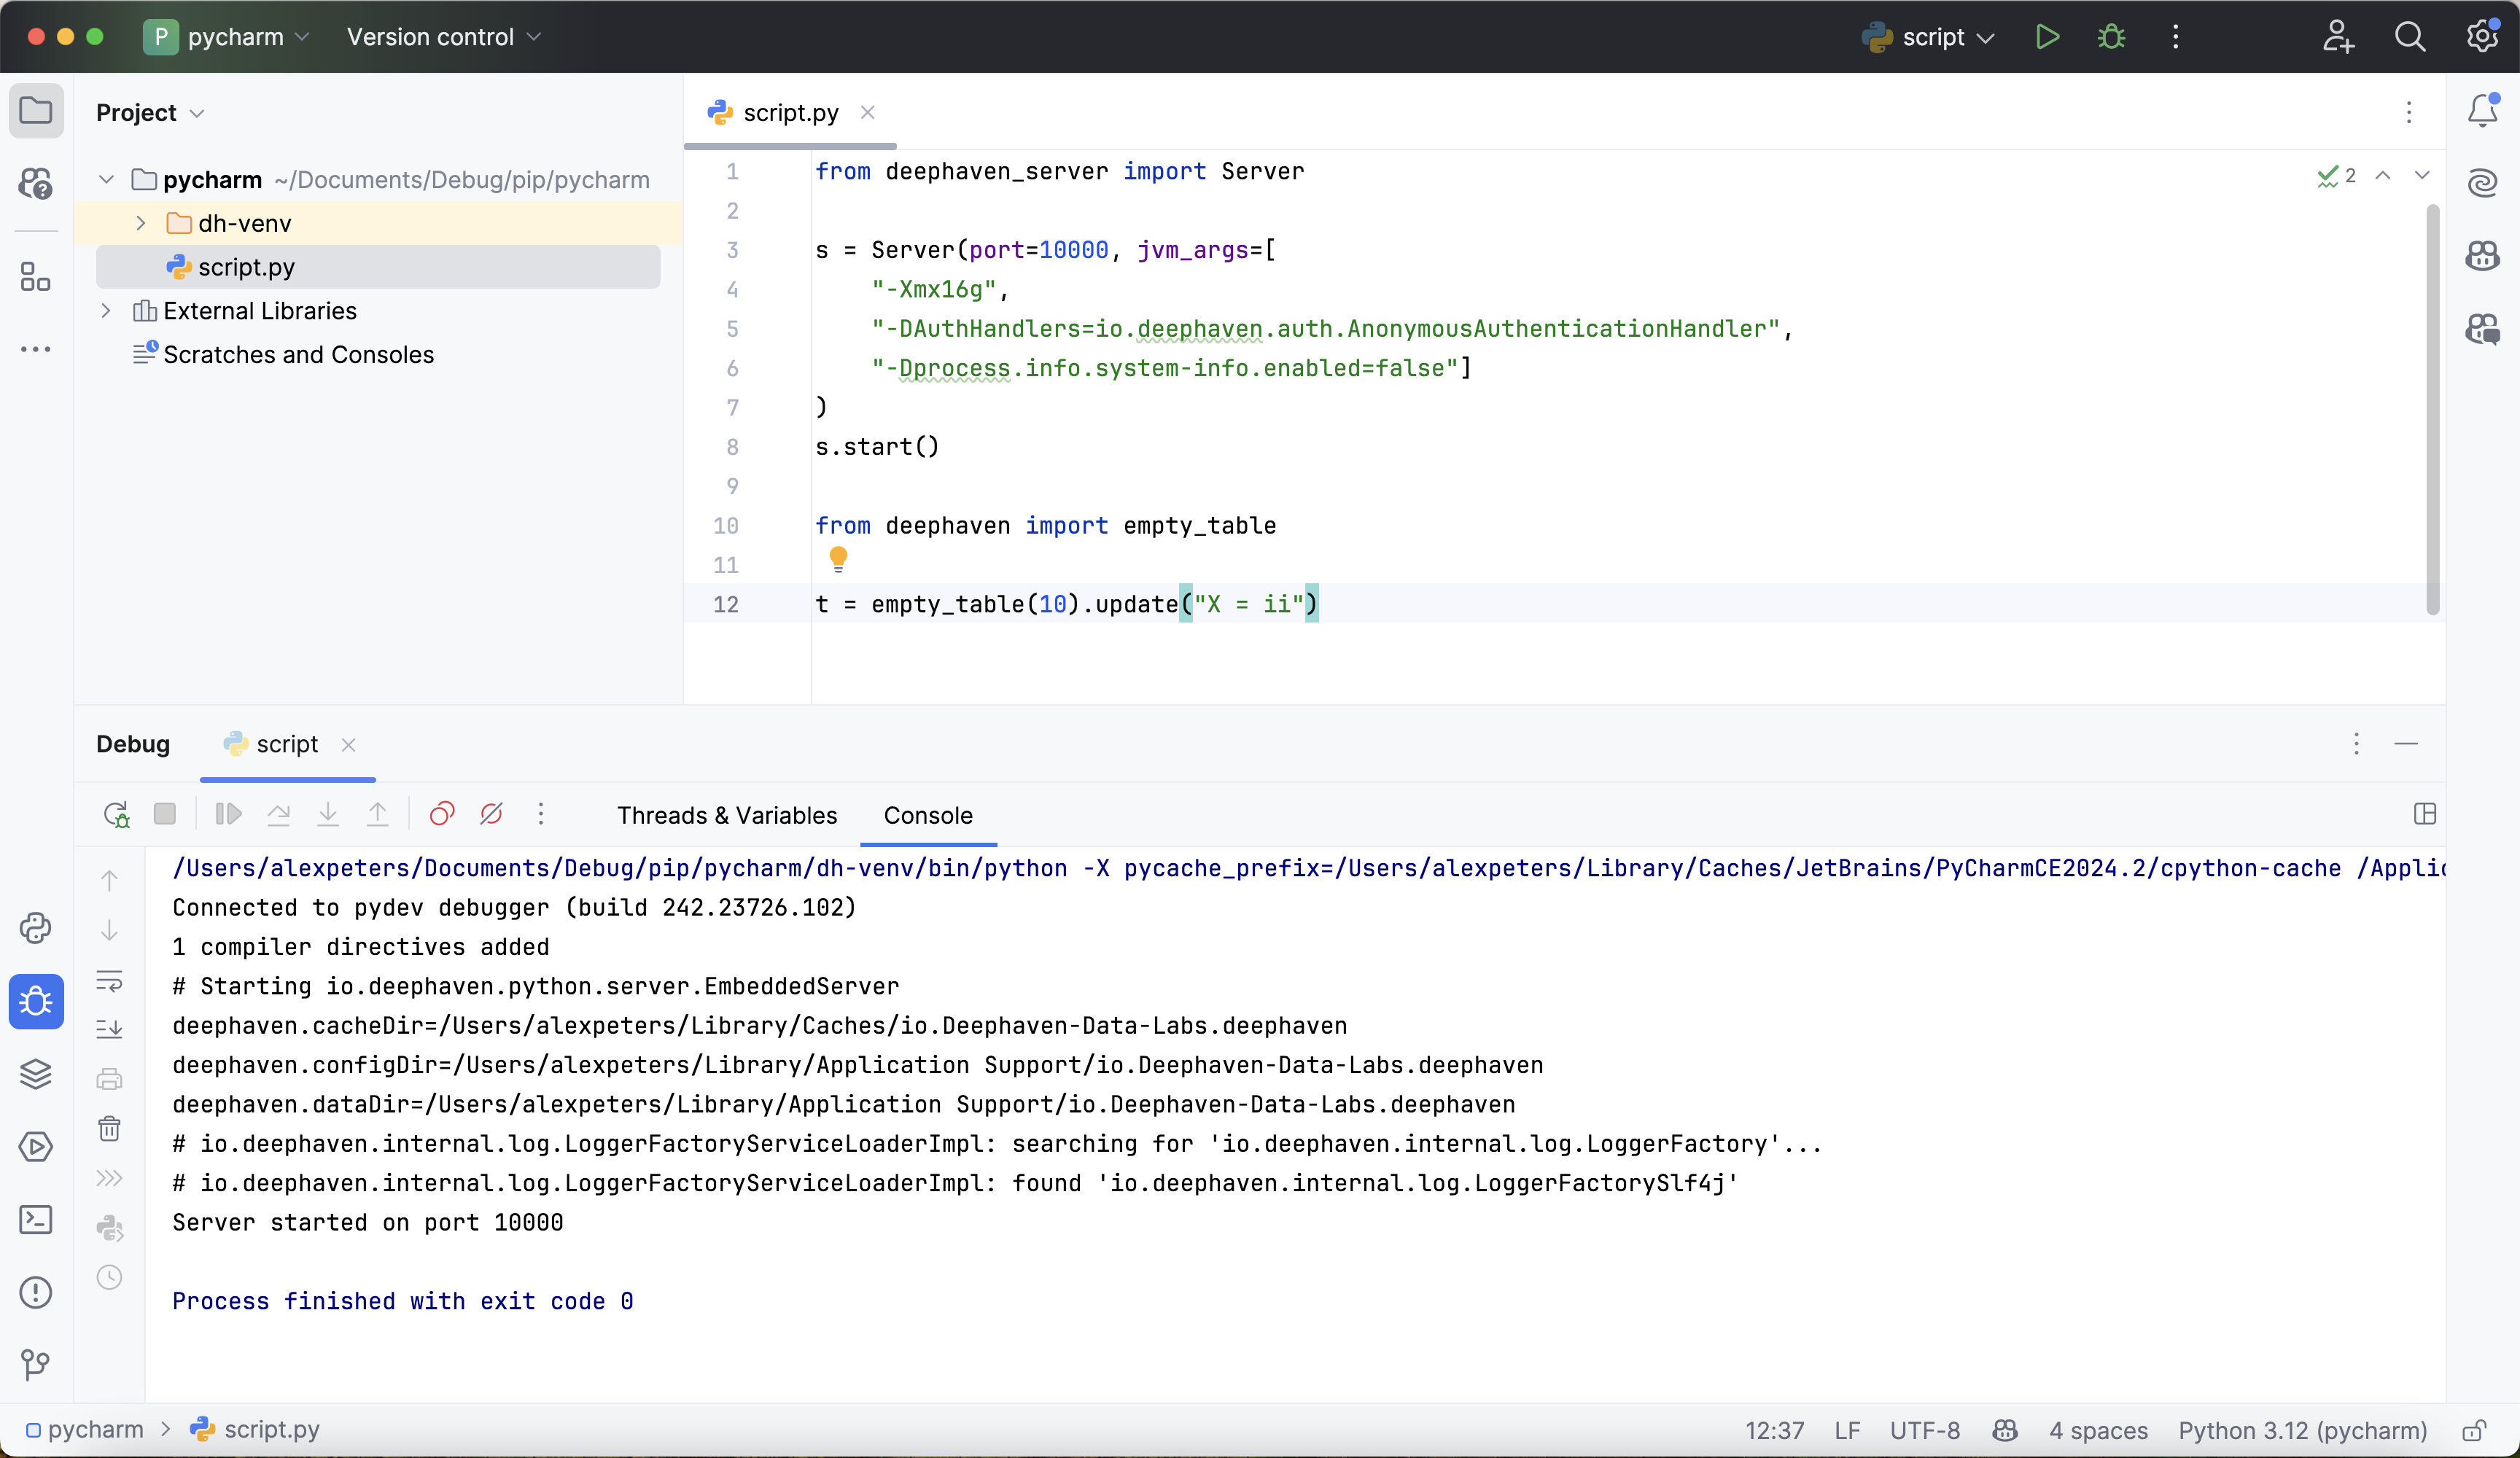
This will start the debugger and execute the test script in debug mode. If the test is successful, the debug console will contain output like this:
If the test fails, the Python interpreter may not be configured correctly, or the Deephaven Python package may not be available in the current environment. Follow the previous steps closely to ensure a correctly-configured environment.
3. Use debugger with Deephaven
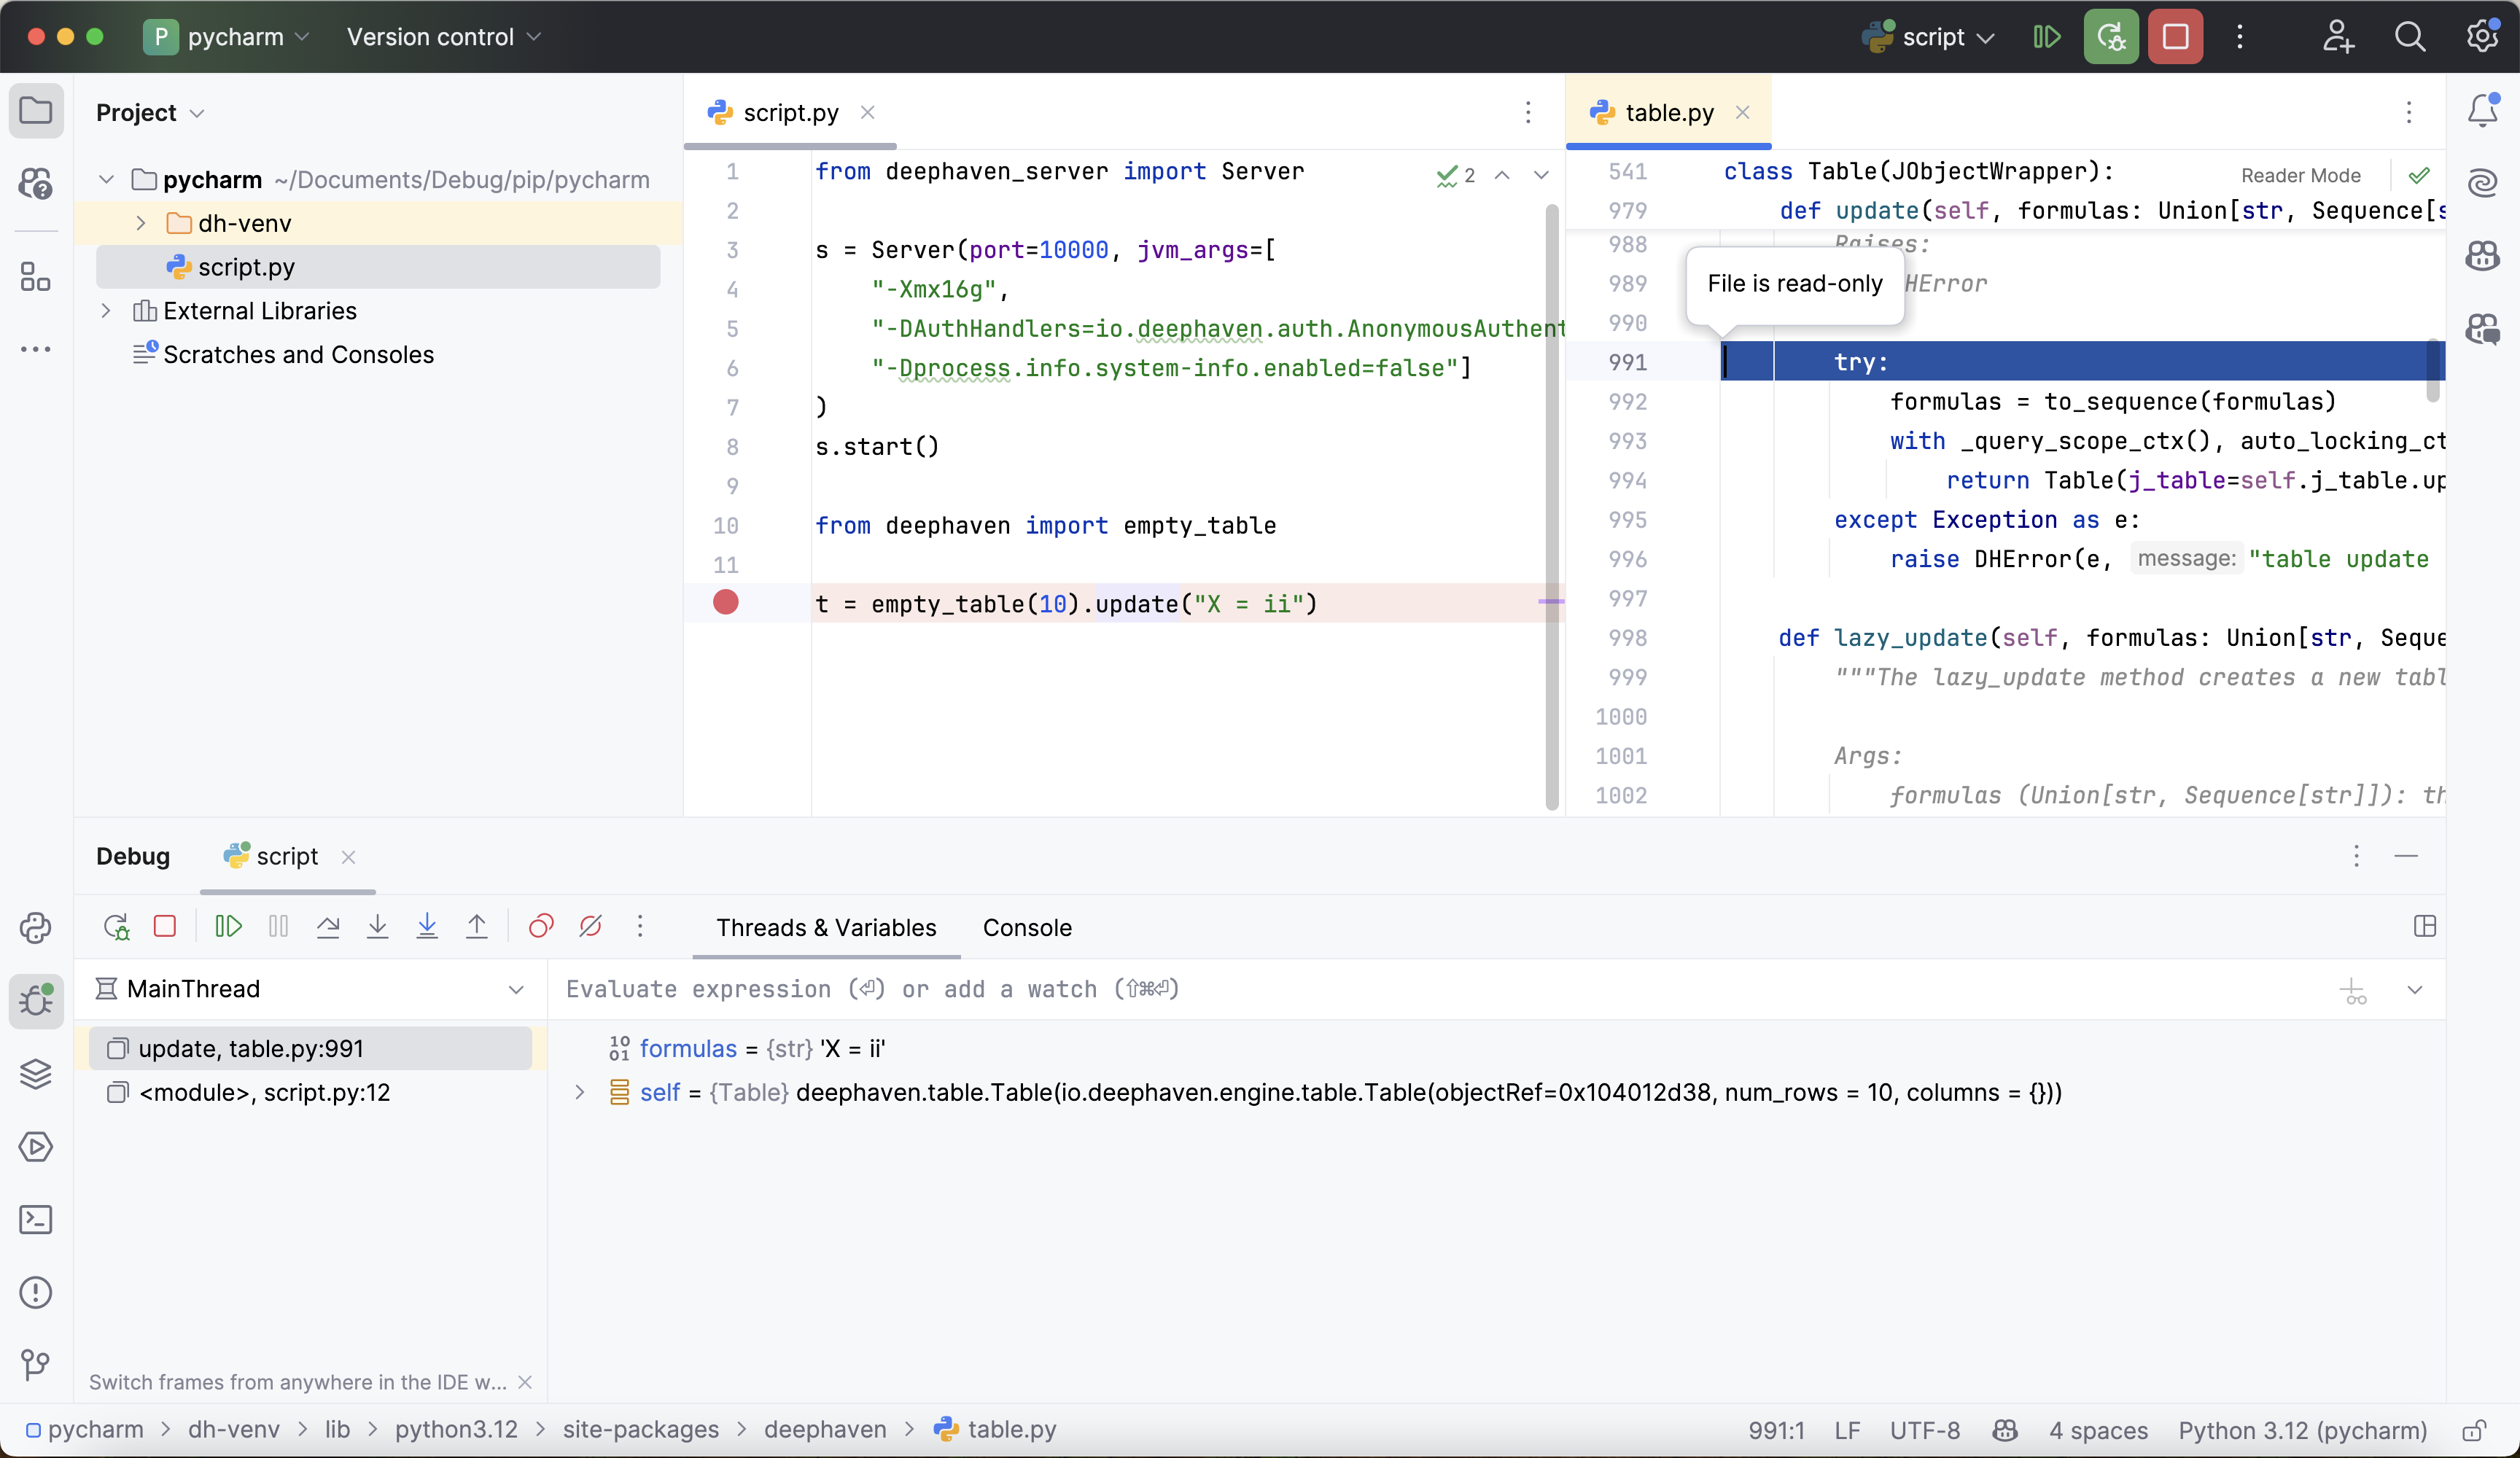
Once the debugger is set up and working, all of the features in PyCharm's debugger will be available. Set breakpoints, step through functions, and inspect source code:
There are some Deephaven-specific things that must be taken into consideration. See the guide on common problems when debugging for information on some subtle problems that can creep into debugging sessions.
VS Code
Warning
Debugging Deephaven with VS Code has only been verified to work on VS Code 1.94 and higher. Older versions may have compatibility issues.
VS Code's built-in debugger is useful for debugging Deephaven scripts hosted in VS Code's environment. If there is an existing VS Code project set up to work with the dh-venv virtual environment, skip to step 2.
1. Create and configure VS Code project
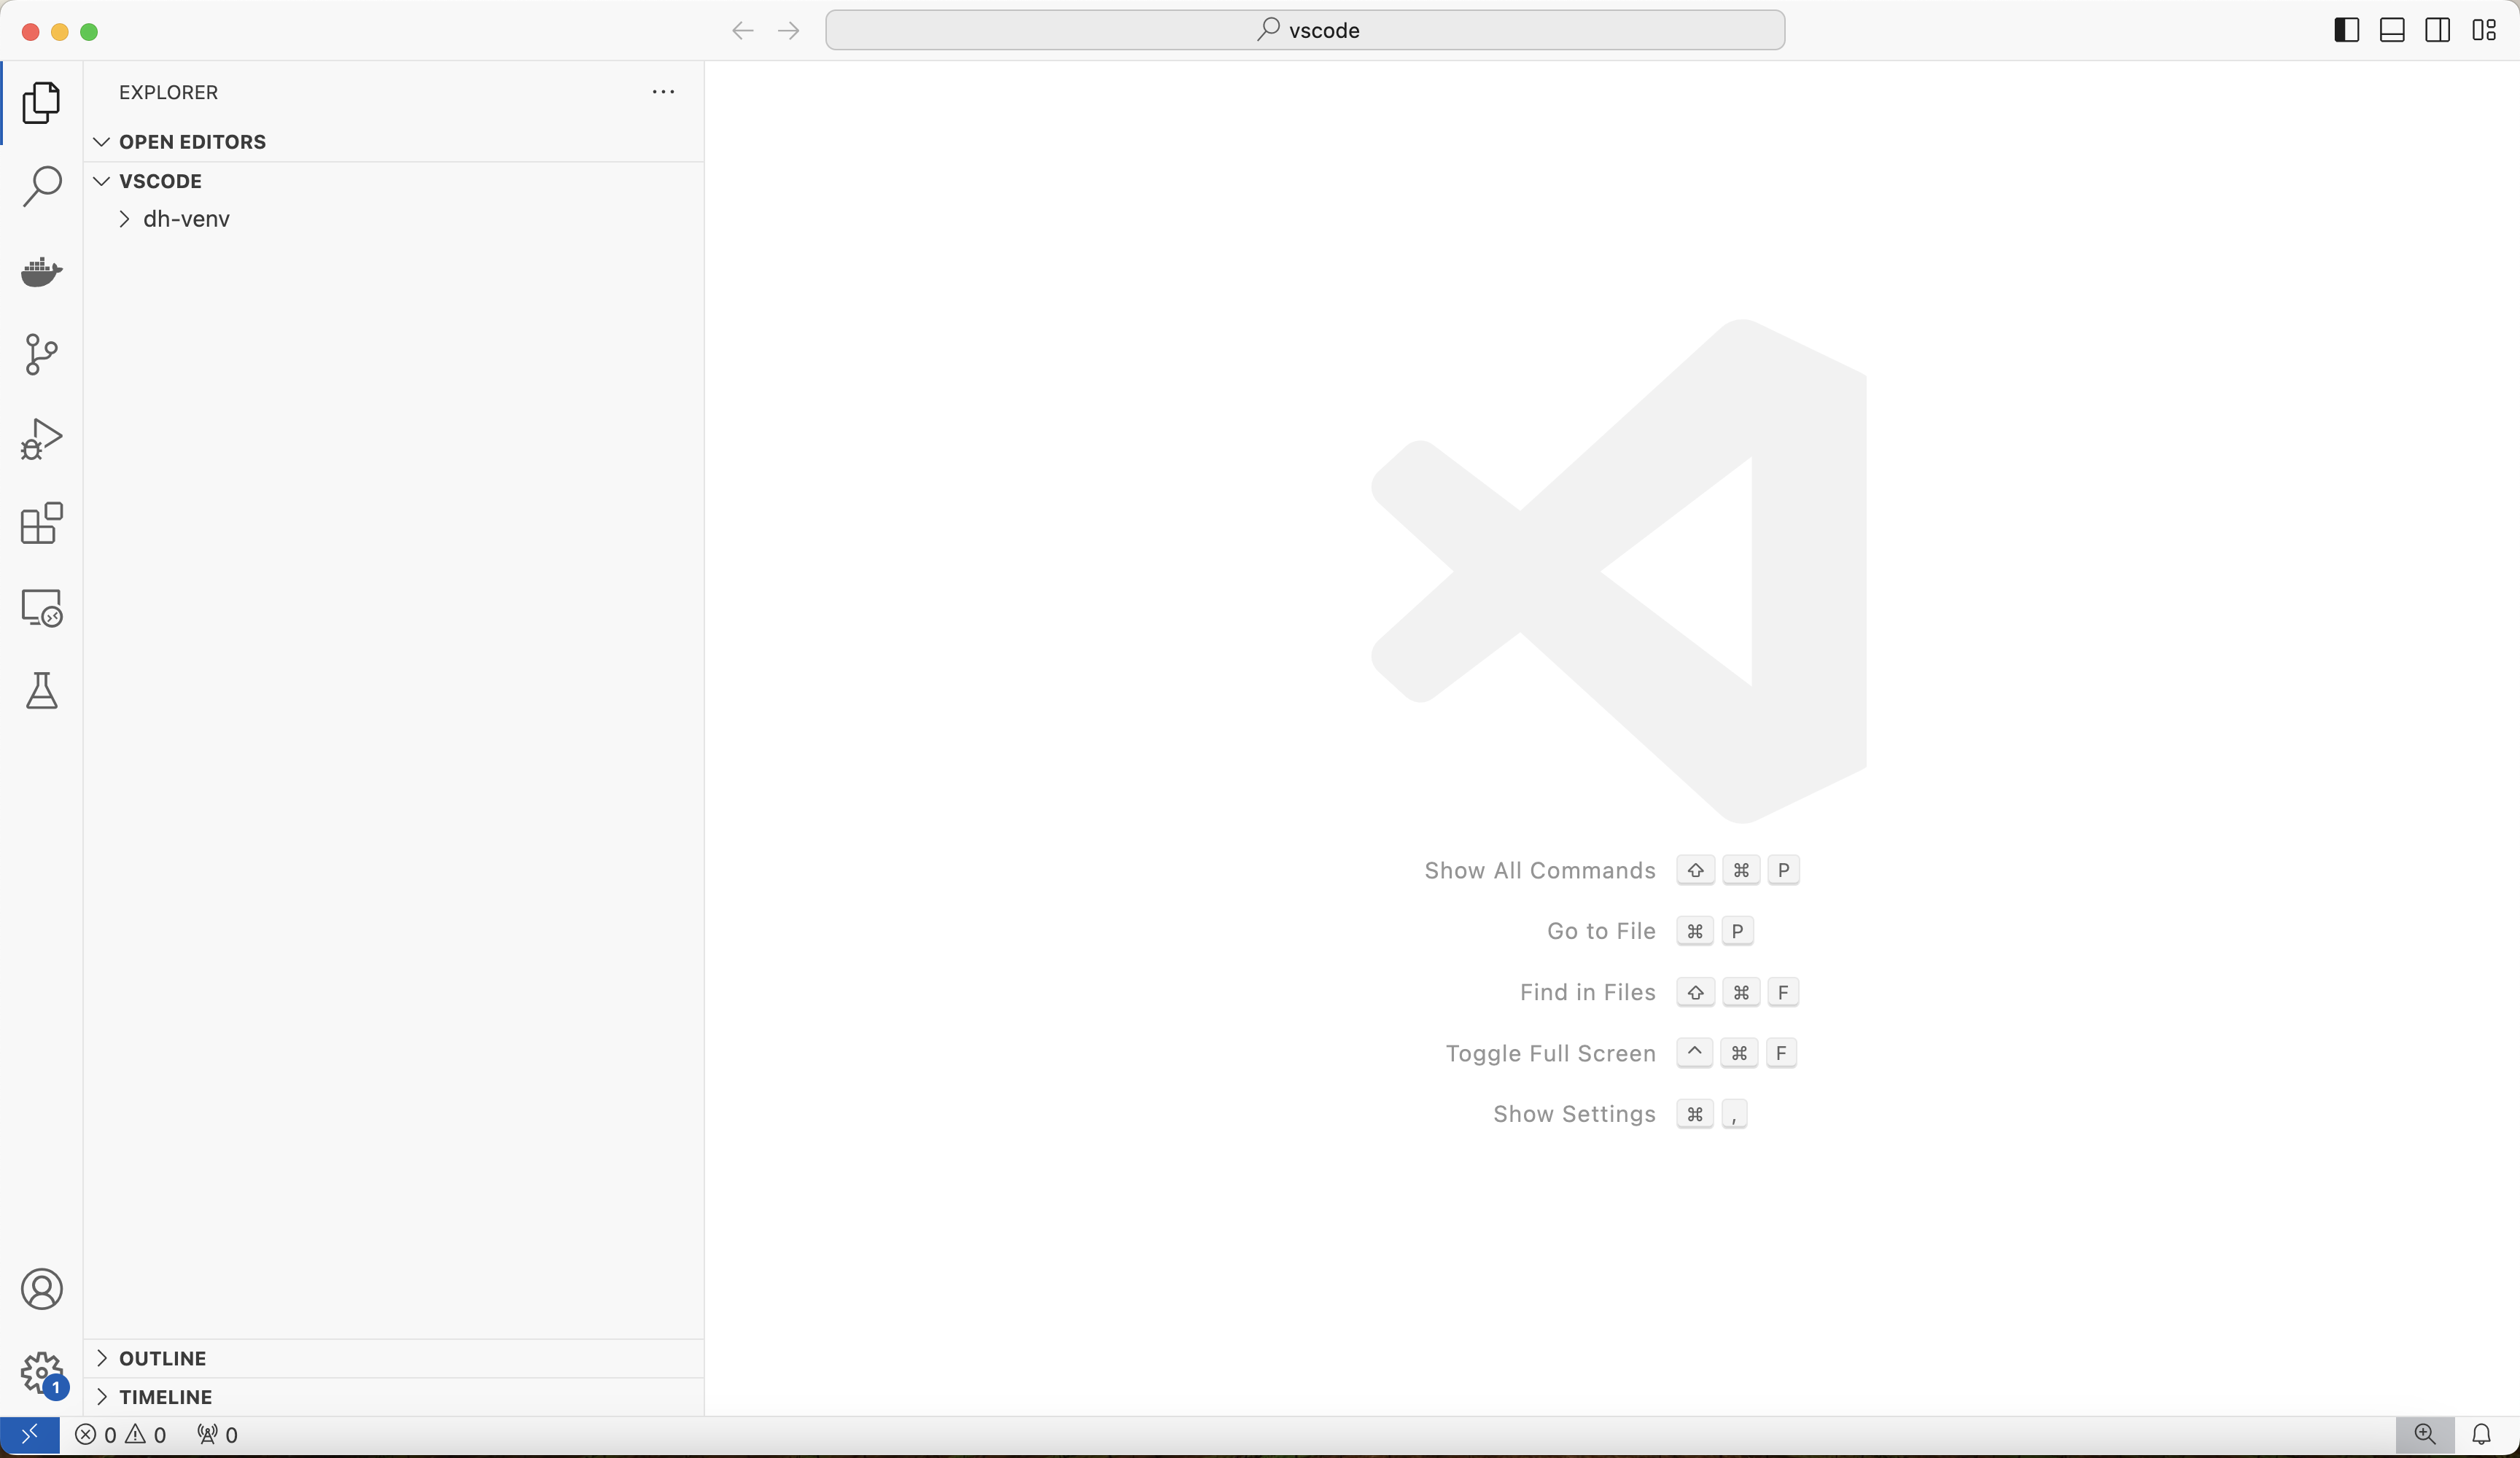
First, create a new VS Code project by opening the parent directory of dh-venv in the VS Code launch window. This creates a brand new VS Code project:
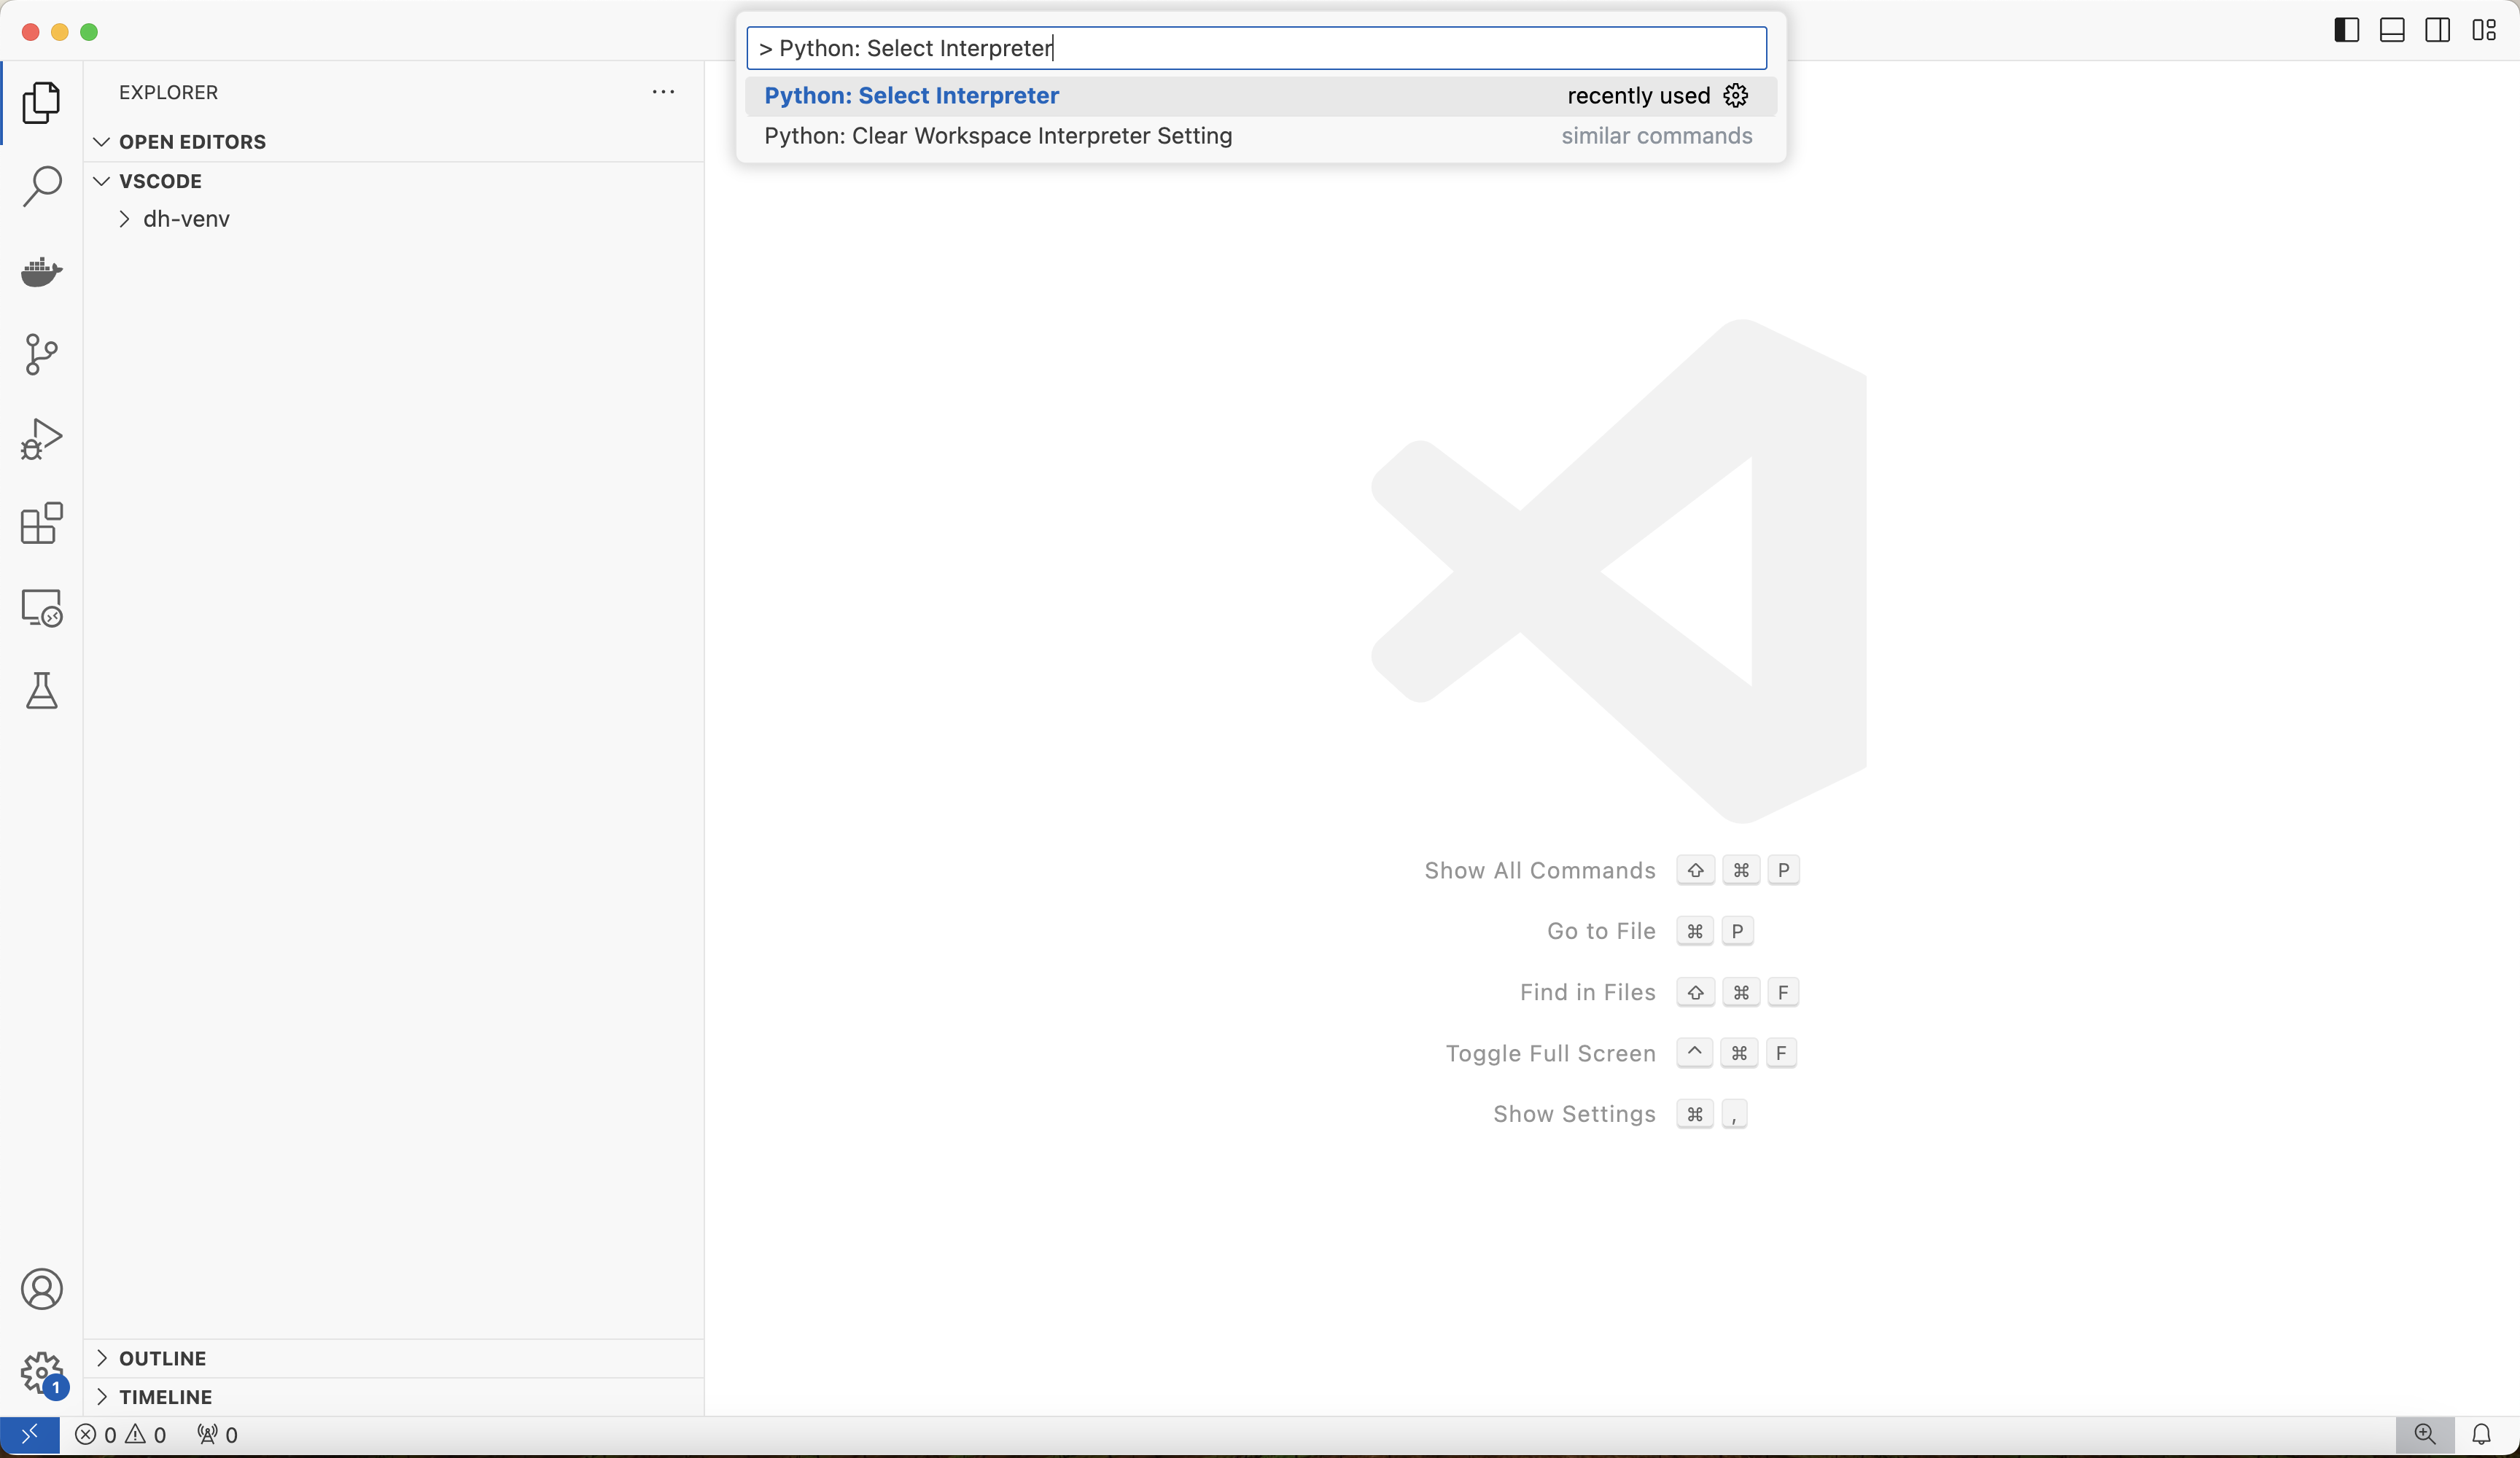
Then, configure the interpreter by typing > Python: Select Interpreter into the search bar at the top:
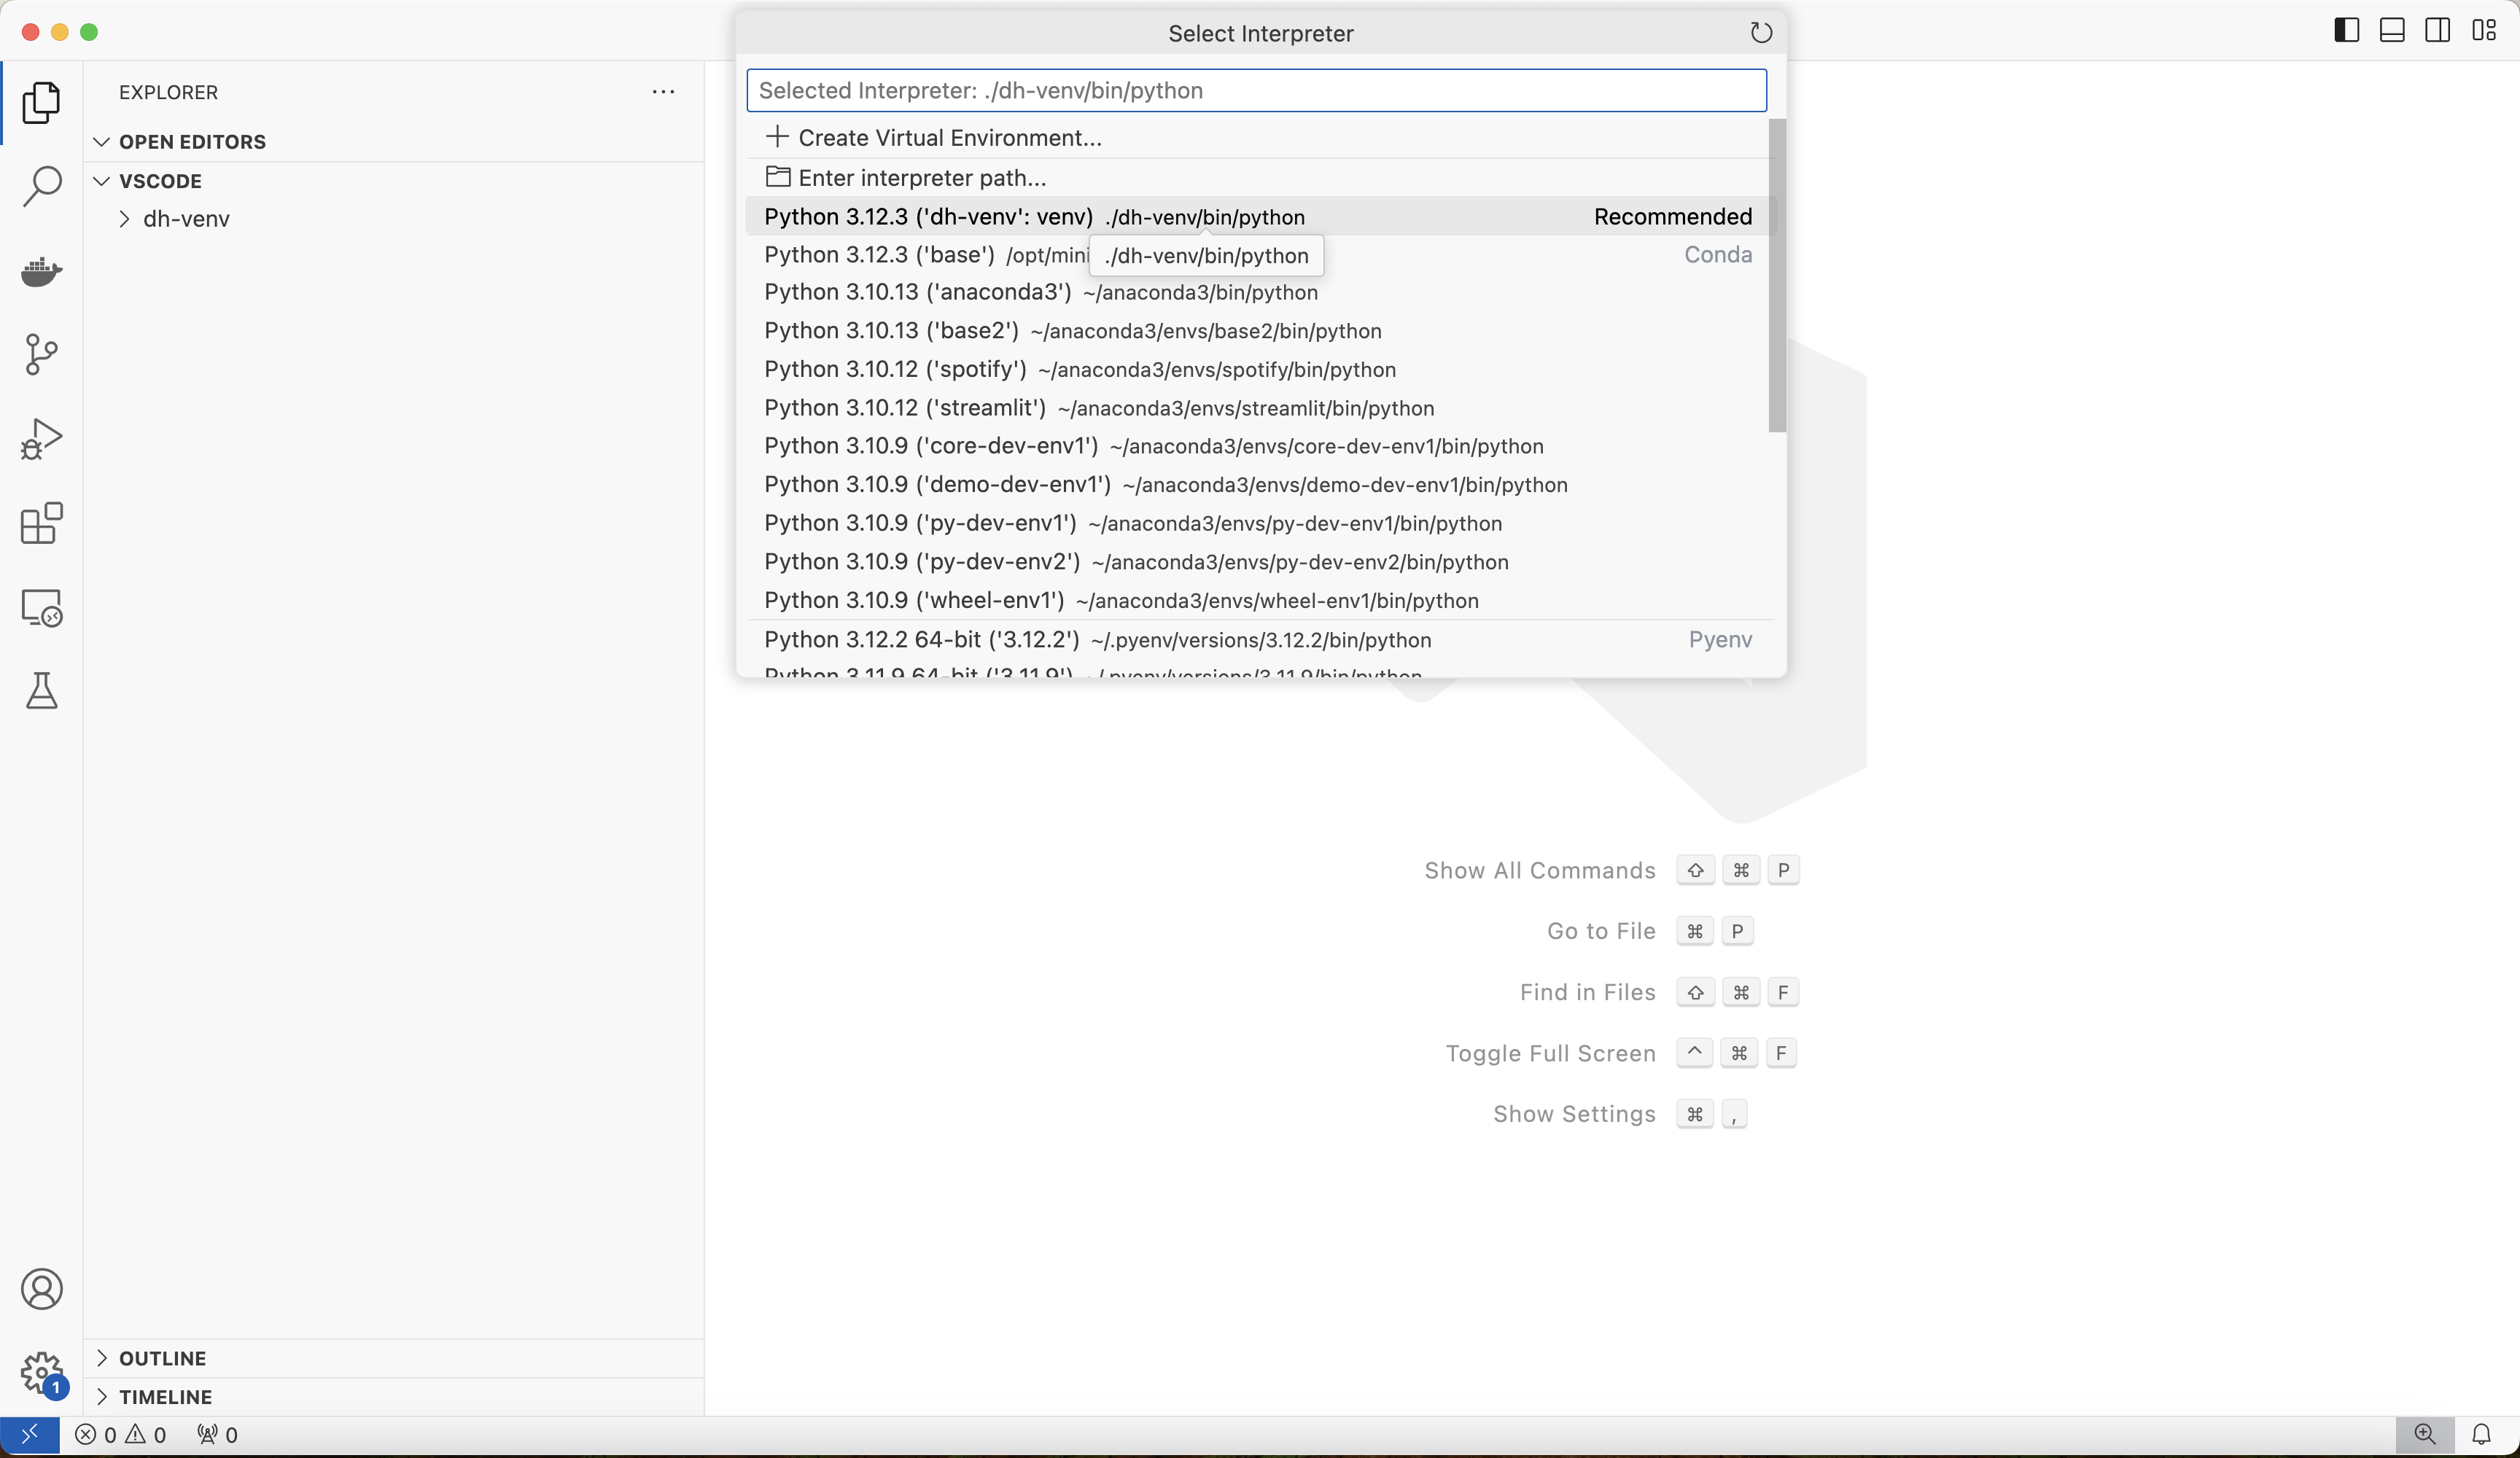
Select the dh-venv environment that was created earlier. VS Code may recommend that environment by default since it's present in the project directory:
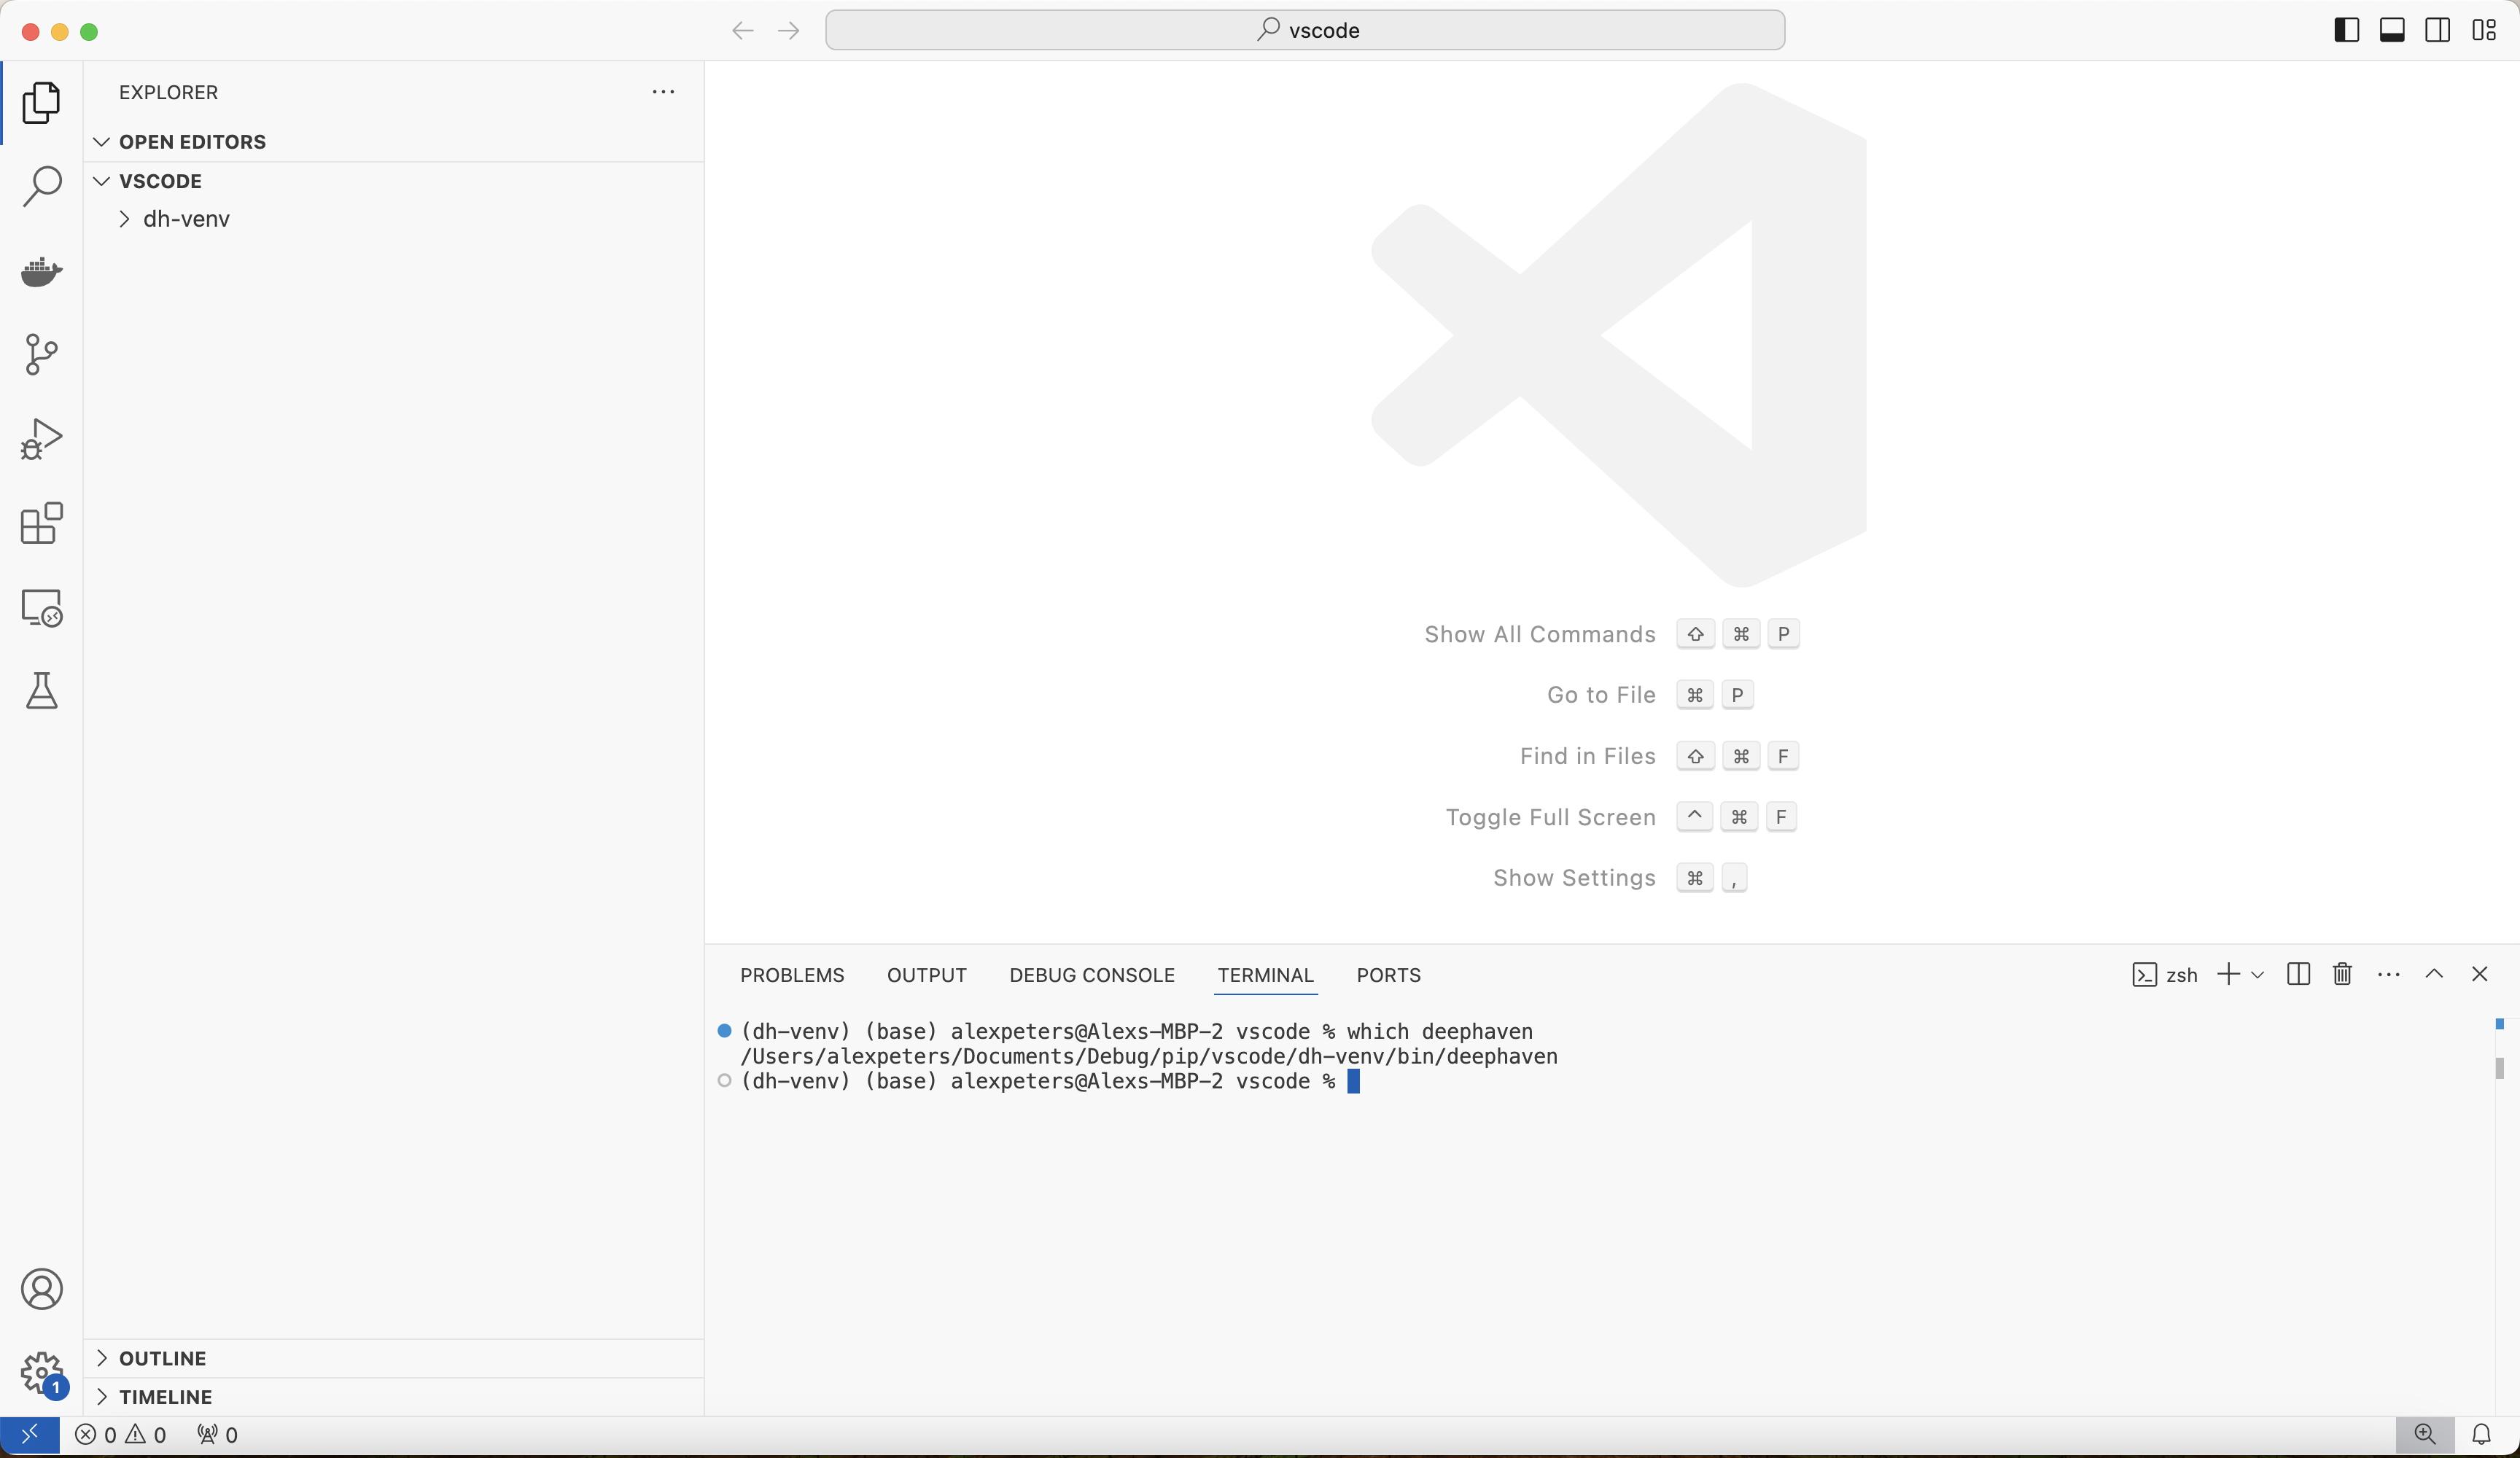
Verify that the interpreter is configured correctly by opening a terminal and running which deephaven. It should point to the VS Code project directory:
2. Test debugger
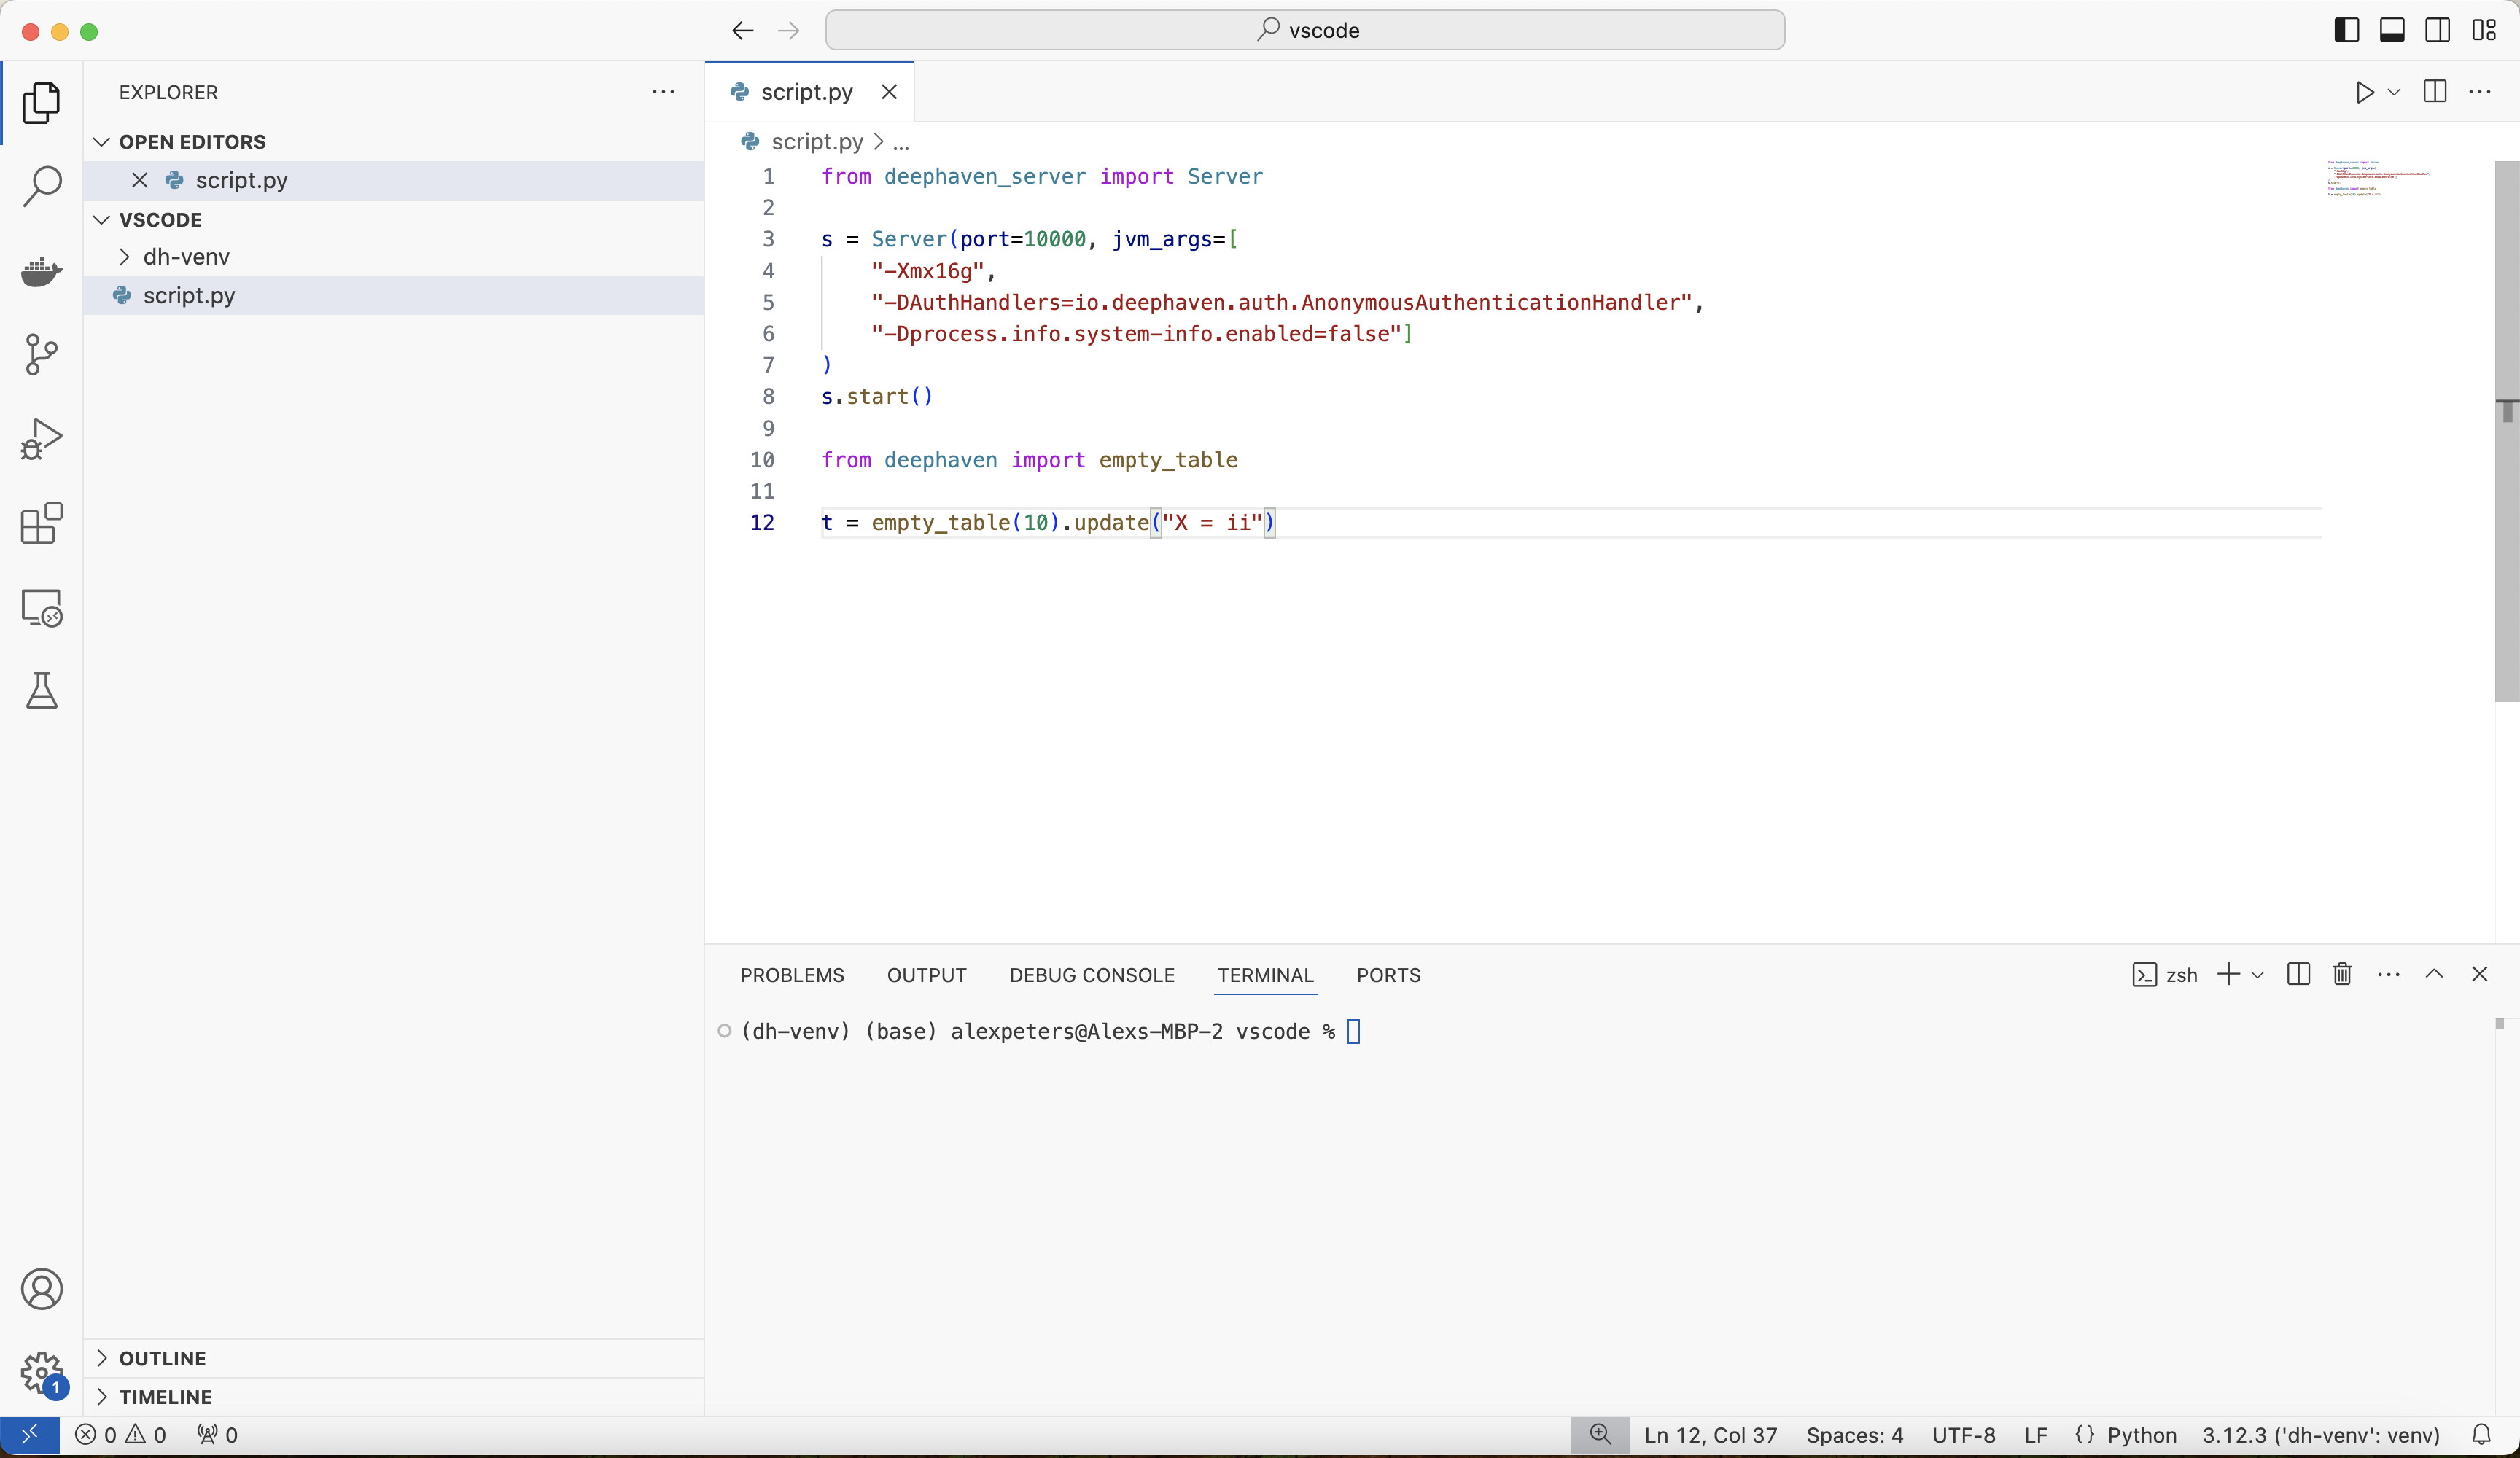
To ensure that the debugger is configured correctly, create and run a script to start the Deephaven server and run a command. This example is called script.py:
Expand for test script
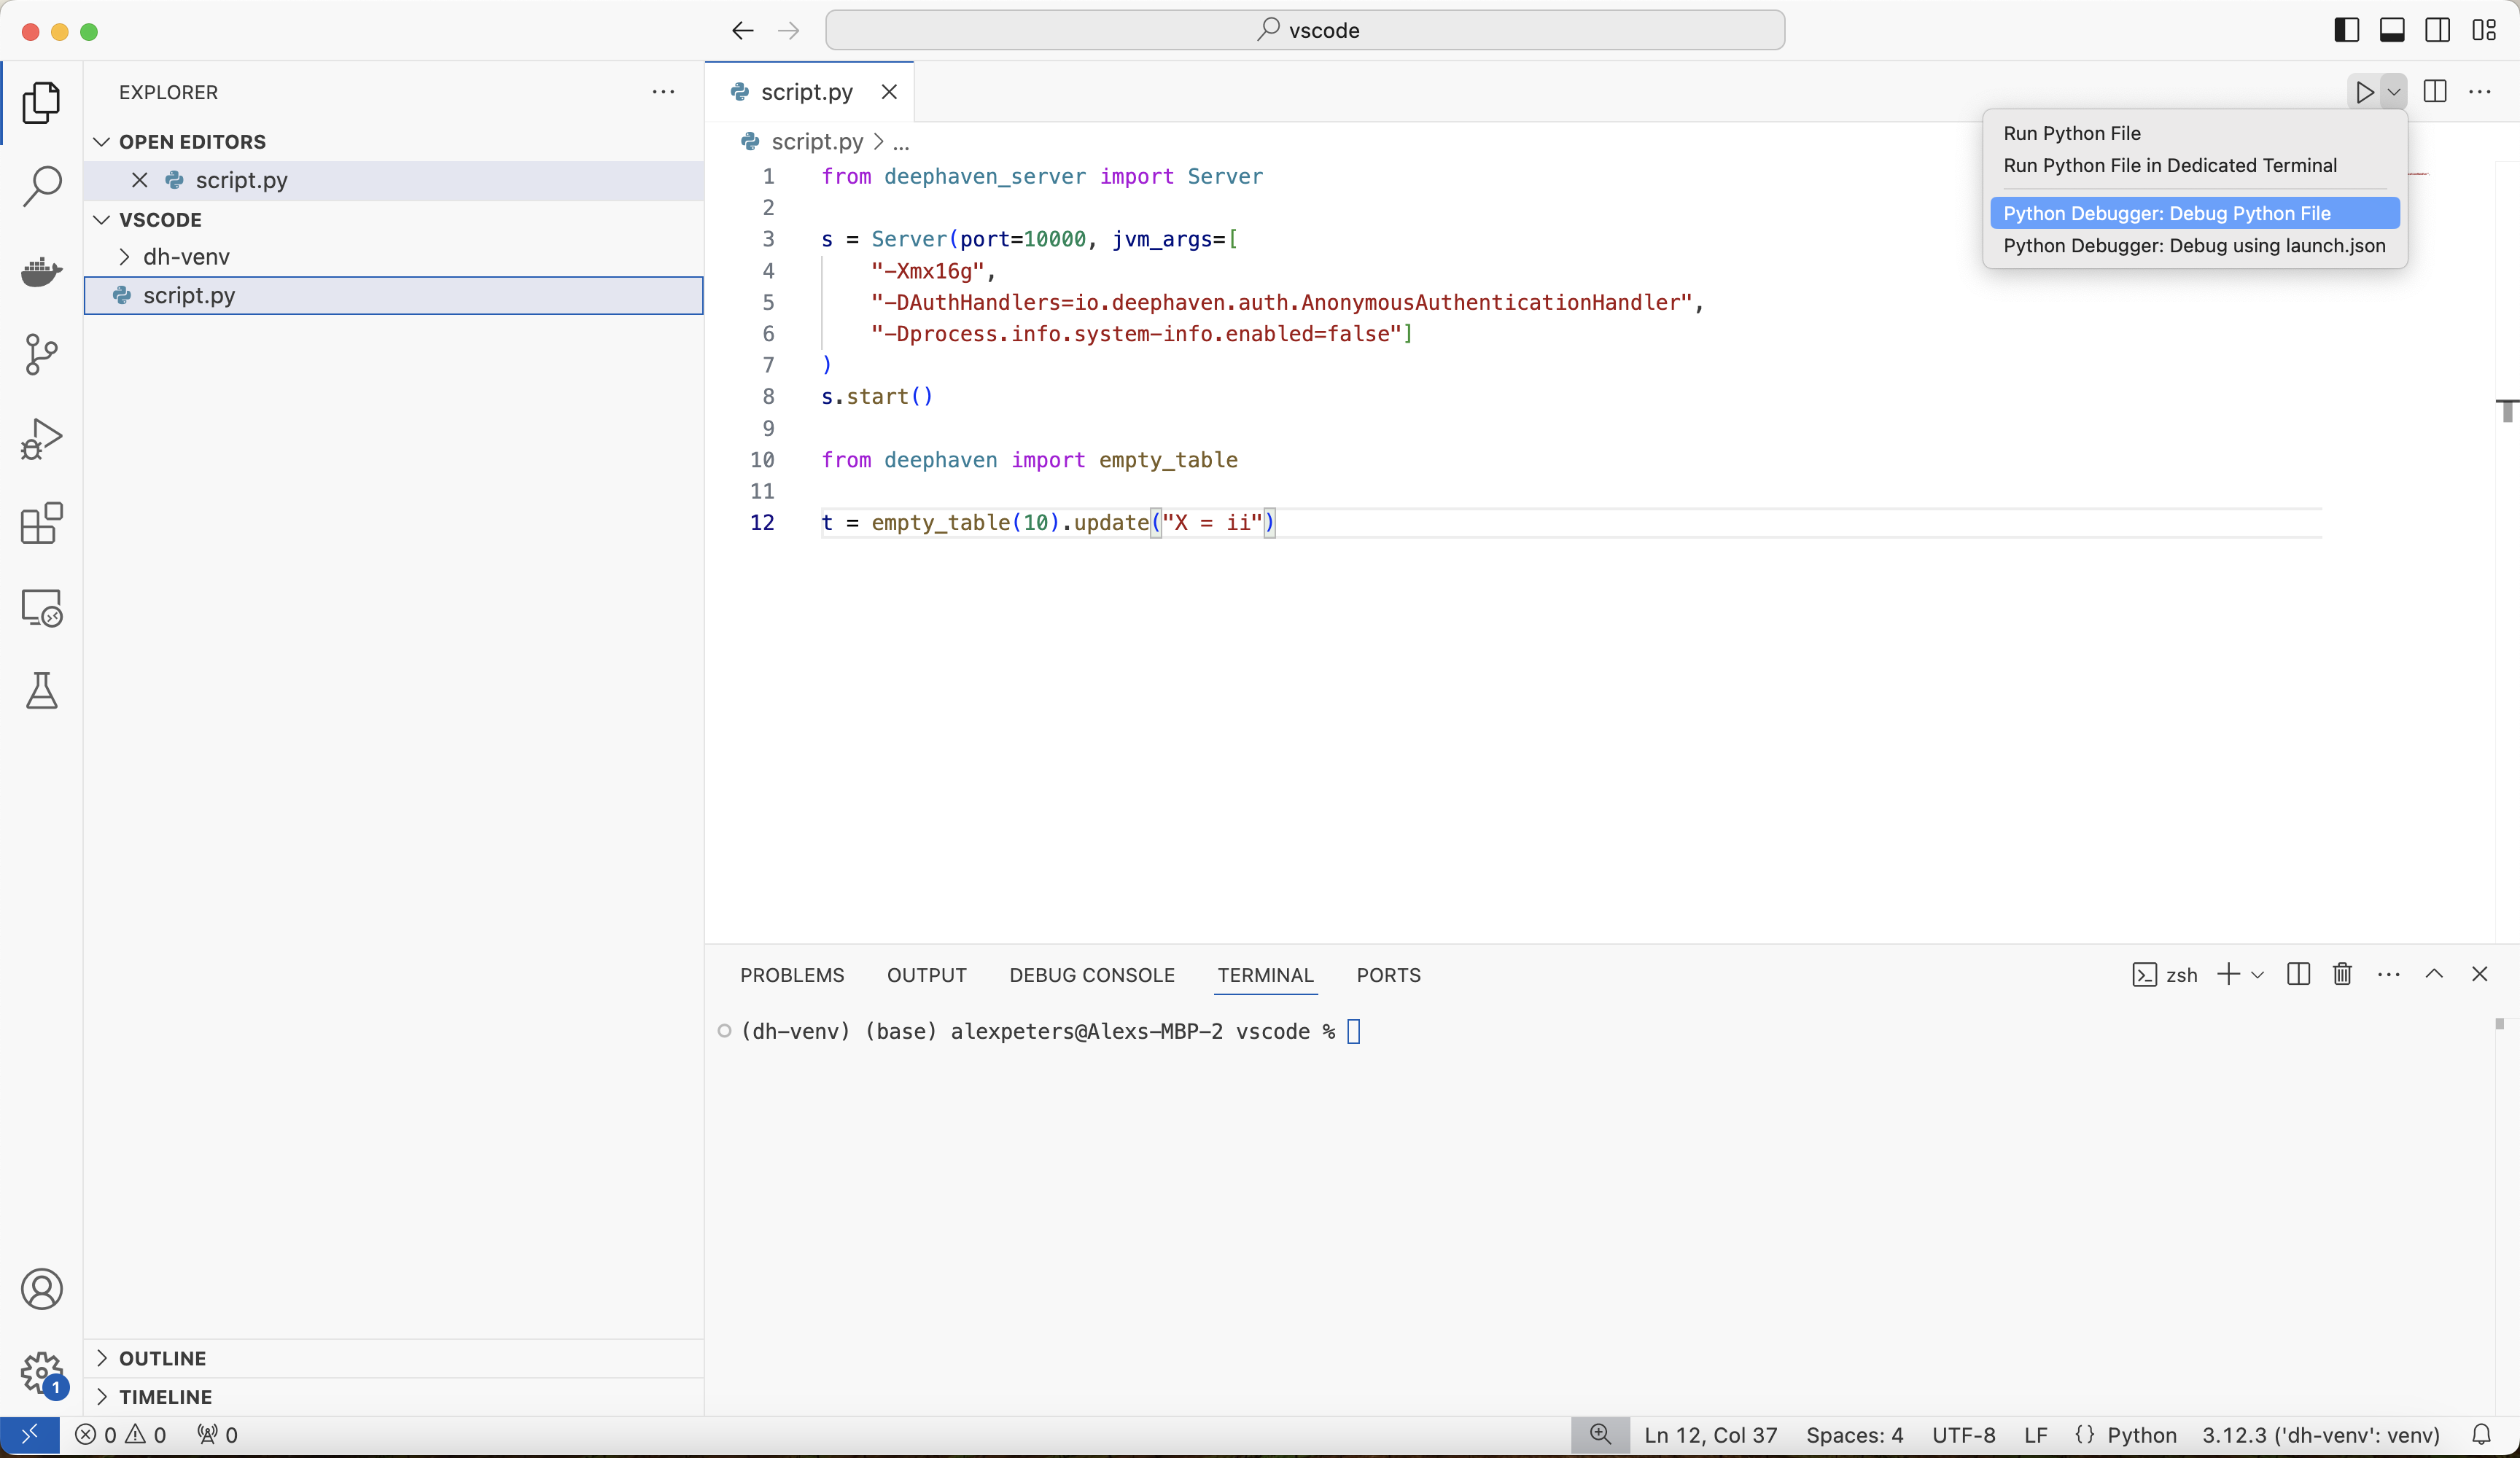
Click on the small downward-facing arrow toward the top-right corner of the screen and select Python Debugger: Debug Python File:
This will execute the test script in the debugger for this environment. If the test is successful, it will start the Deephaven server, execute the script, and exit the debugger:
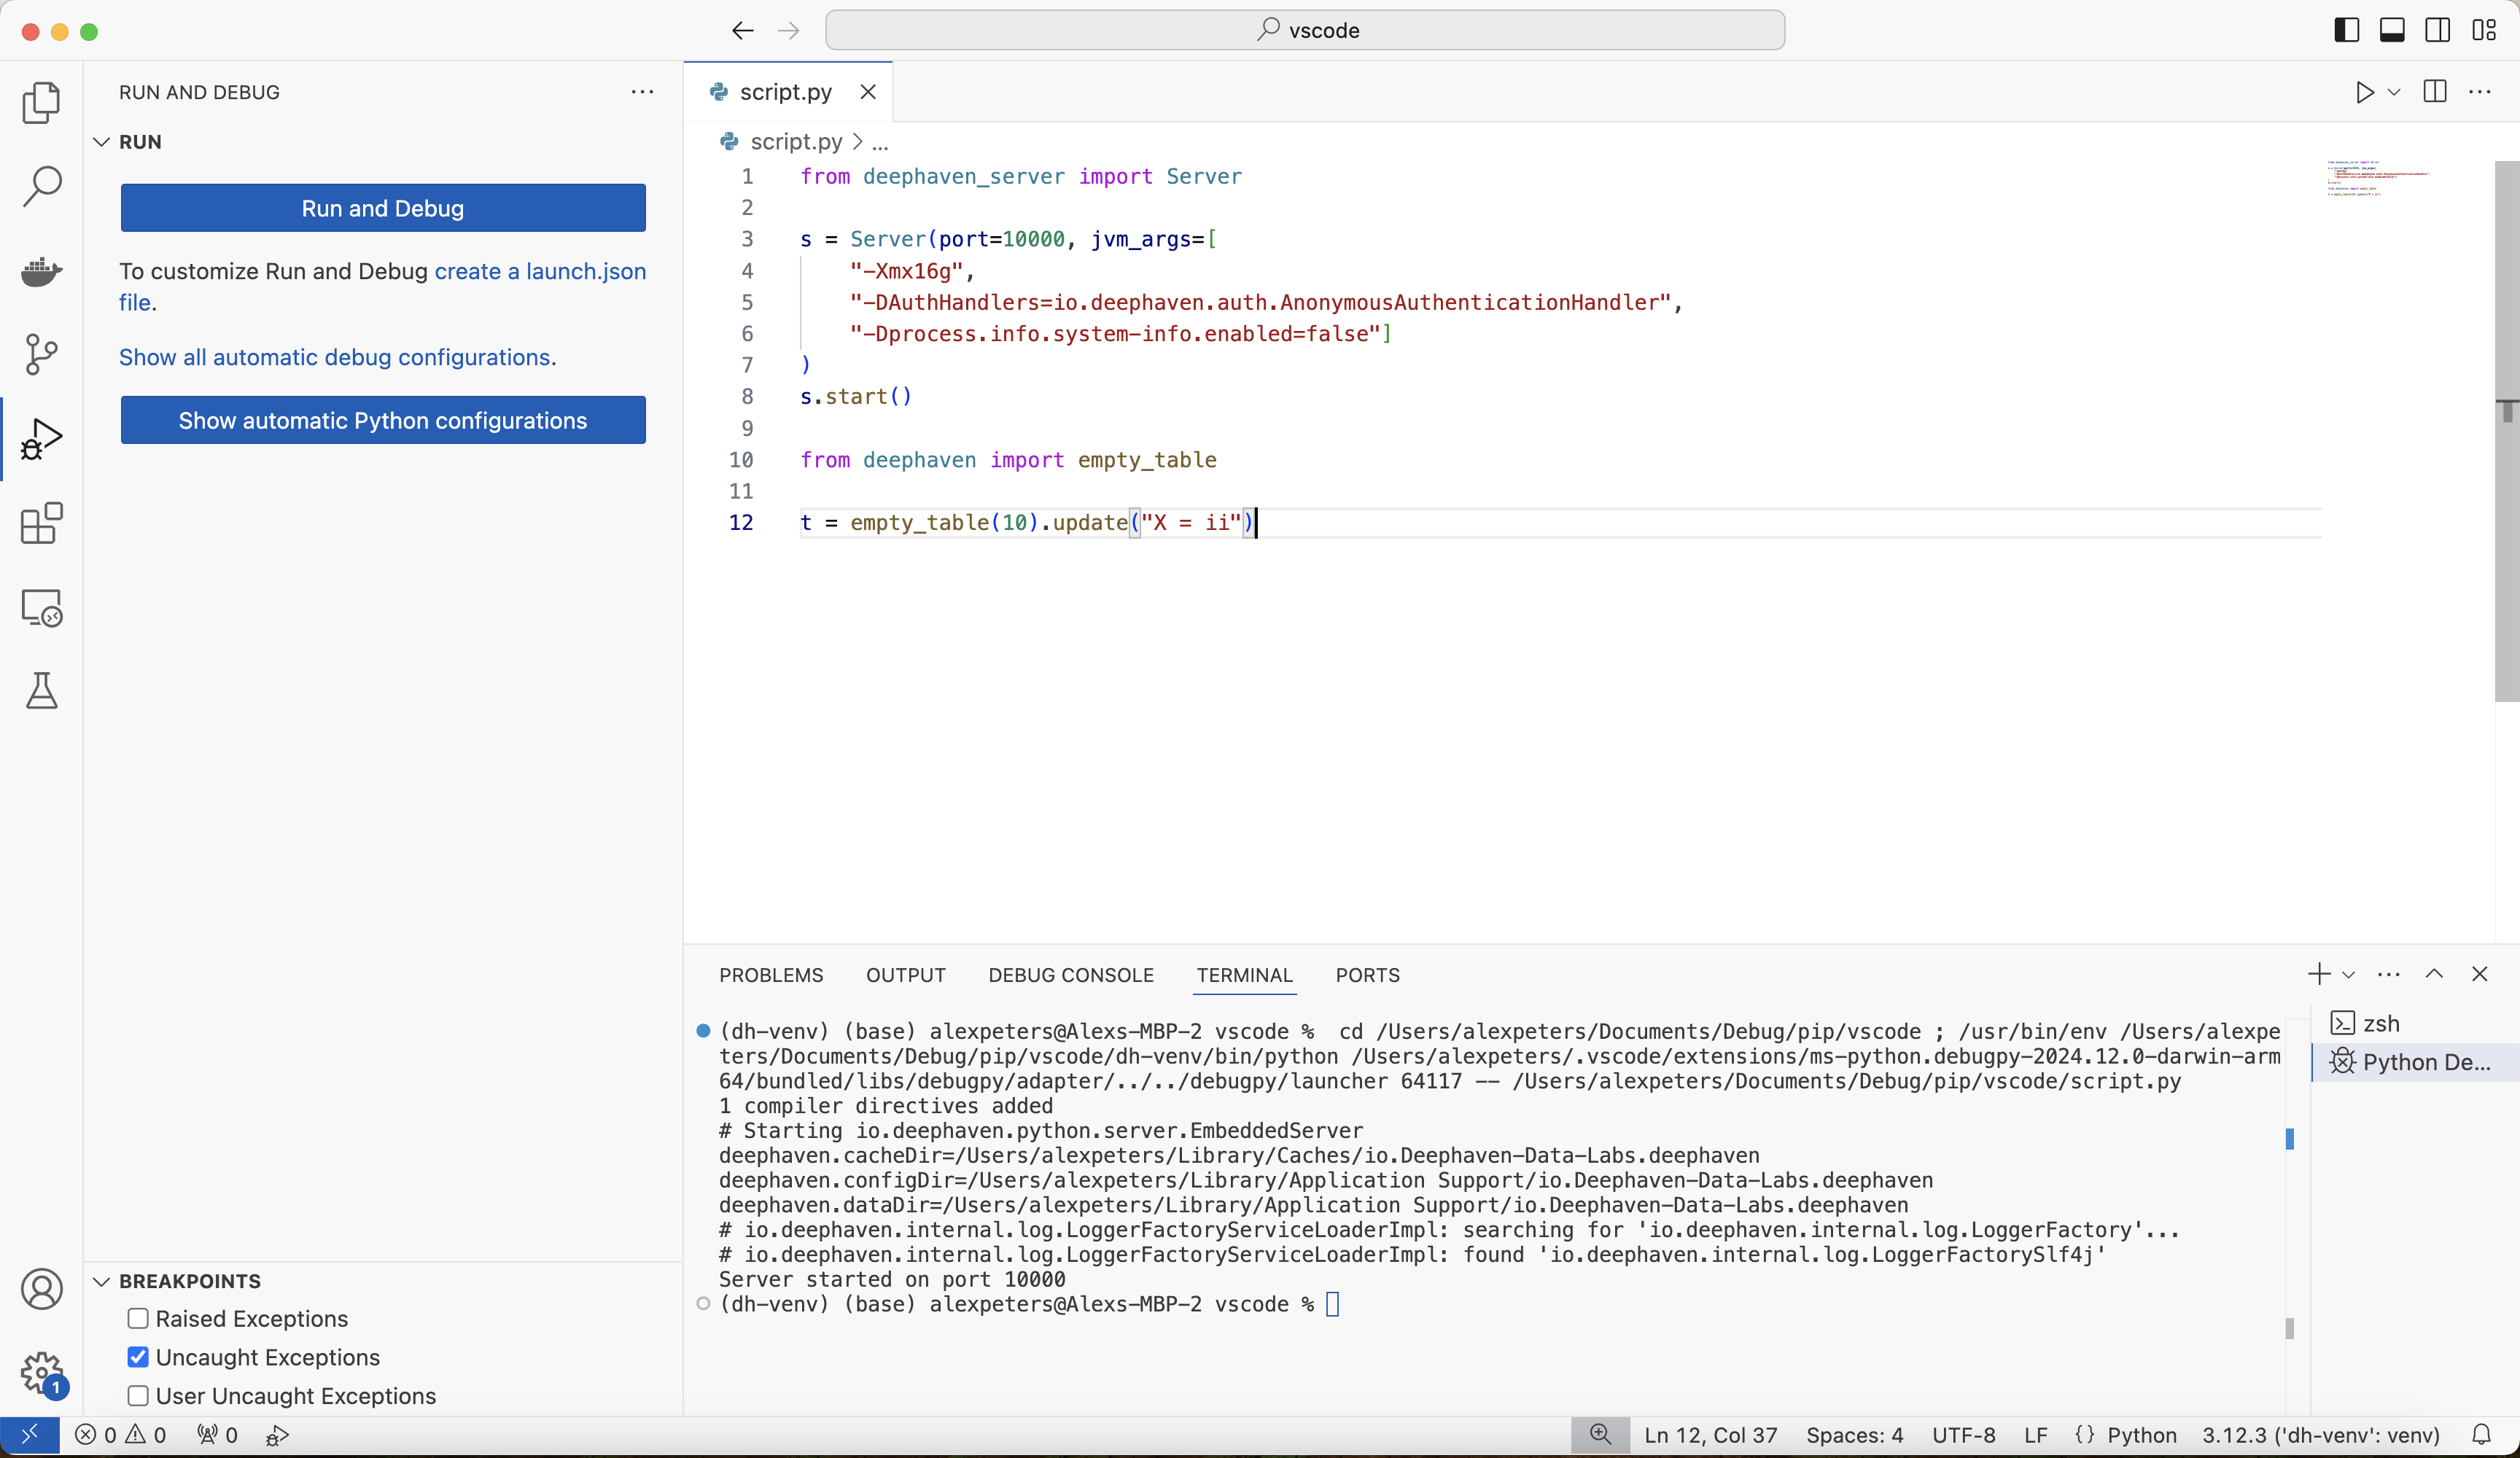
In this case, the debugger is ready for use. If the test fails, ensure that the environment is configured correctly by carefully following the setup in step 1.
3. Use debugger with Deephaven
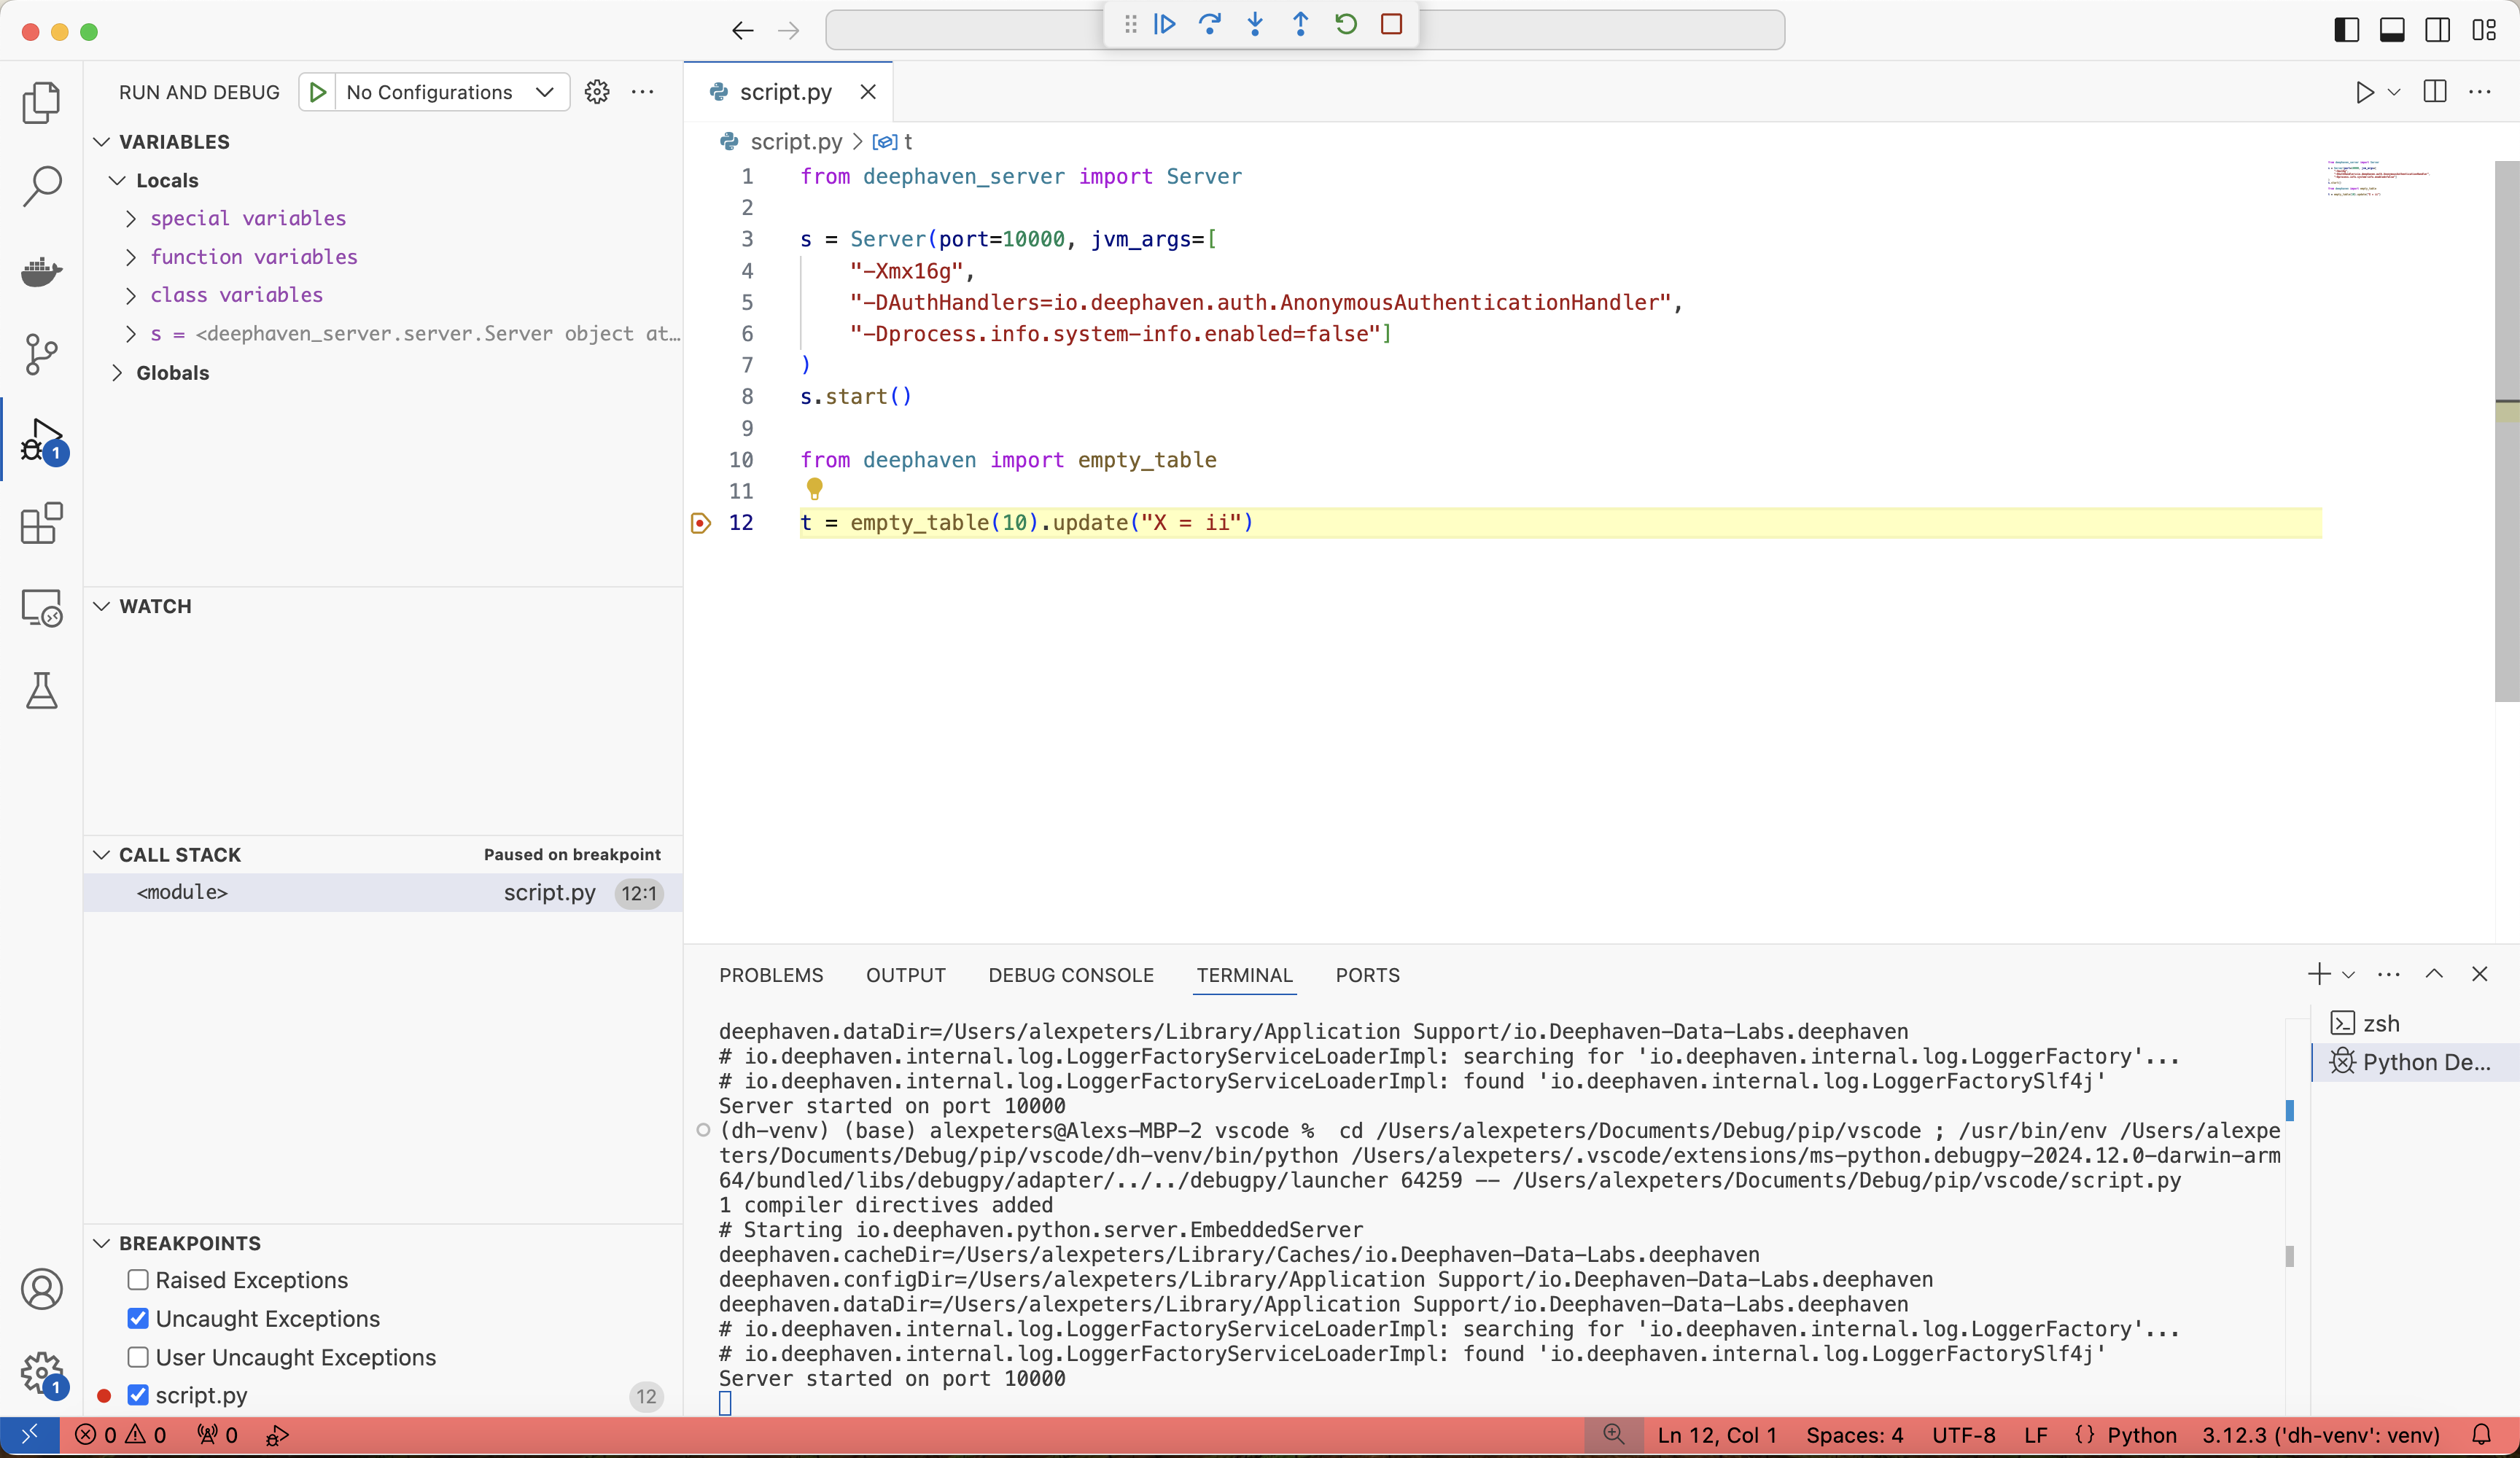
Once the debugger is set up and working, all of the features in VS Code's debugger will be available. Set breakpoints, step through functions, and inspect source code:
There are some Deephaven-specific things that must be taken into consideration. See the guide on common problems when debugging for information on some subtle problems that can creep into debugging sessions.
Remote debugging with Deephaven IDE (Advanced)
The Deephaven web IDE has no built-in debugger. However, you can use PyCharm Professional's remote debugging server to debug code executed in the Deephaven console. This approach is more complex than local debugging but useful when working primarily in the Deephaven web interface.
Note
PyCharm Professional is a paid product with remote debugging capabilities.
1. Install pydevd
First, install pydevd into the dh-venv virtual environment:
Verify that this package is installed and available by starting a Python console and importing the package:
This will display some output like this:
2. Create and configure PyCharm project
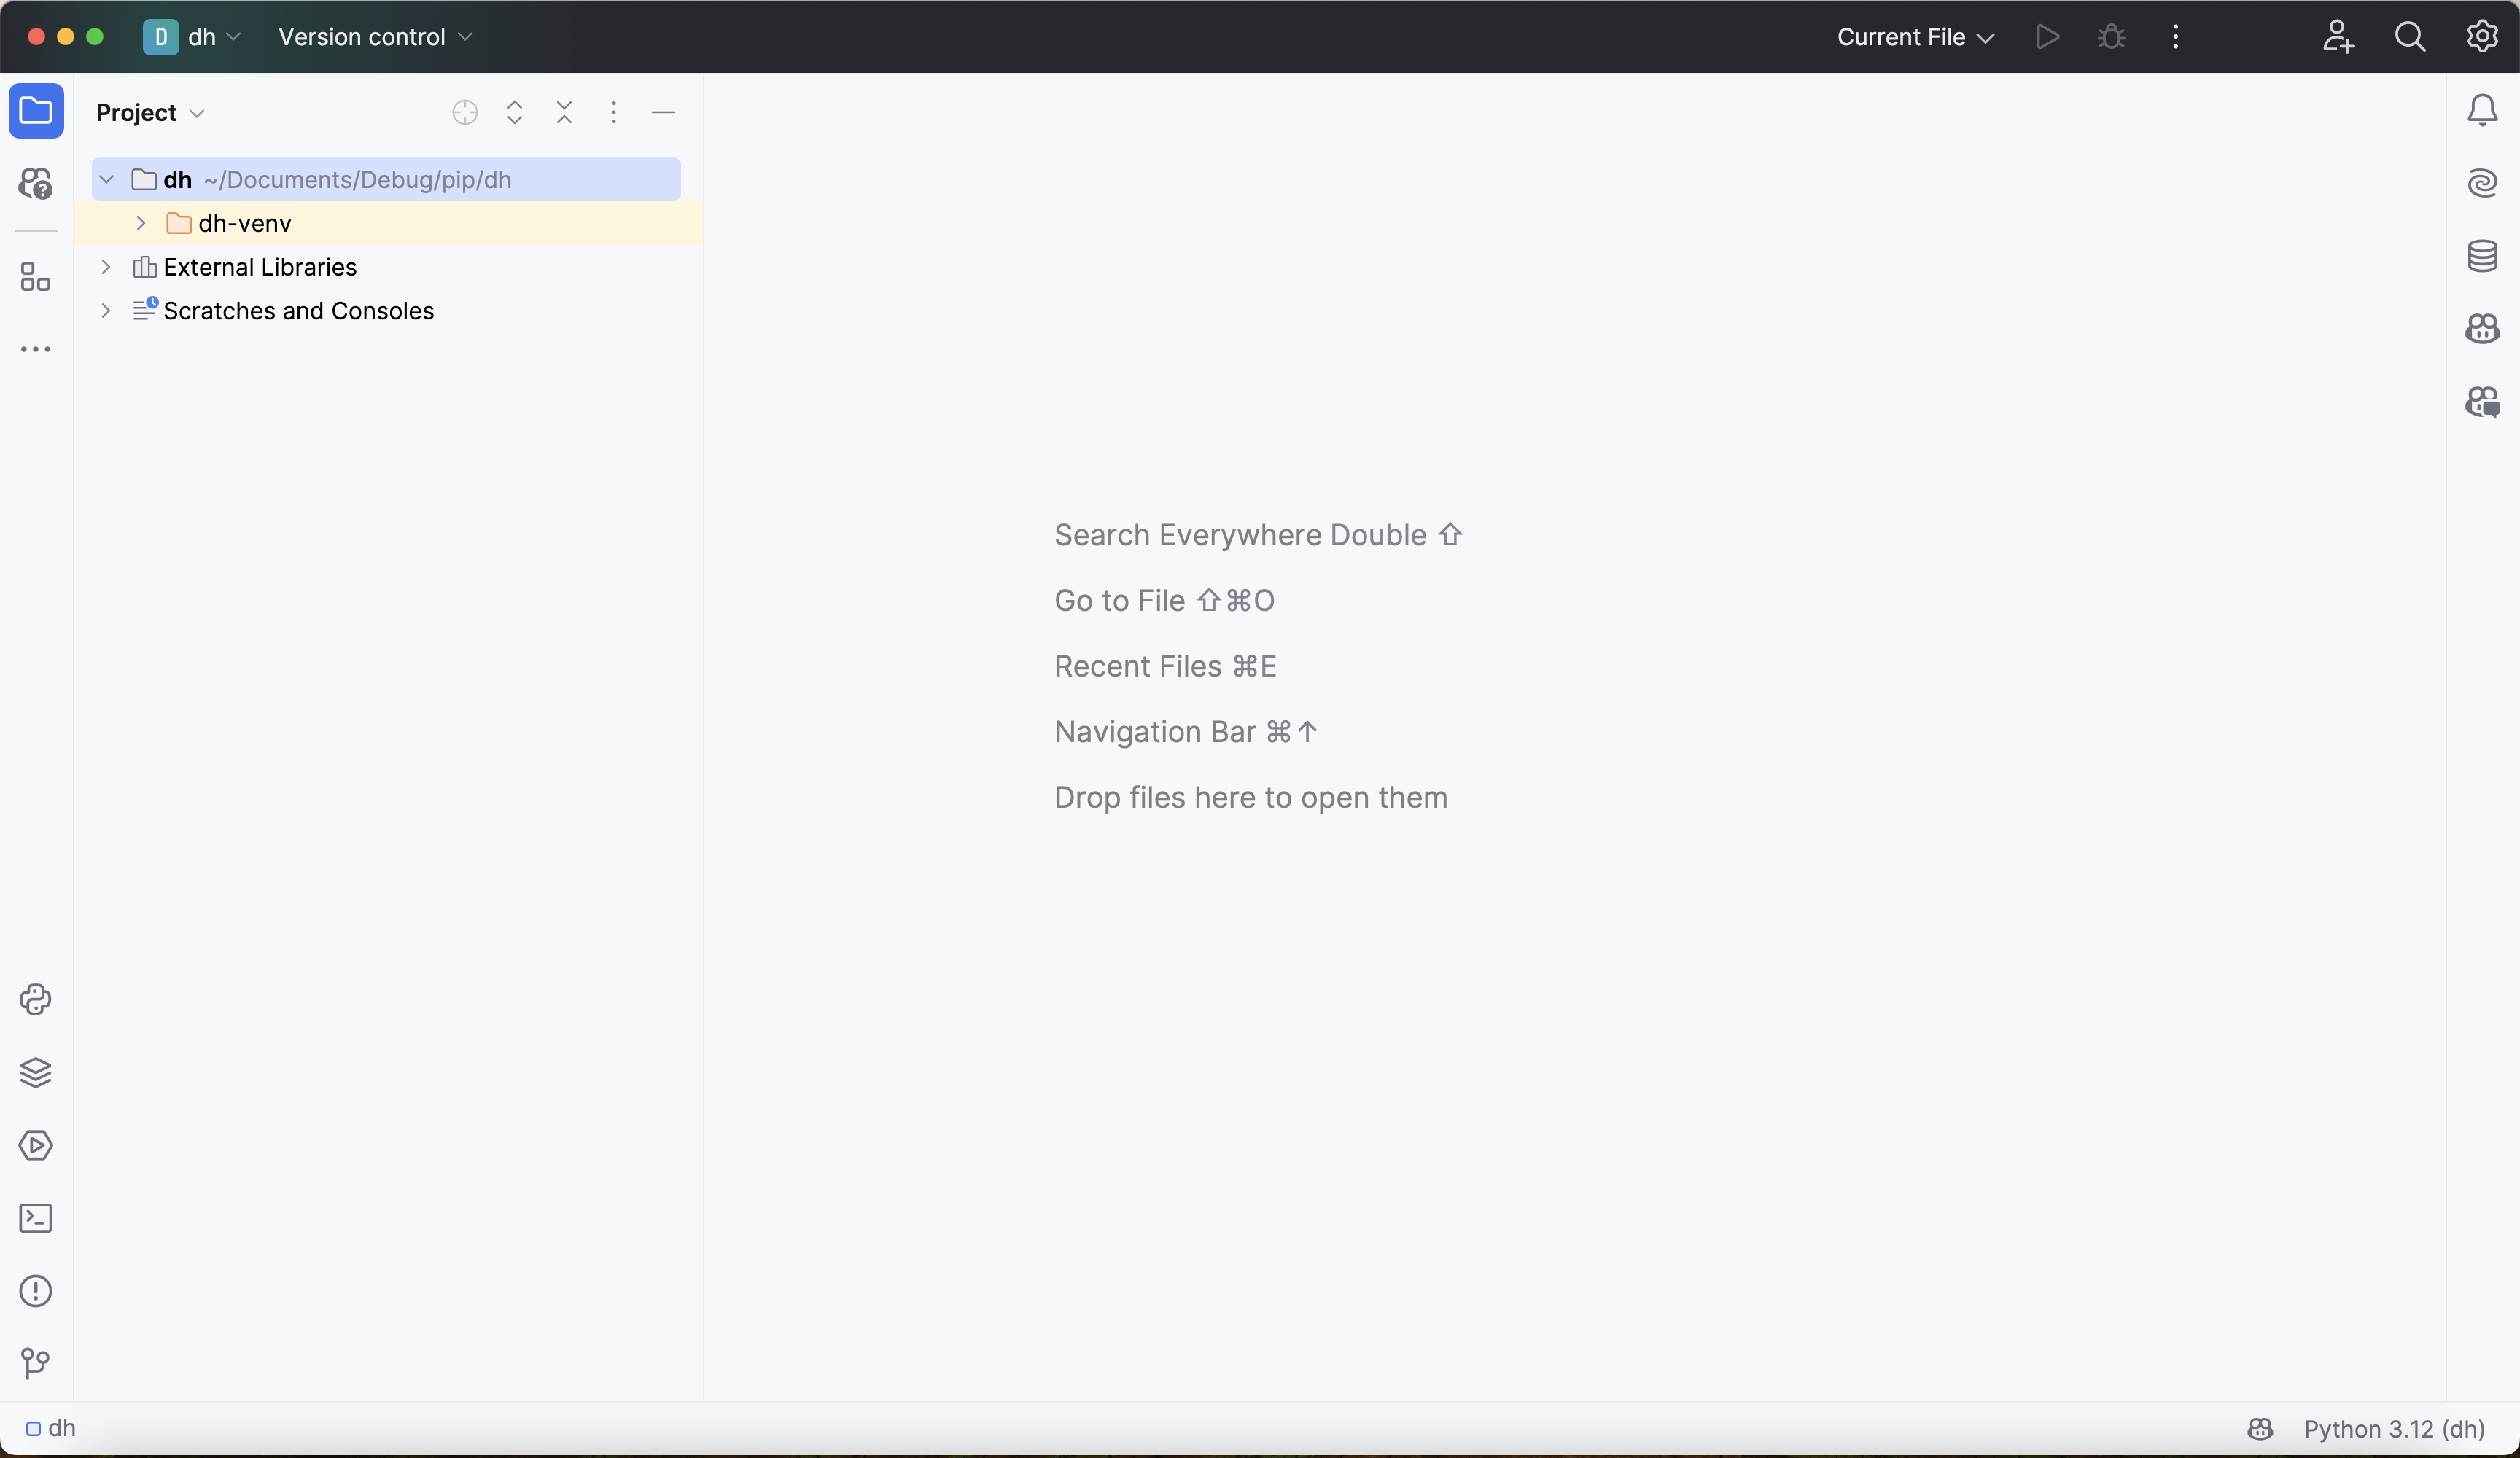
First, create a new PyCharm project from the directory containing the dh-venv virtual environment. The fresh PyCharm project looks like this:
Next, click on No interpreter in the bottom-right-hand corner, click Add New Interpreter > Add Local Interpreter, select Existing, and navigate to the python executable in dh-venv:
Click OK.
Verify that the interpreter is configured correctly by opening the terminal and running which deephaven. It should return the path of the deephaven package inside of dh-venv:
3. Create debugging server
Next, create a remote debugging server from PyCharm.
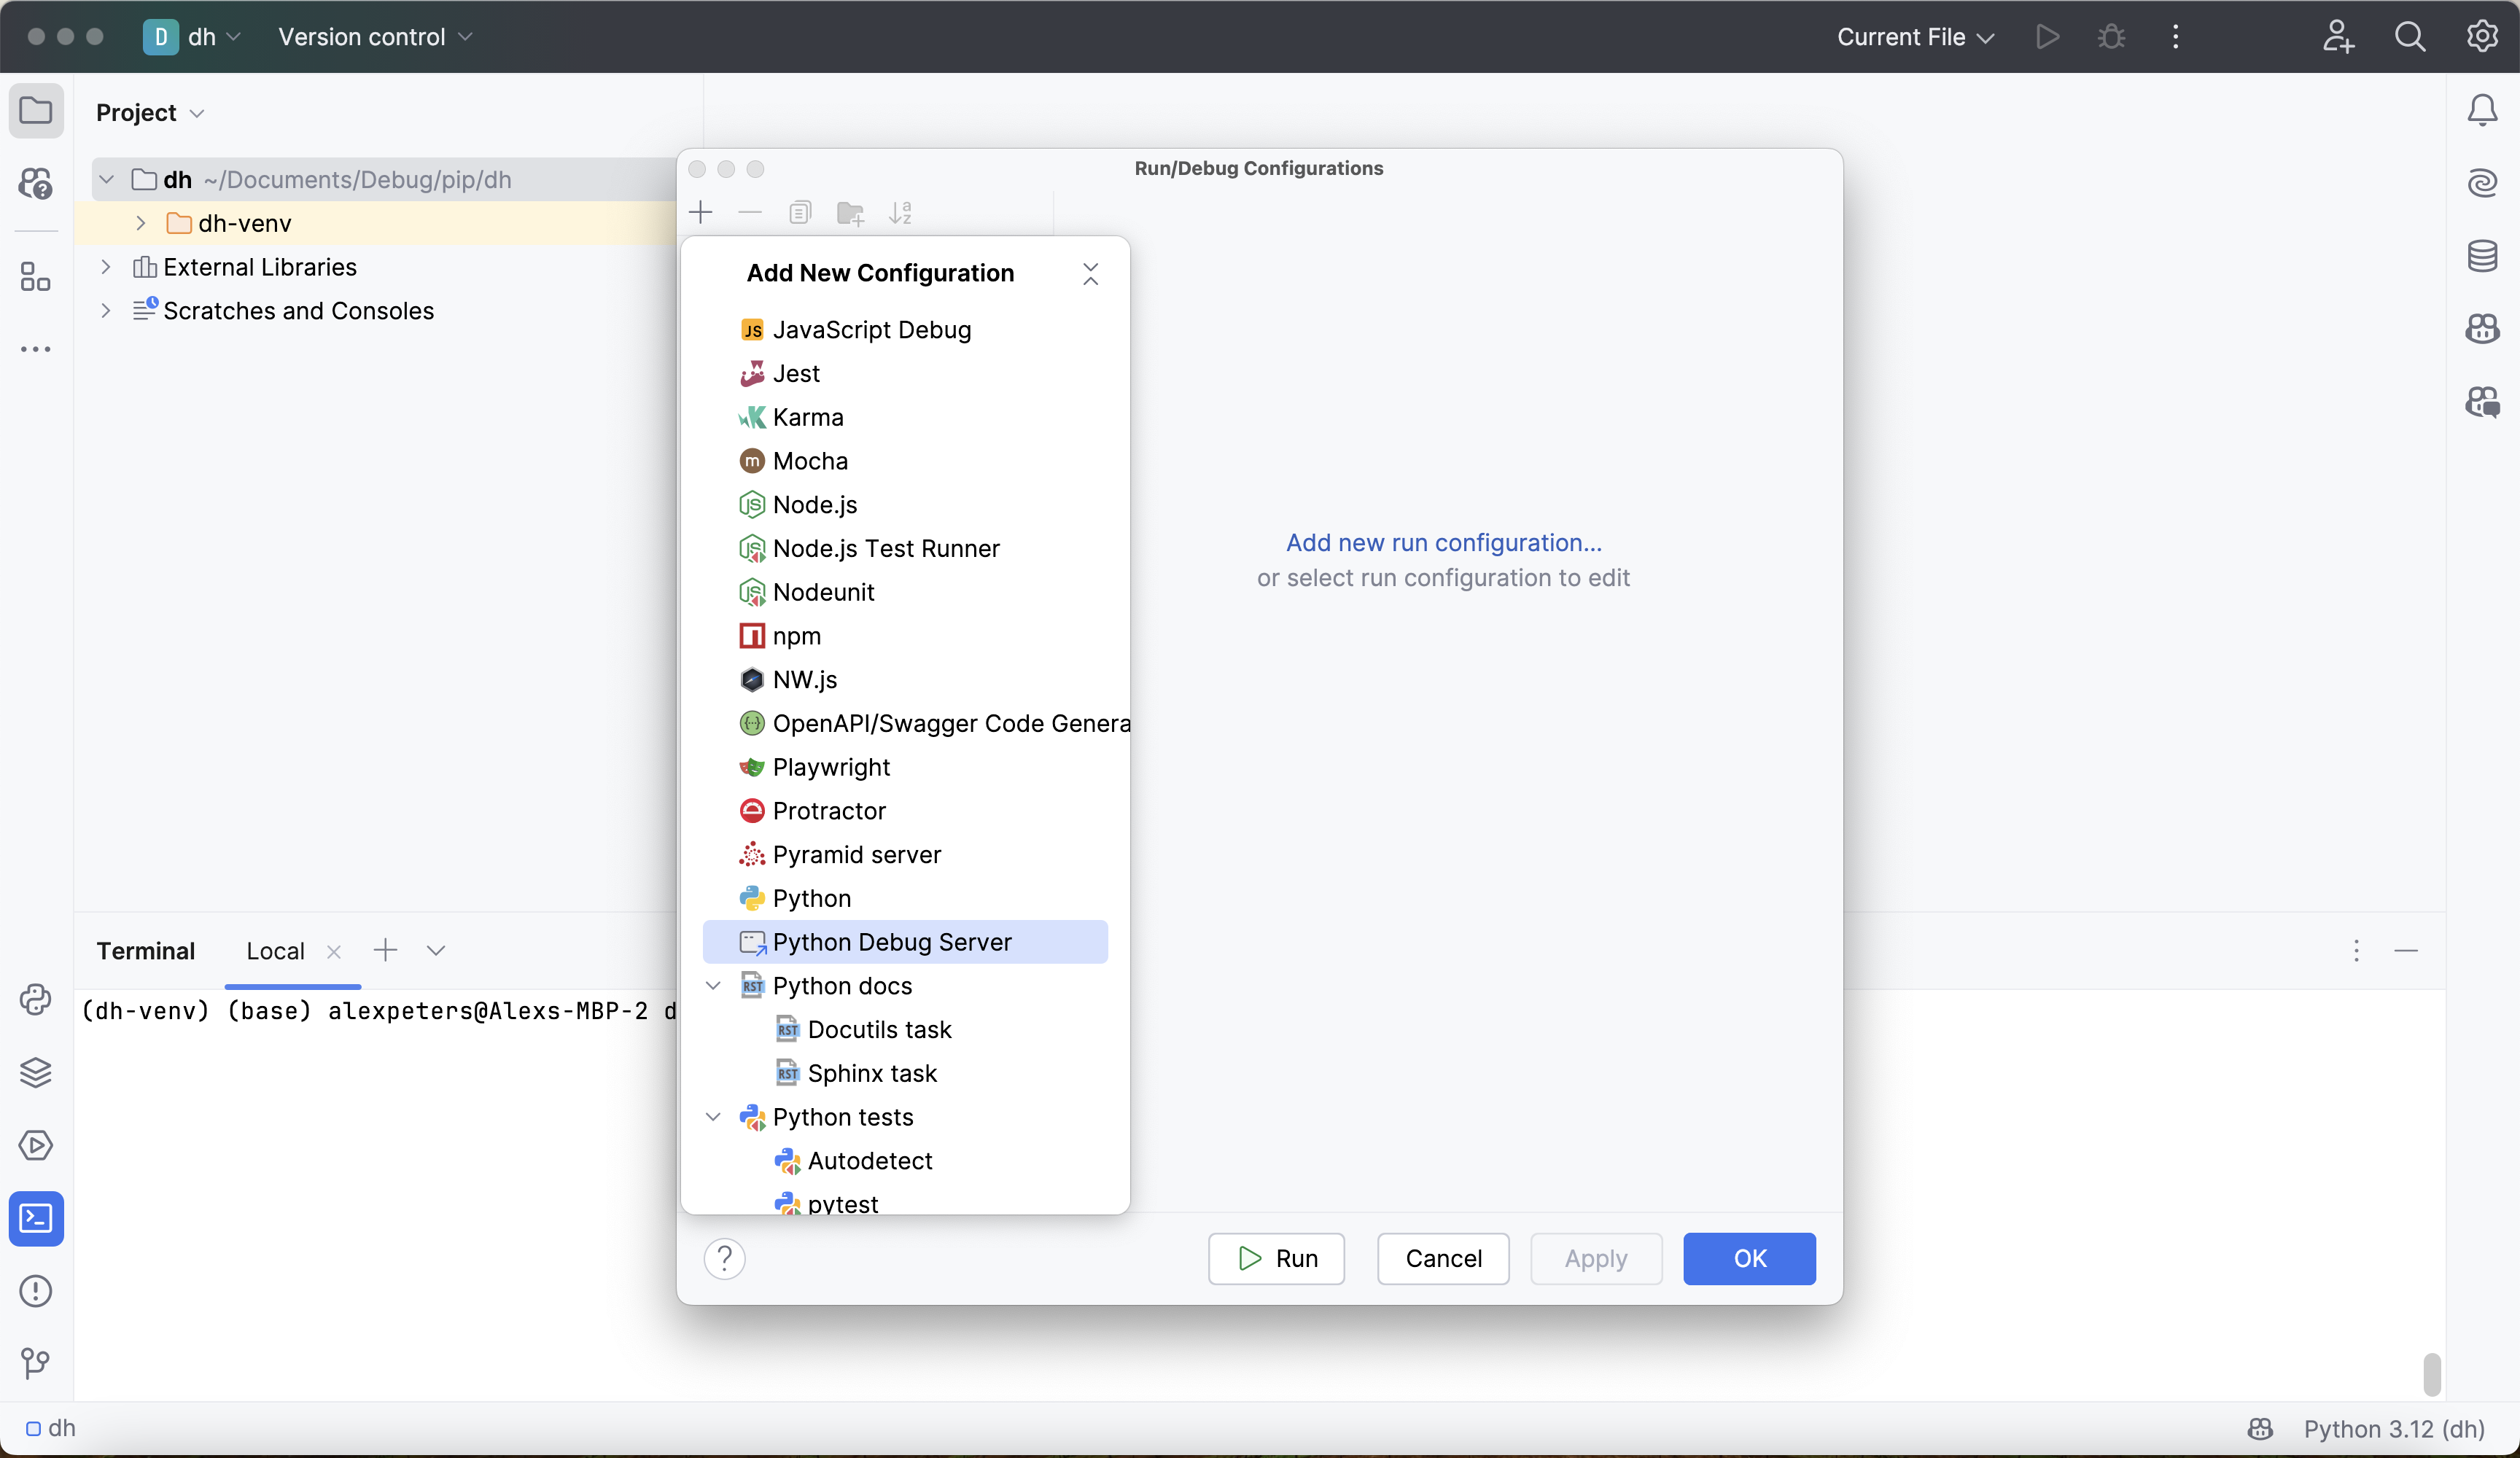
Go to Run > Edit Configurations, which opens up the Run/Debug Configurations window. Click on + in the top left corner to add a new configuration. This will bring up a list of configuration types to select. Scroll down and select the Python Debug Server configuration option:
Give the configuration a reasonable, memorable name. The virtual environment is named dh-venv, so the configuration will be named dh-venv-debugging-server.
Next, set the IDE host name. Since the pip-installed Deephaven server is going to be running locally, the hostname is localhost.
Finally, choose a port for the debug server to run on. Note that this is not the same as the port that the Deephaven server runs on, which is port 10000 by default. Any unused port will work for this - we will use port 4444.
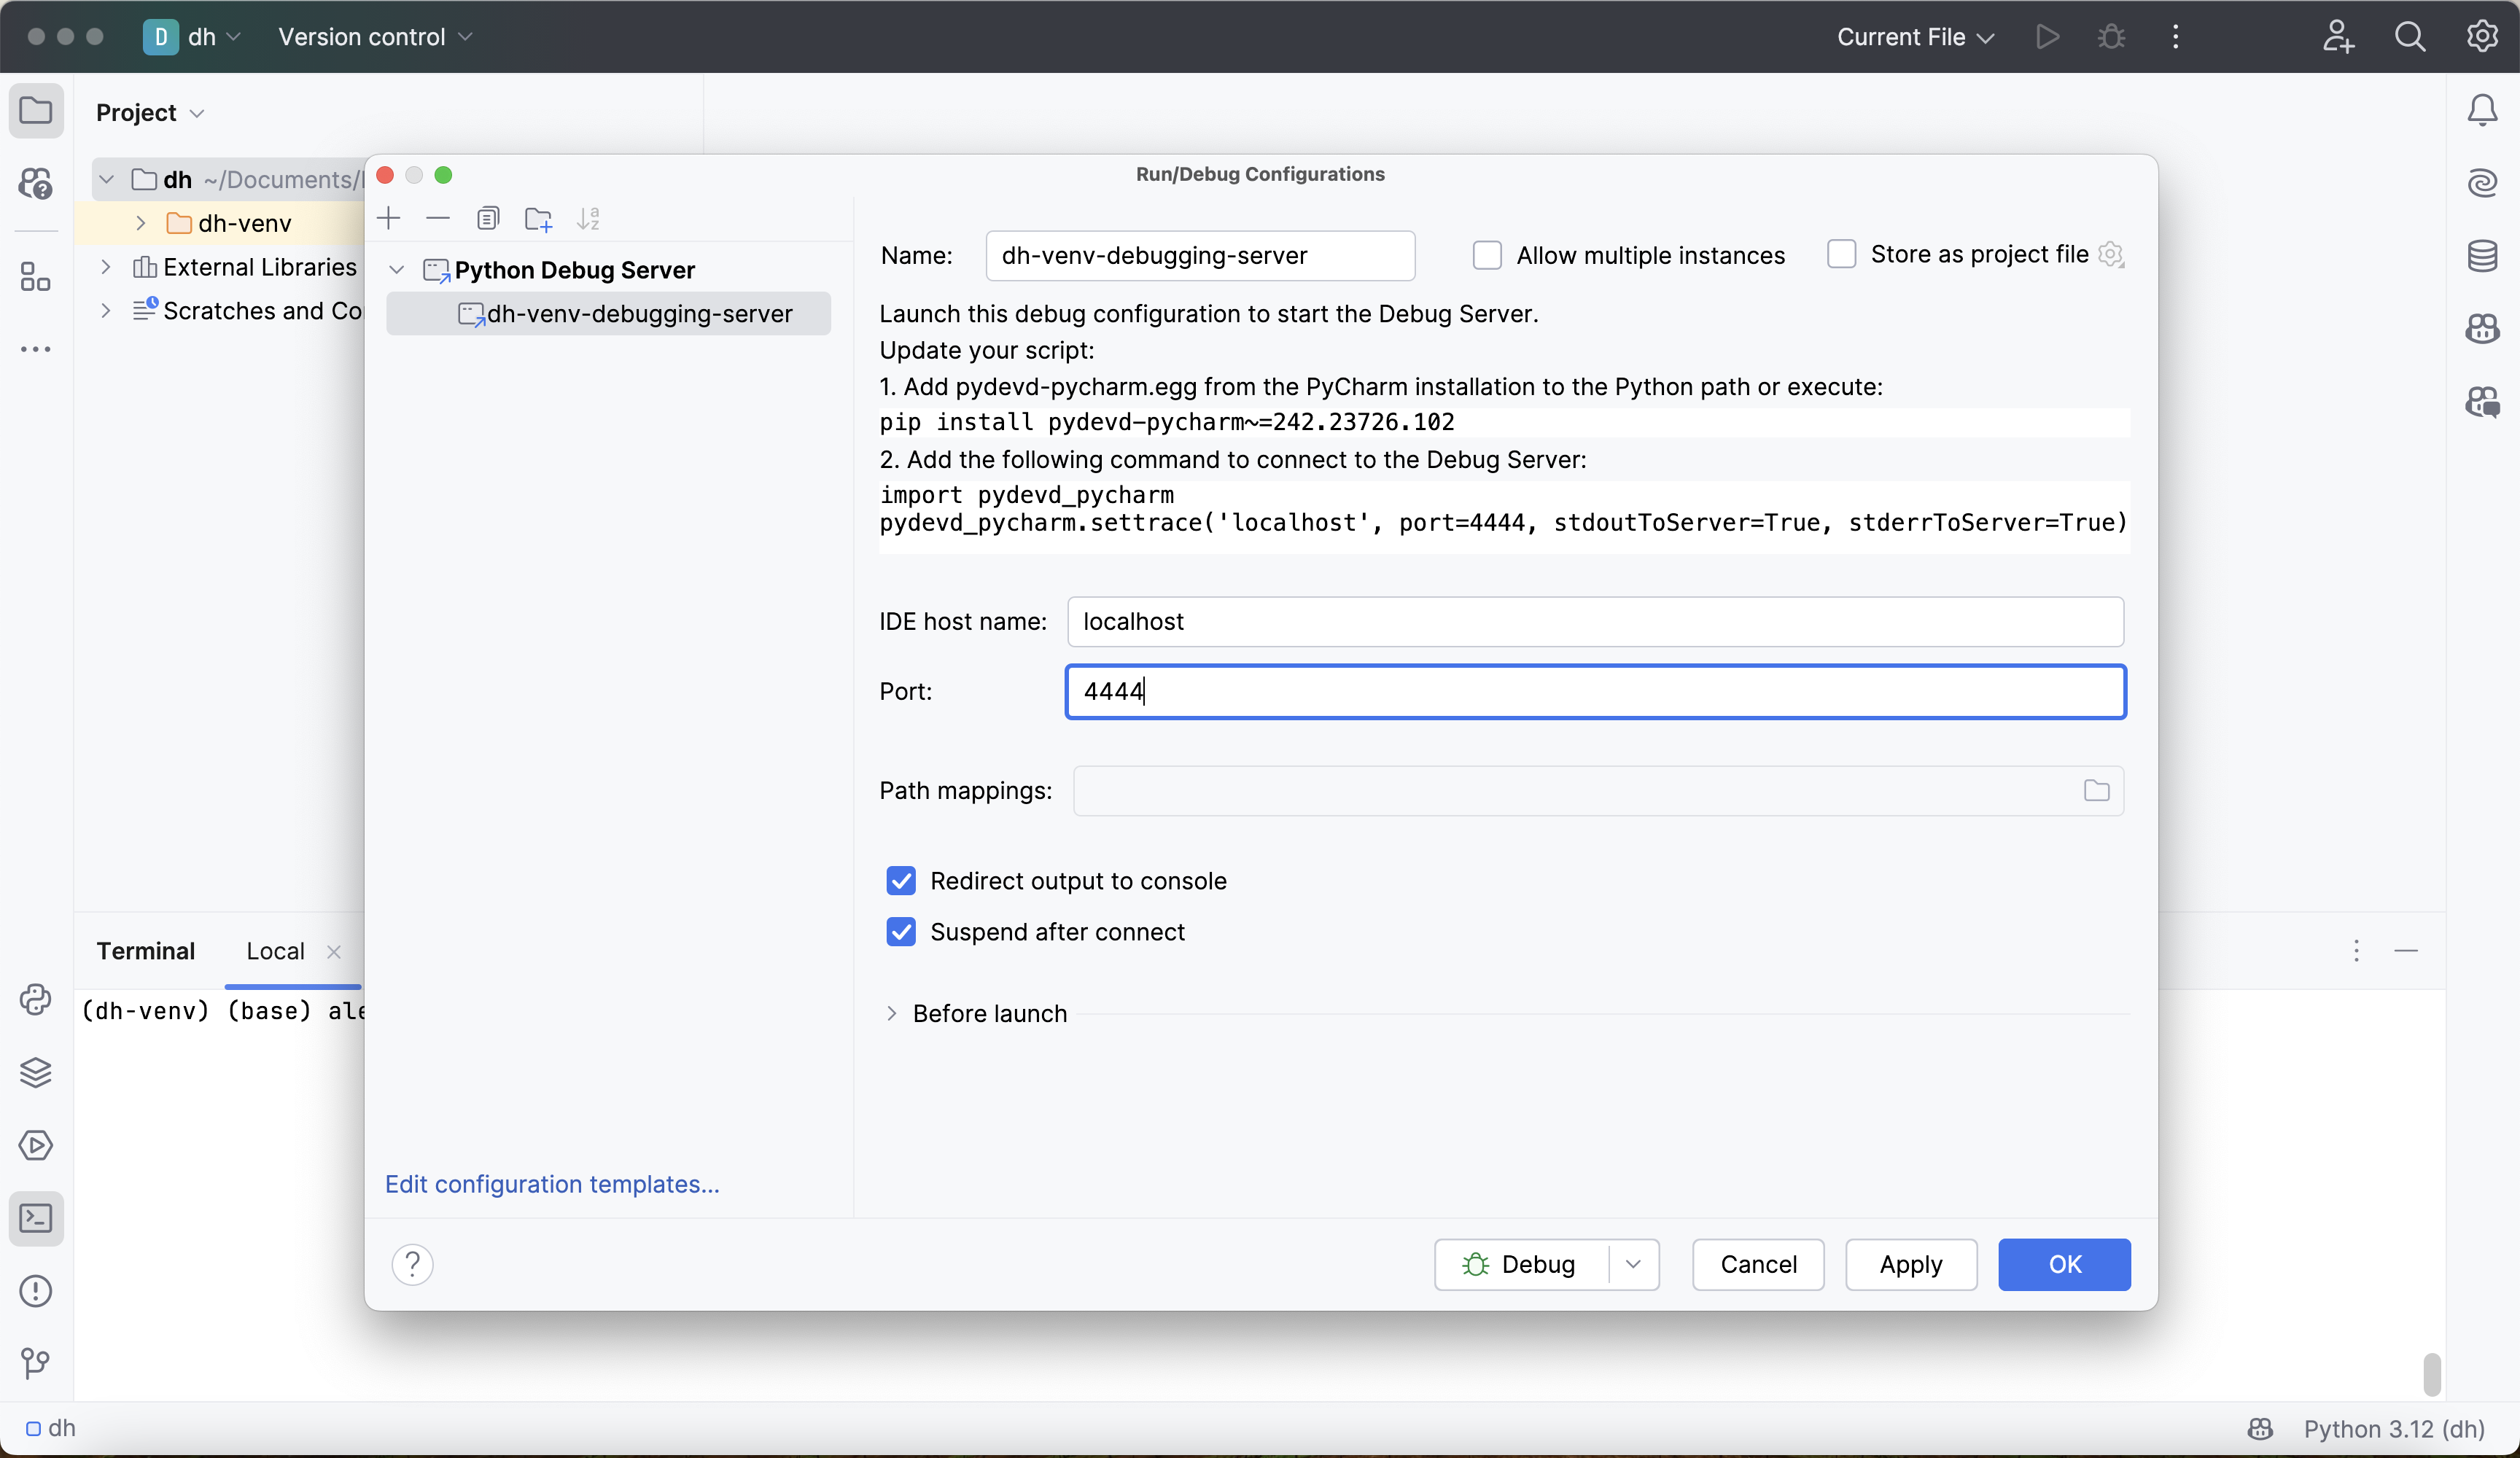
Click Apply and Ok, and the new debug server will be immediately available for use.
4. Attach debugger to Deephaven
Warning
The Deephaven server must be run with anonymous authentication for this kind of debugging to work. Otherwise, the debugger will fail to connect with the server.
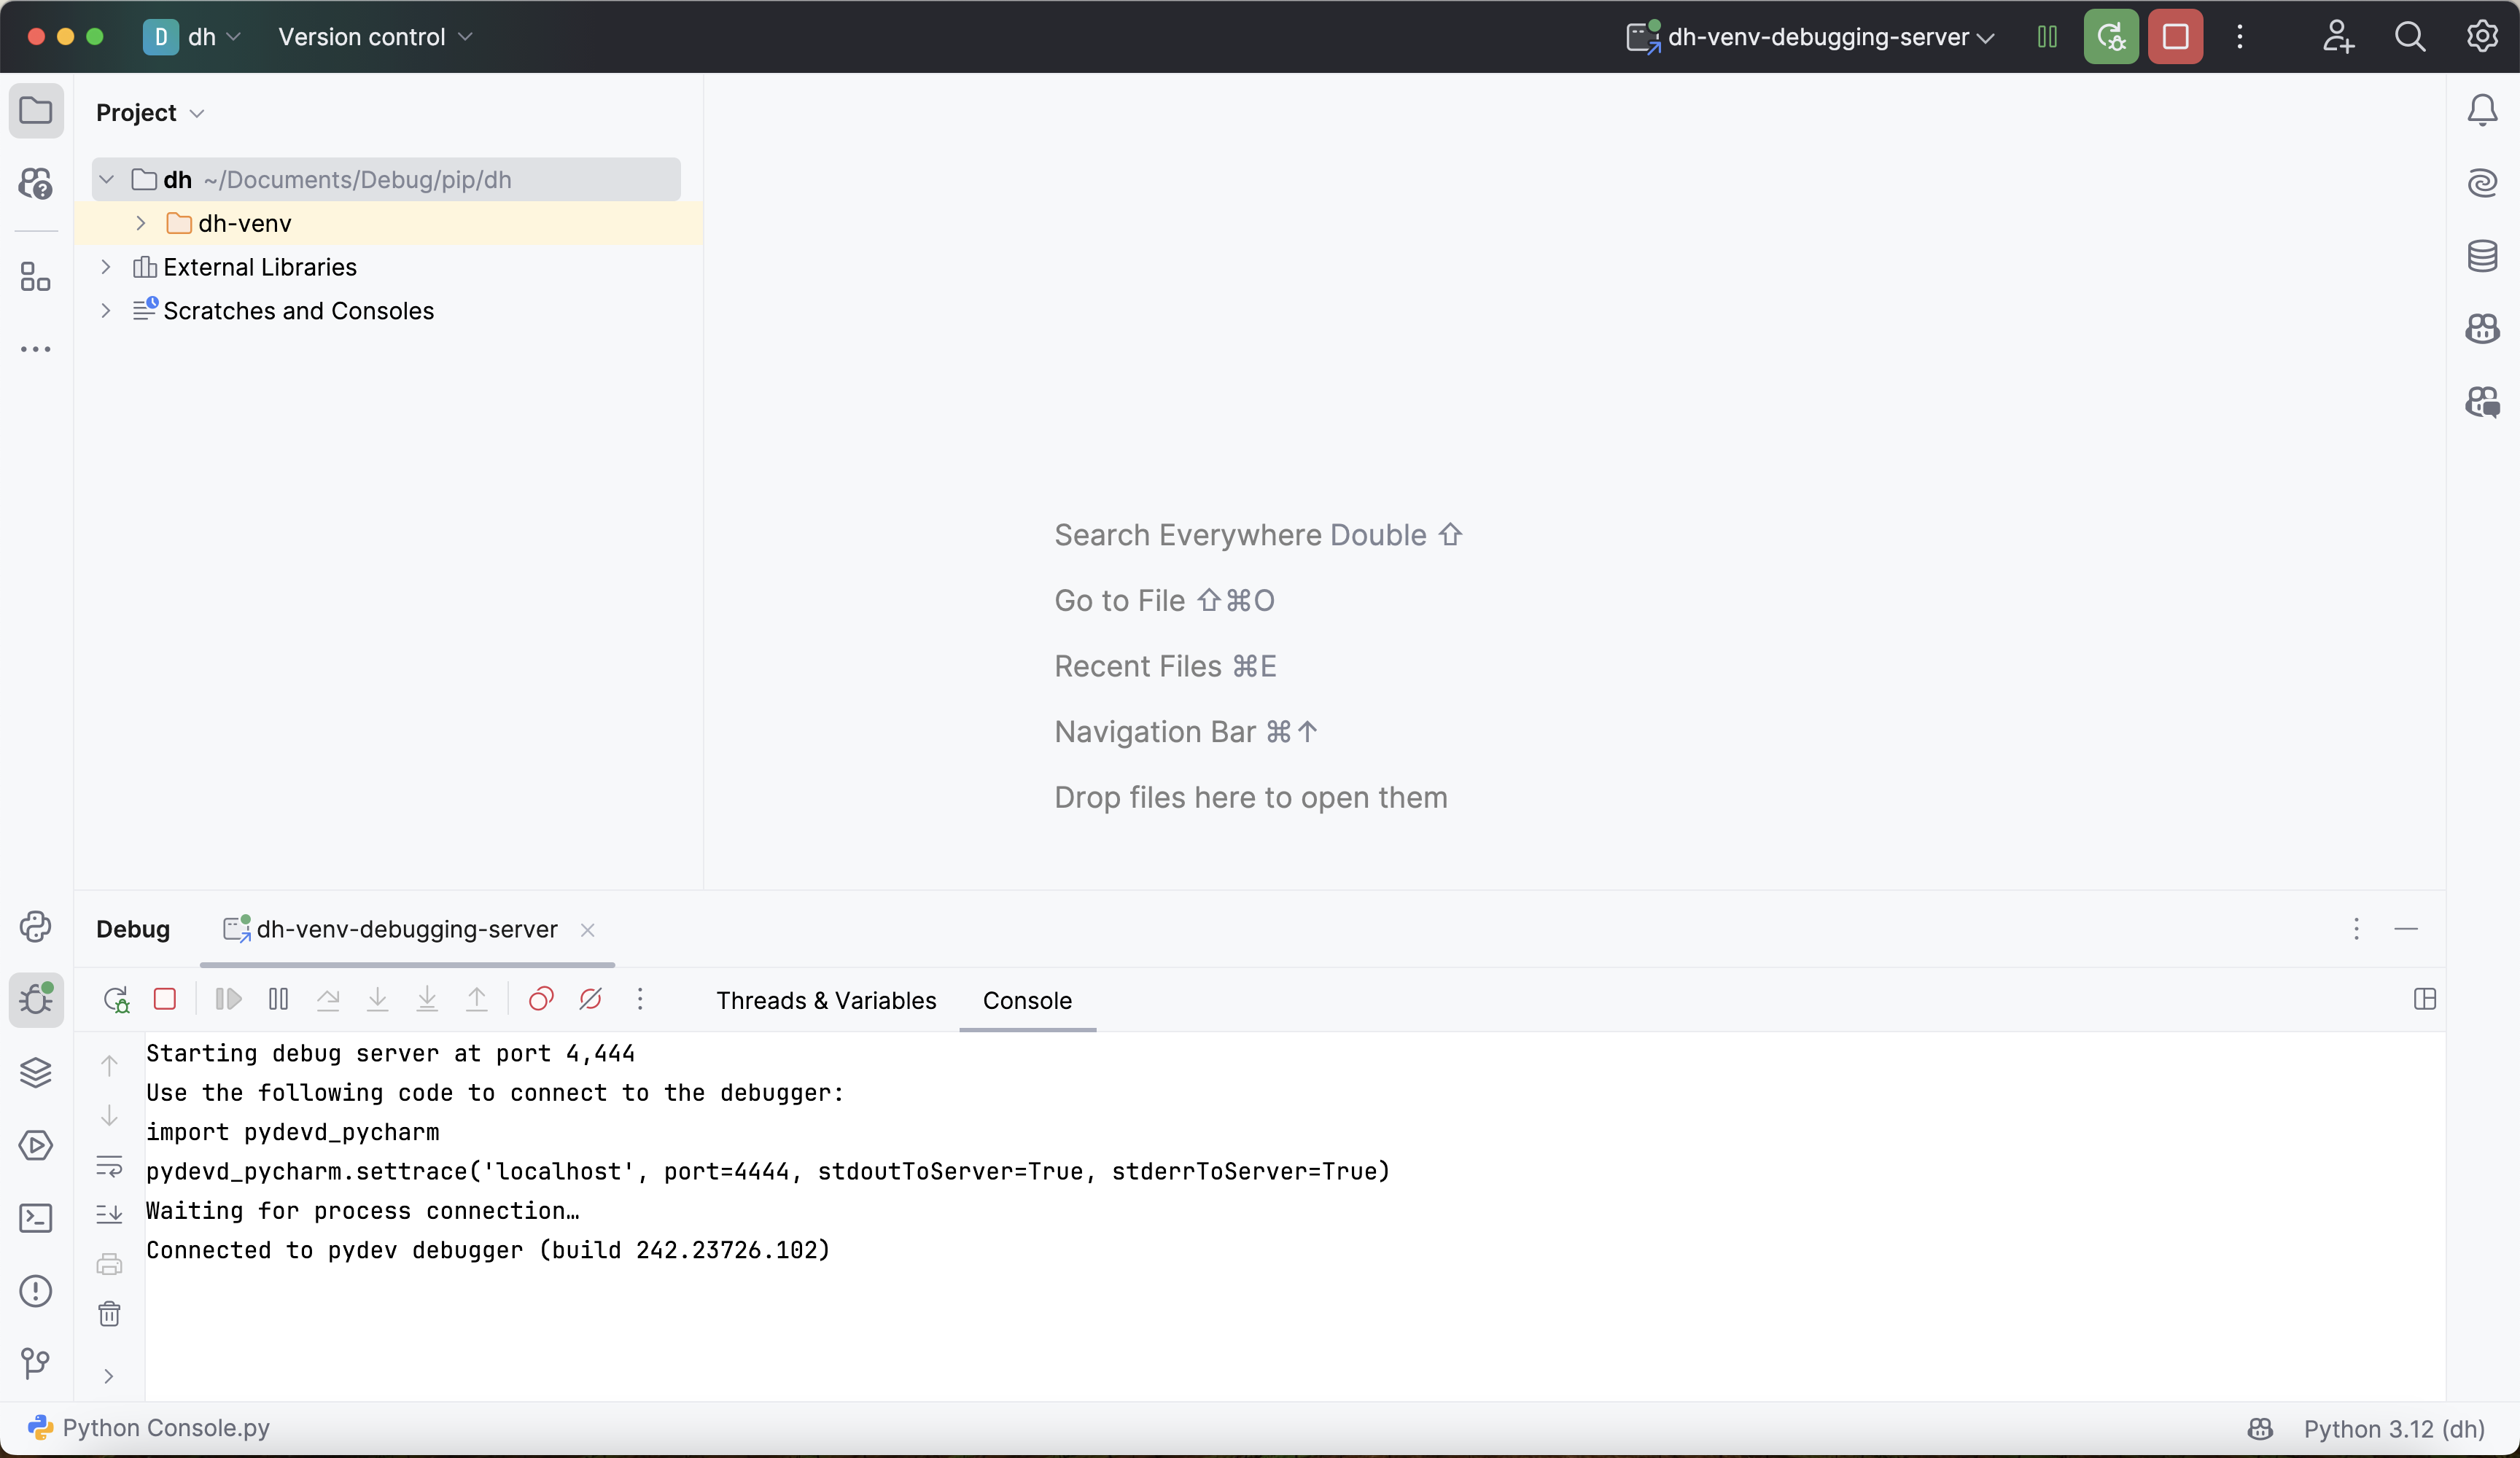
Start the debugger in PyCharm by clicking the small green bug icon in the window's top right corner. This will start the debugger and open a debugging console:
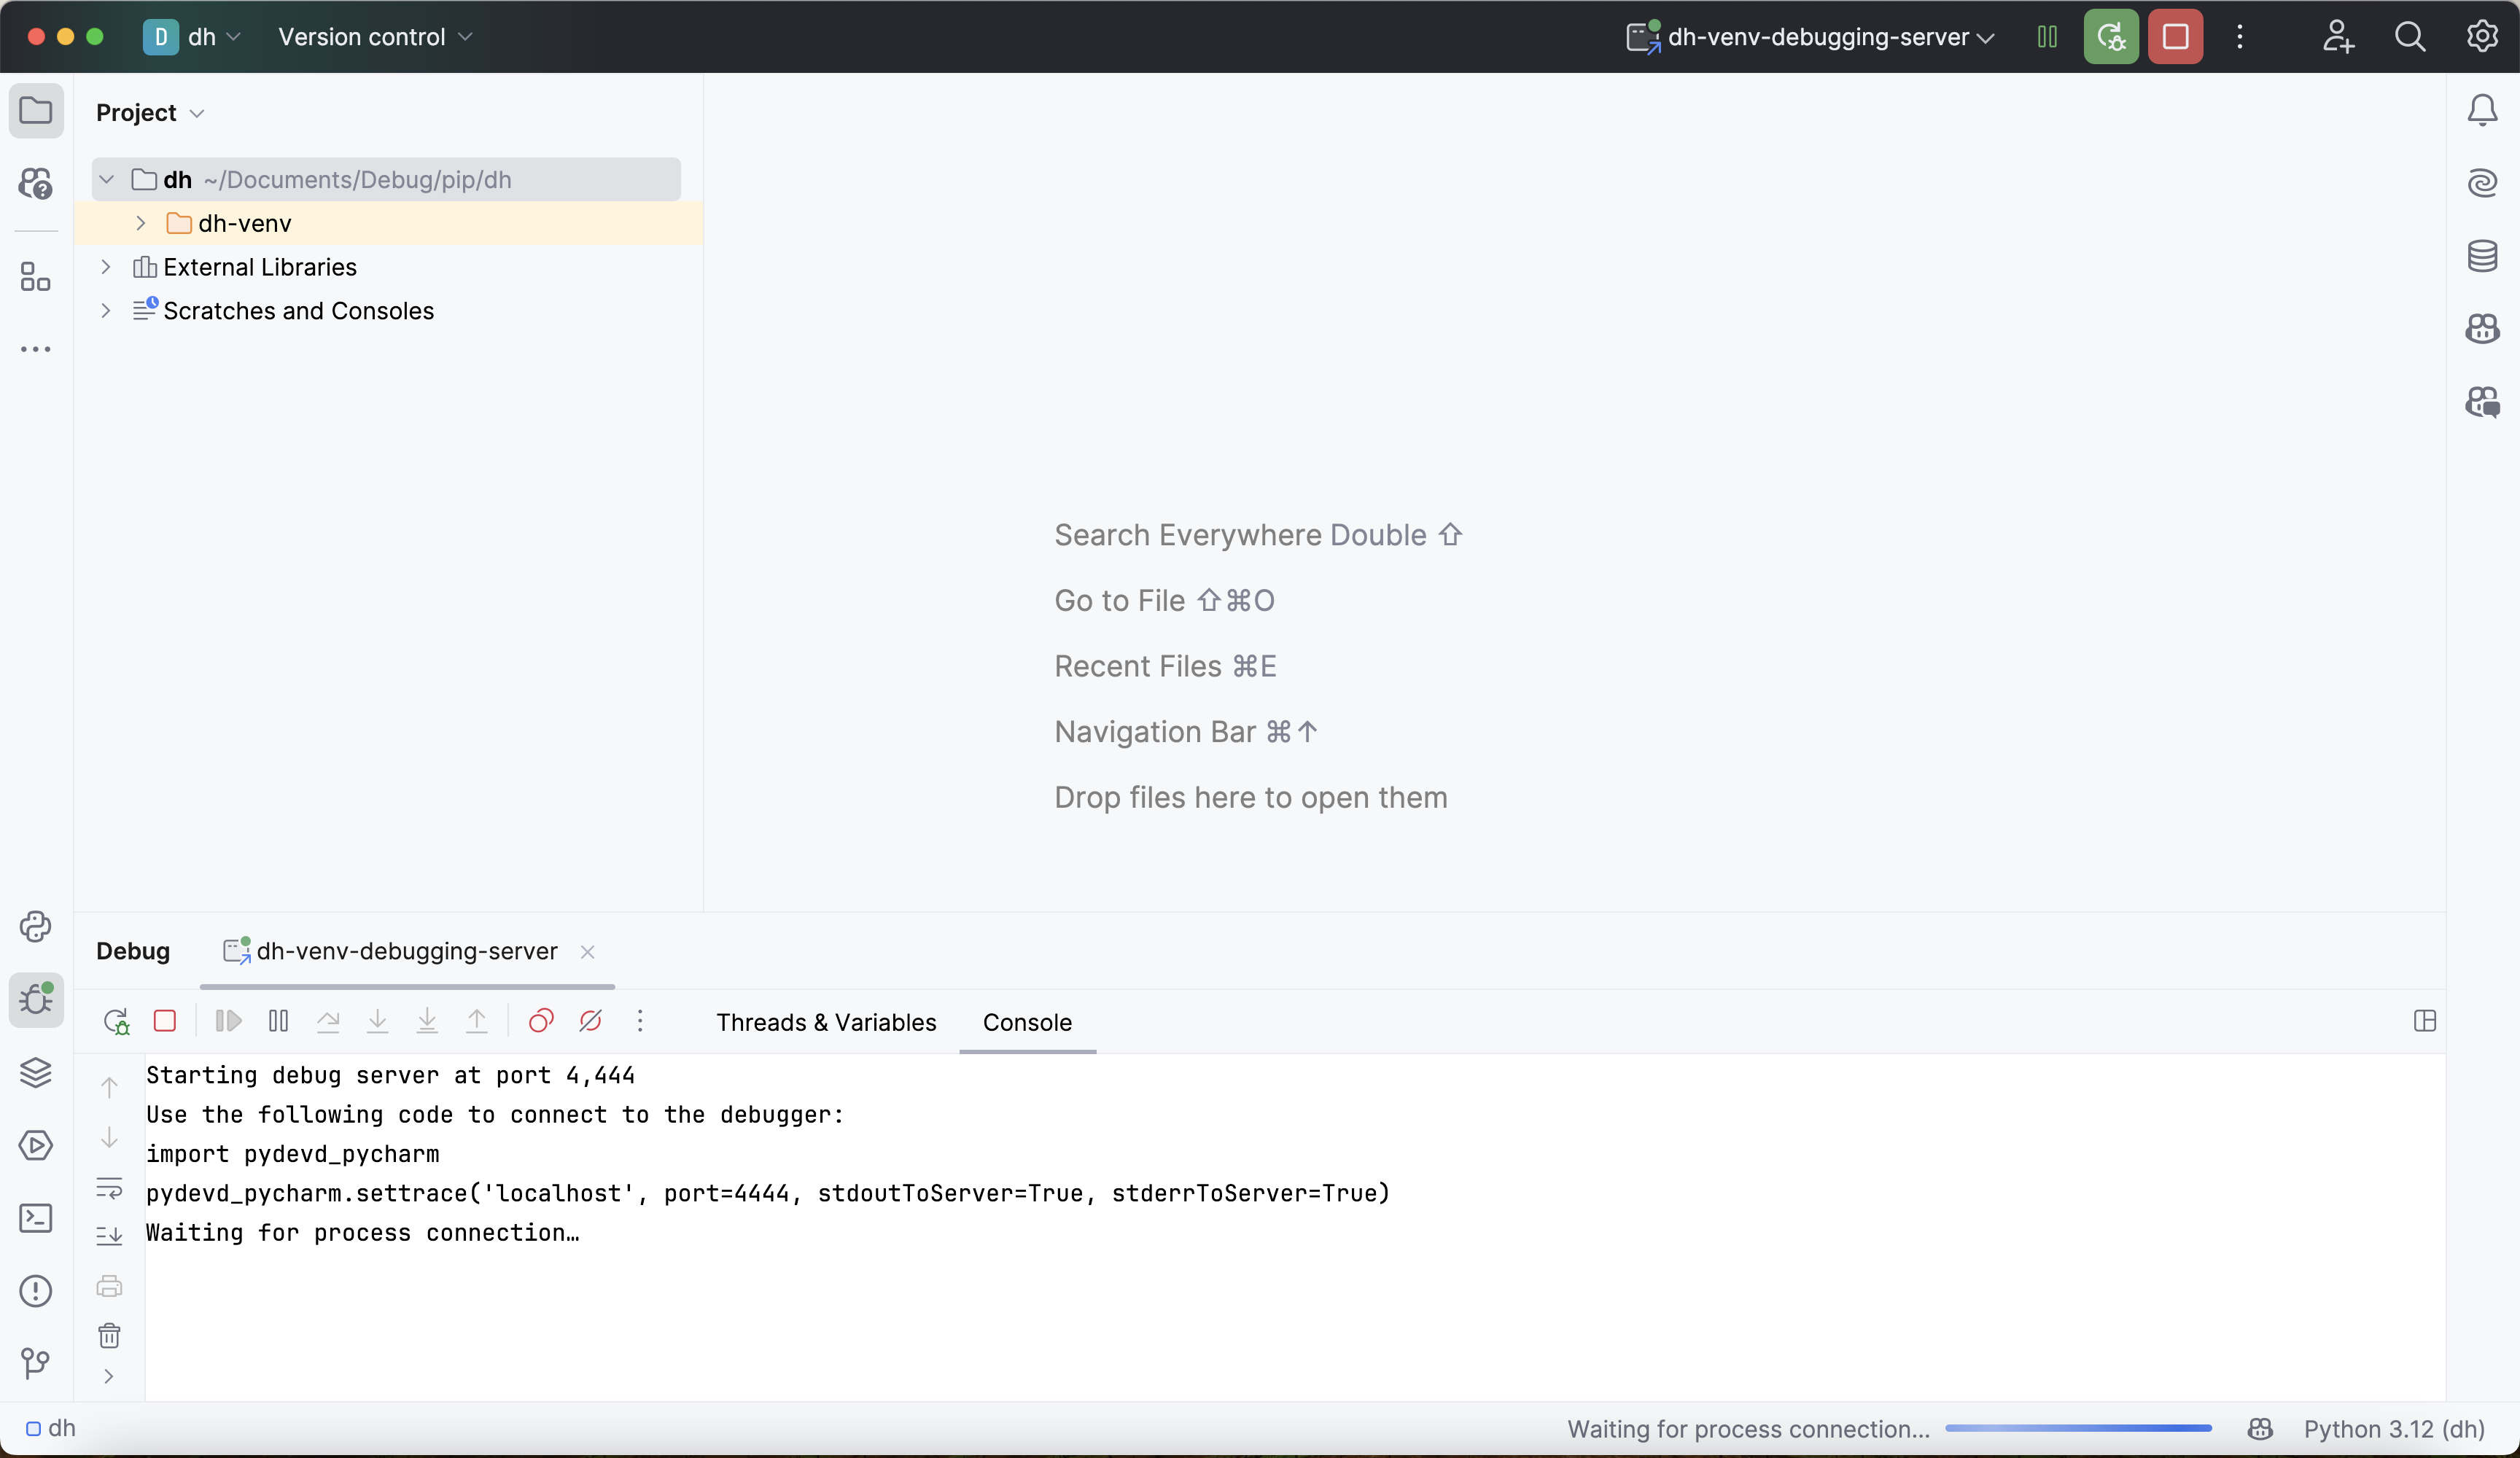
The output above states that the debugger is "waiting for process connection". This means that the debugger is not yet attached to the Deephaven process.
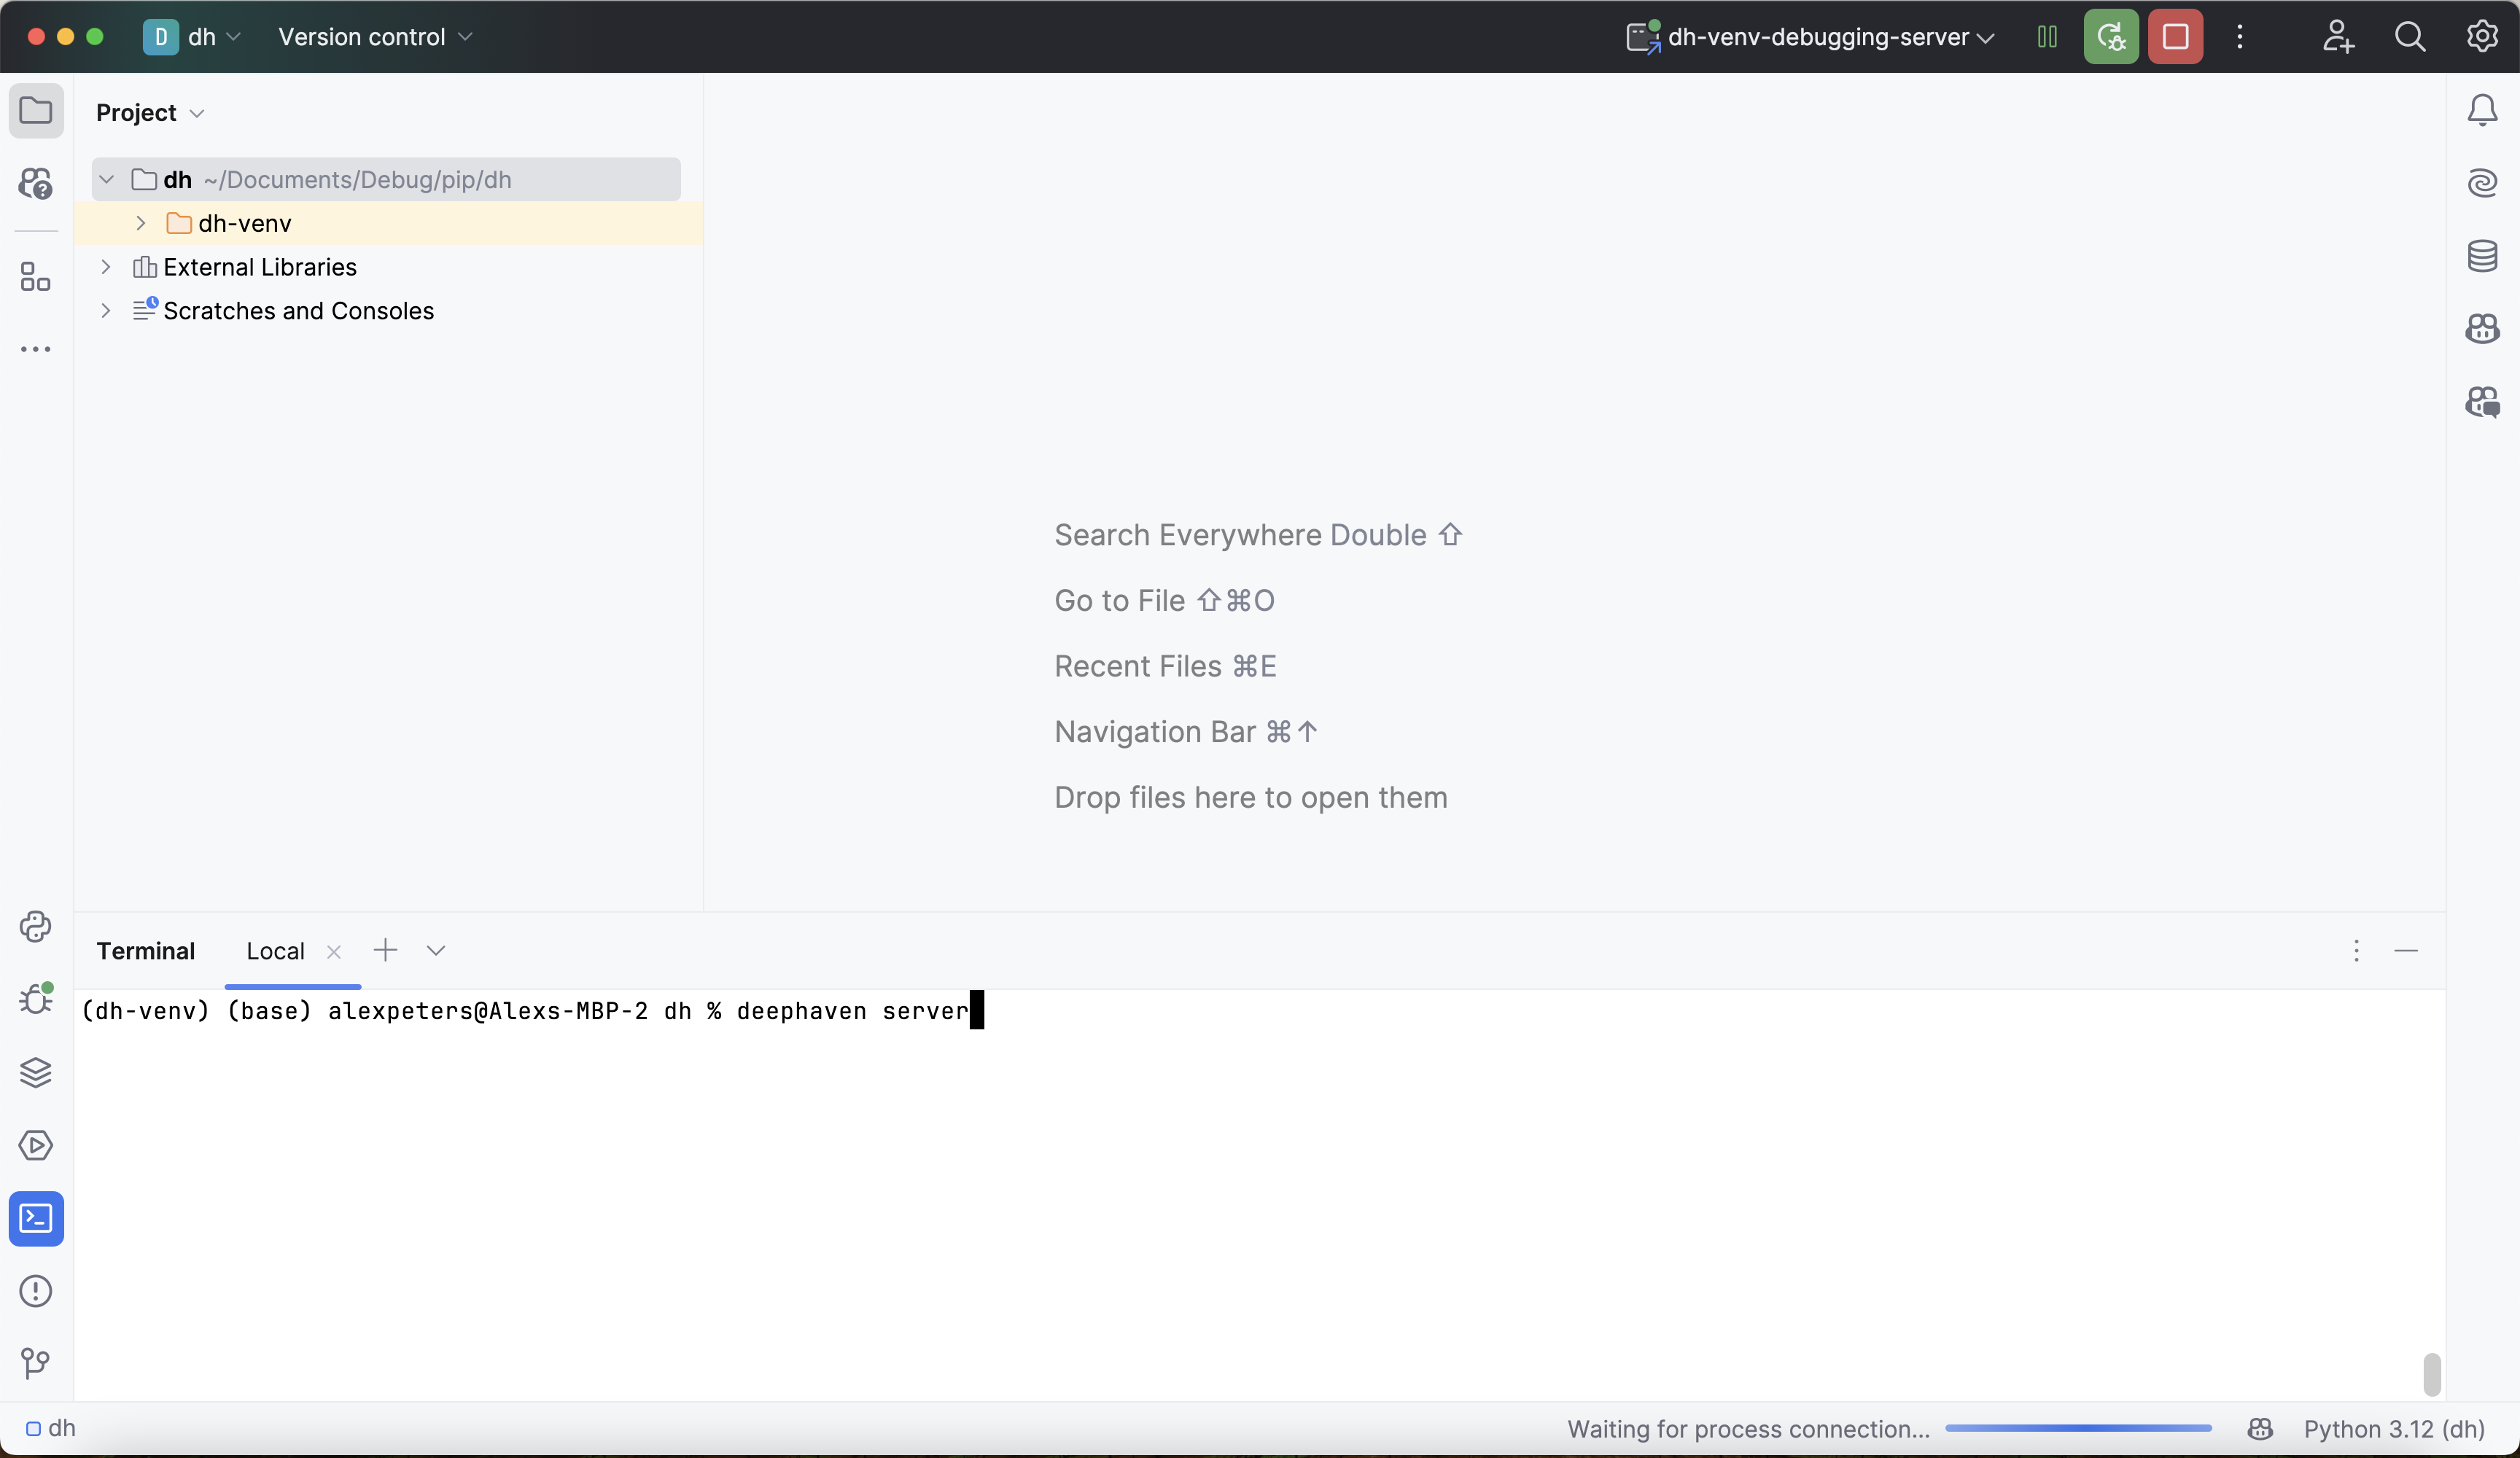
Now, from the same virtual environment that the PyCharm debugger is running in, start the Deephaven server with anonymous authentication enabled. The easiest way to do this is to create a startup script or open up a new terminal in the current PyCharm project and run:
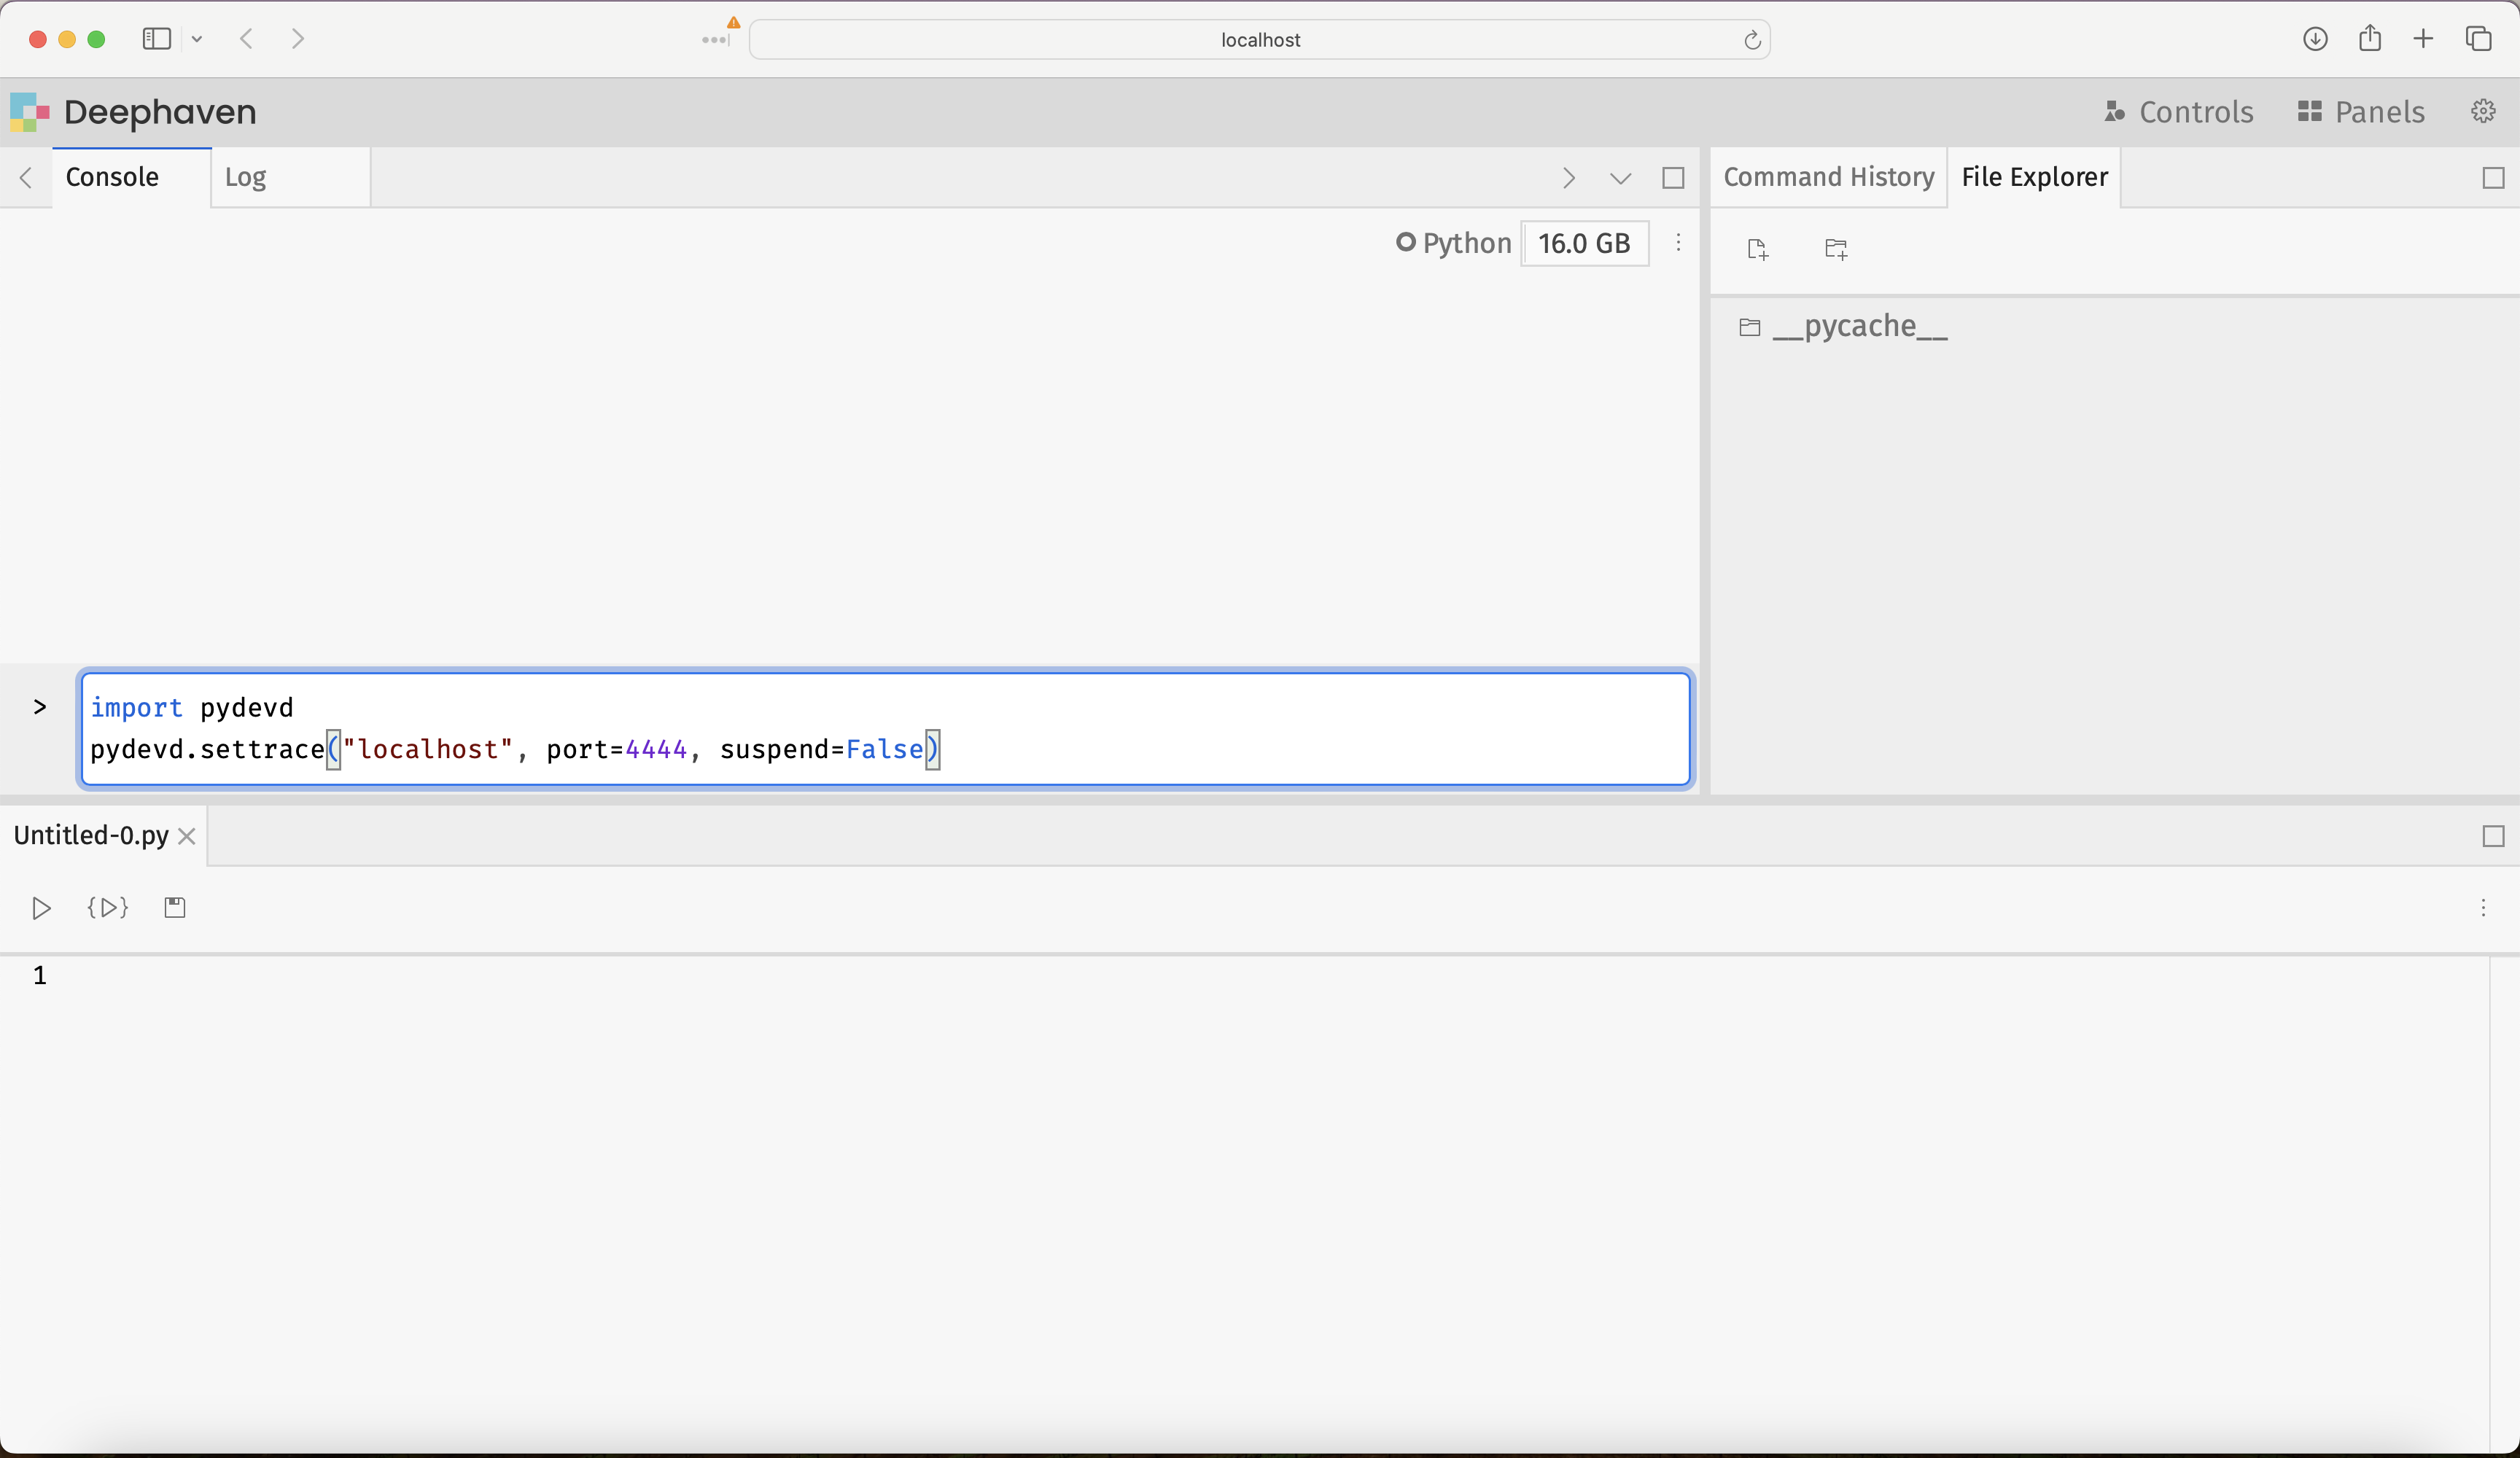
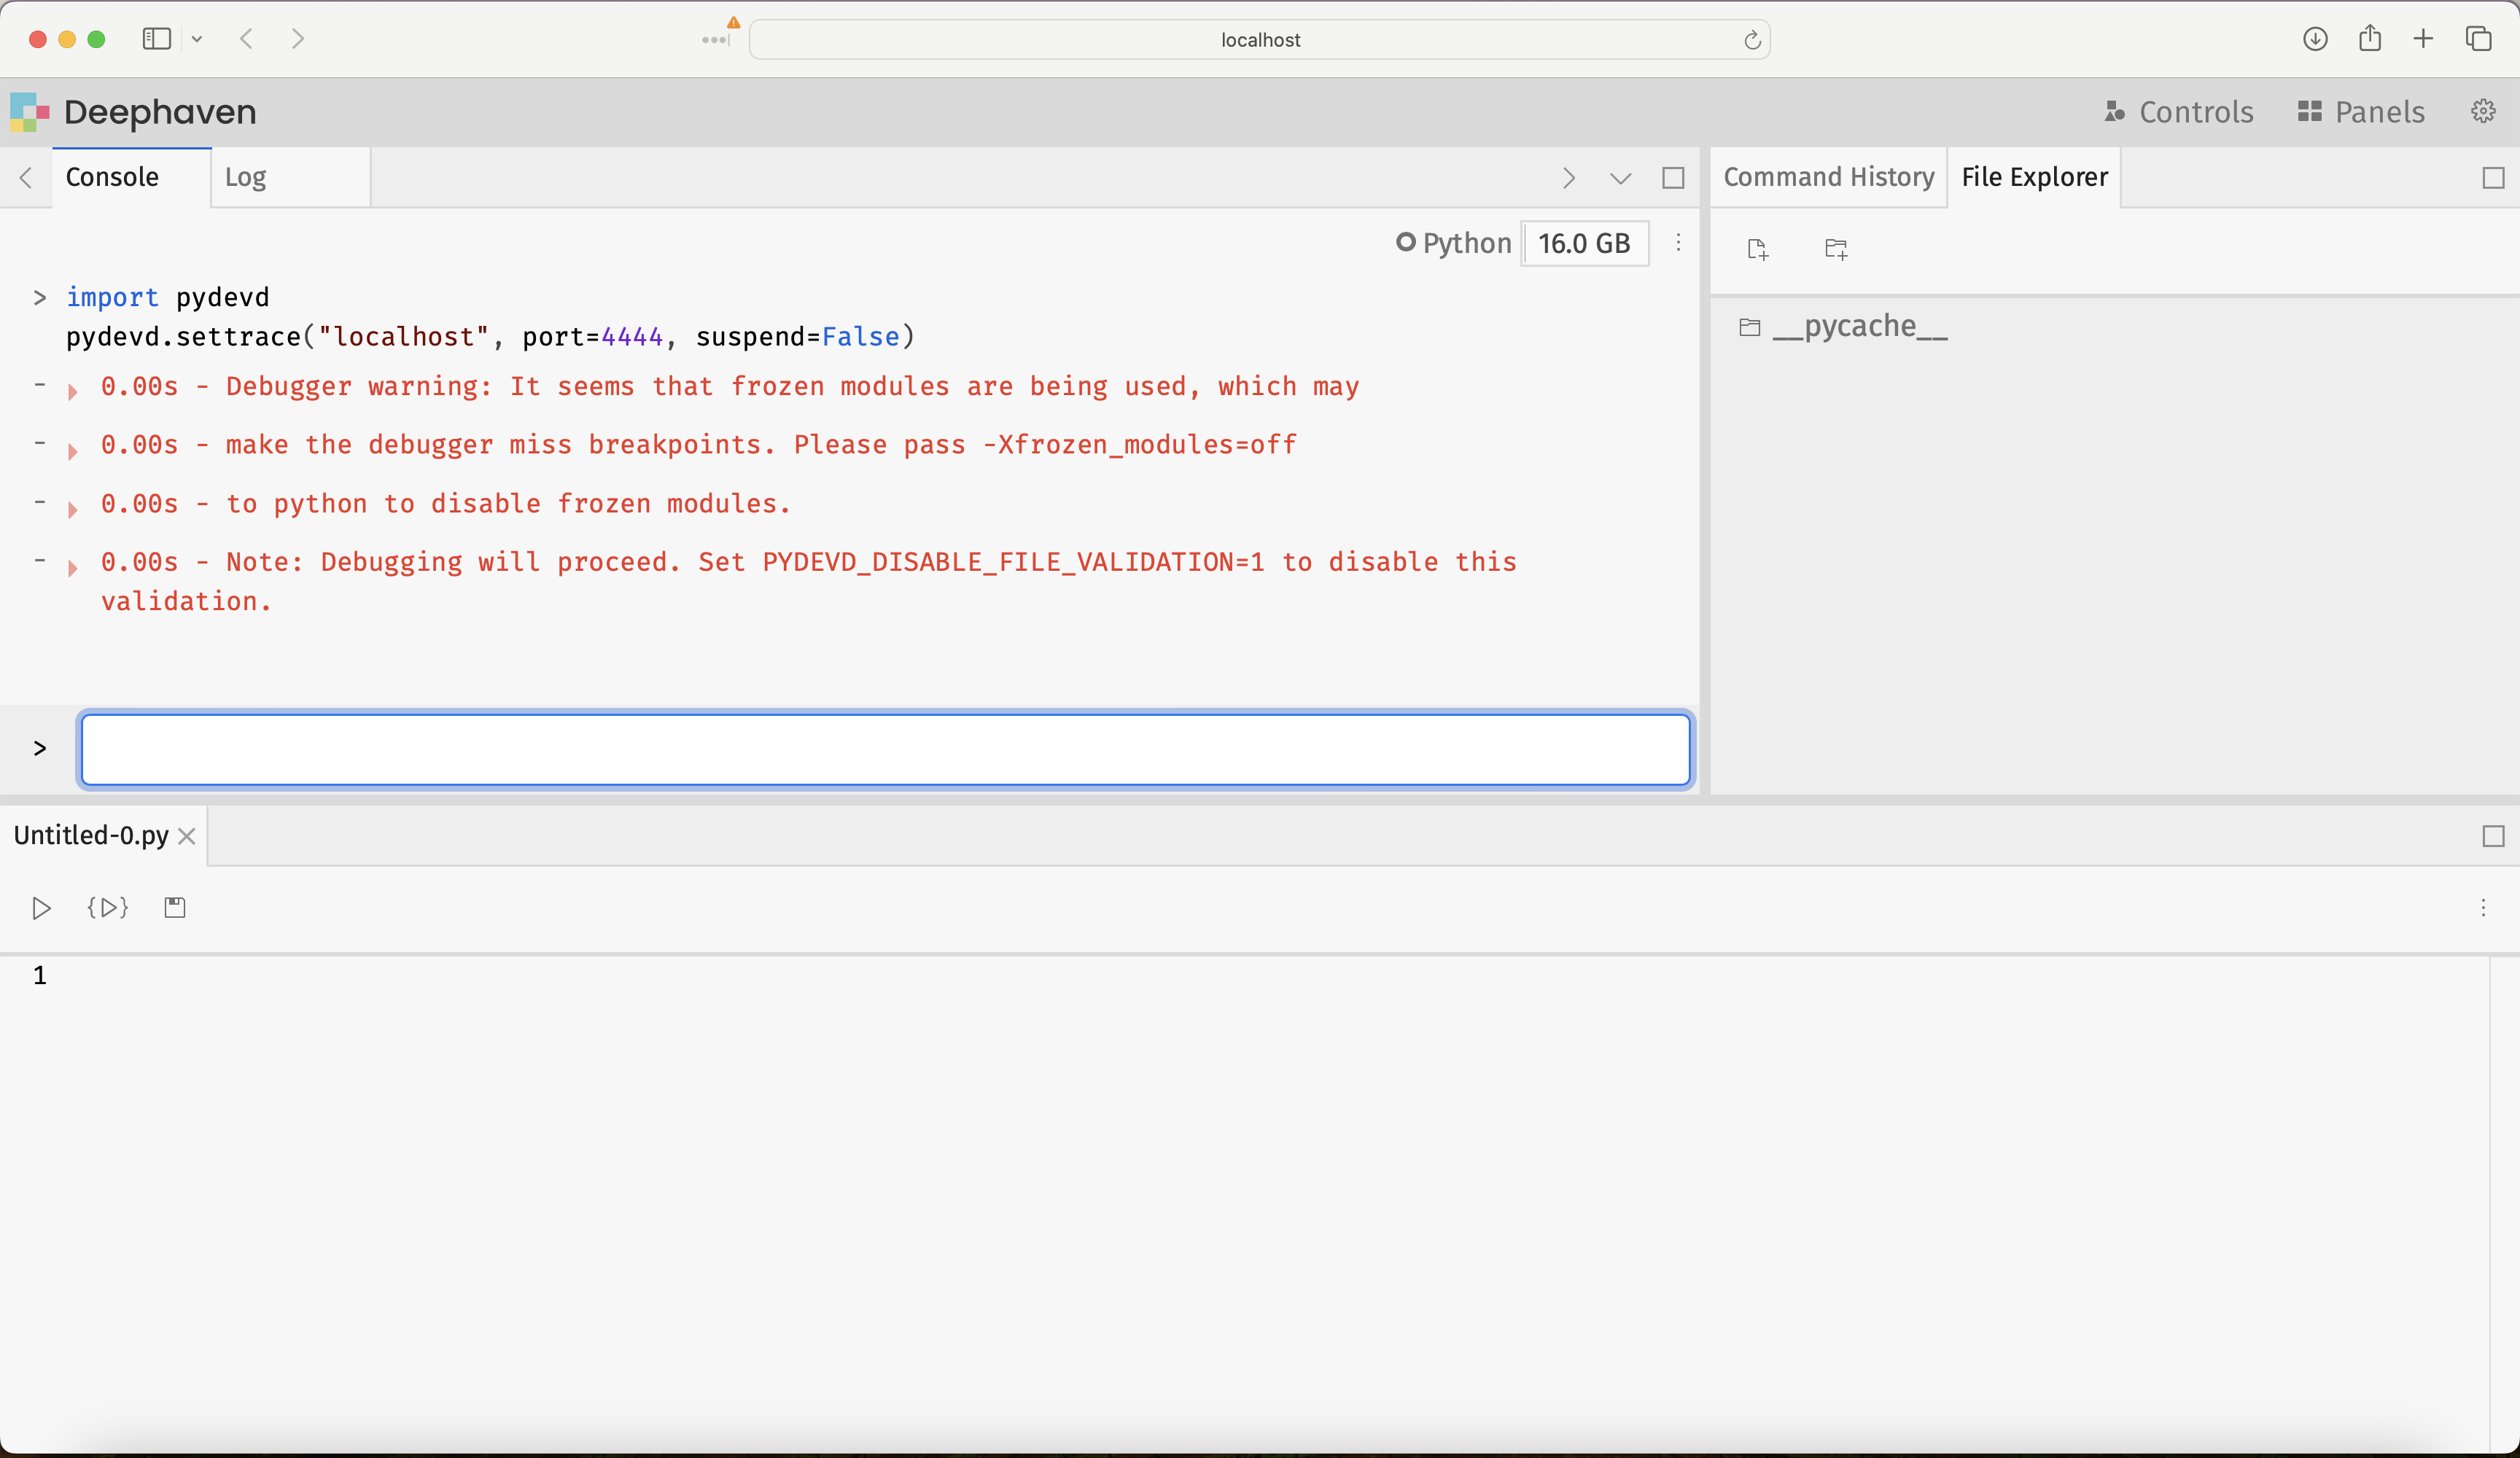
To attach the debugger, navigate to the Deephaven IDE and execute the following commands in the console:
This will produce some output, indicating that Deephaven is connected to the debugger:
Navigate back to PyCharm and verify that Deephaven is connected by finding this new line of output in the debugging console:
The debugger is ready to be used!
5. Use the PyCharm debugger
Once connected, you can use the PyCharm debugger in two ways:
- Set breakpoints in PyCharm: Click in the left margin of your code editor to set breakpoints on any line.
- Use
pydevd.settrace()in code: Call this function to programmatically pause execution at that point.
After the initial connection (step 4), you no longer need to pass parameters to settrace. Here's an example using it as a breakpoint:
Navigating over to PyCharm, the debugger's full suite of capabilities is on offer. It can assist in stepping through Deephaven source code, setting breakpoints to halt execution, inspecting variables and intermediate values from deep within function calls, and much more. Many resources are available online for using PyCharm's debugger, and this Jetbrains guide is a good starting point.
There are some Deephaven-specific things to consider when debugging. Check out Common problems for issues specific to debugging Deephaven's table operations and ticking tables.
Troubleshooting
Virtual environment not activated
Problem: Commands like deephaven server or imports fail with "command not found" or "module not found" errors.
Solutions:
- Verify the virtual environment is activated: look for
(dh-venv)in your terminal prompt. - Activate the environment:
source dh-venv/bin/activate(on macOS/Linux) ordh-venv\Scripts\activate(on Windows). - Verify Deephaven is installed:
pip list | grep deephaven.
IDE not using correct interpreter
Problem: Debugger fails to start or can't find Deephaven modules.
Solutions:
- Verify the IDE is configured to use the
dh-venvPython interpreter. - In PyCharm: Check the interpreter selector in the bottom-right corner.
- In VS Code: Check the interpreter selector in the bottom-left status bar.
- Restart the IDE after changing the interpreter.
Debugger won't connect (remote debugging)
Problem: pydevd.settrace() fails with connection error when using Deephaven IDE approach.
Solutions:
- Verify the PyCharm debug server is running (green bug icon should be active).
- Check that port 4444 is not blocked by a firewall.
- Ensure the port in
settracematches the PyCharm configuration. - Verify both the Deephaven server and PyCharm are using the same
dh-venvenvironment.
Version compatibility issues
Problem: Debugger behaves unexpectedly, shows errors, or features don't work.
Solutions:
- Verify PyCharm version is 2024 or higher (earlier versions have known compatibility issues).
- For VS Code, verify version 1.94 or higher.
- Check that
pydevdversion is compatible with your IDE version.- Run
pip show pydevdto check installed version. - PyCharm may suggest a specific version in the debug server configuration.
- Run
- If versions mismatch, reinstall
pydevdwith the version your IDE recommends.