Debug built-from-source Deephaven with PyCharm
When building Deephaven from source code for development tasks, you can debug both your own code and Deephaven's internal source code. This is particularly useful for:
- Contributing to Deephaven development.
- Understanding how Deephaven works internally.
- Debugging issues that require stepping through Deephaven's source.
- Testing changes to Deephaven itself.
This guide walks through setting up PyCharm Professional's remote debugging server for source-built Deephaven.
Warning
Debugging Deephaven with PyCharm has only been shown to work for PyCharm major version 2024 or higher. Some issues have been discovered with using PyCharm 2023, and there is no plan to fix these issues.
Note
PyCharm Professional is a paid product with remote debugging capabilities.
Setup
This guide assumes that Deephaven is built using the steps in the guide on building Deephaven from source. Following these steps produces a local clone of Deephaven Core in a directory called deephaven-core, and a Python virtual environment for the Deephaven installation. This guide will assume that virtual environment is called source-dh-venv.
1. Install pydevd
First, install the pydevd Python package into the source-dh-venv virtual environment using pip:
It's critical that this is installed into the same virtual environment as the source build of Deephaven. The debugger will not work properly if this is not the case.
2. Create PyCharm project
To debug Deephaven from PyCharm, create a PyCharm project from the source code clone that the server will be run from. This PyCharm project must be based on the same code used to build and run the server.
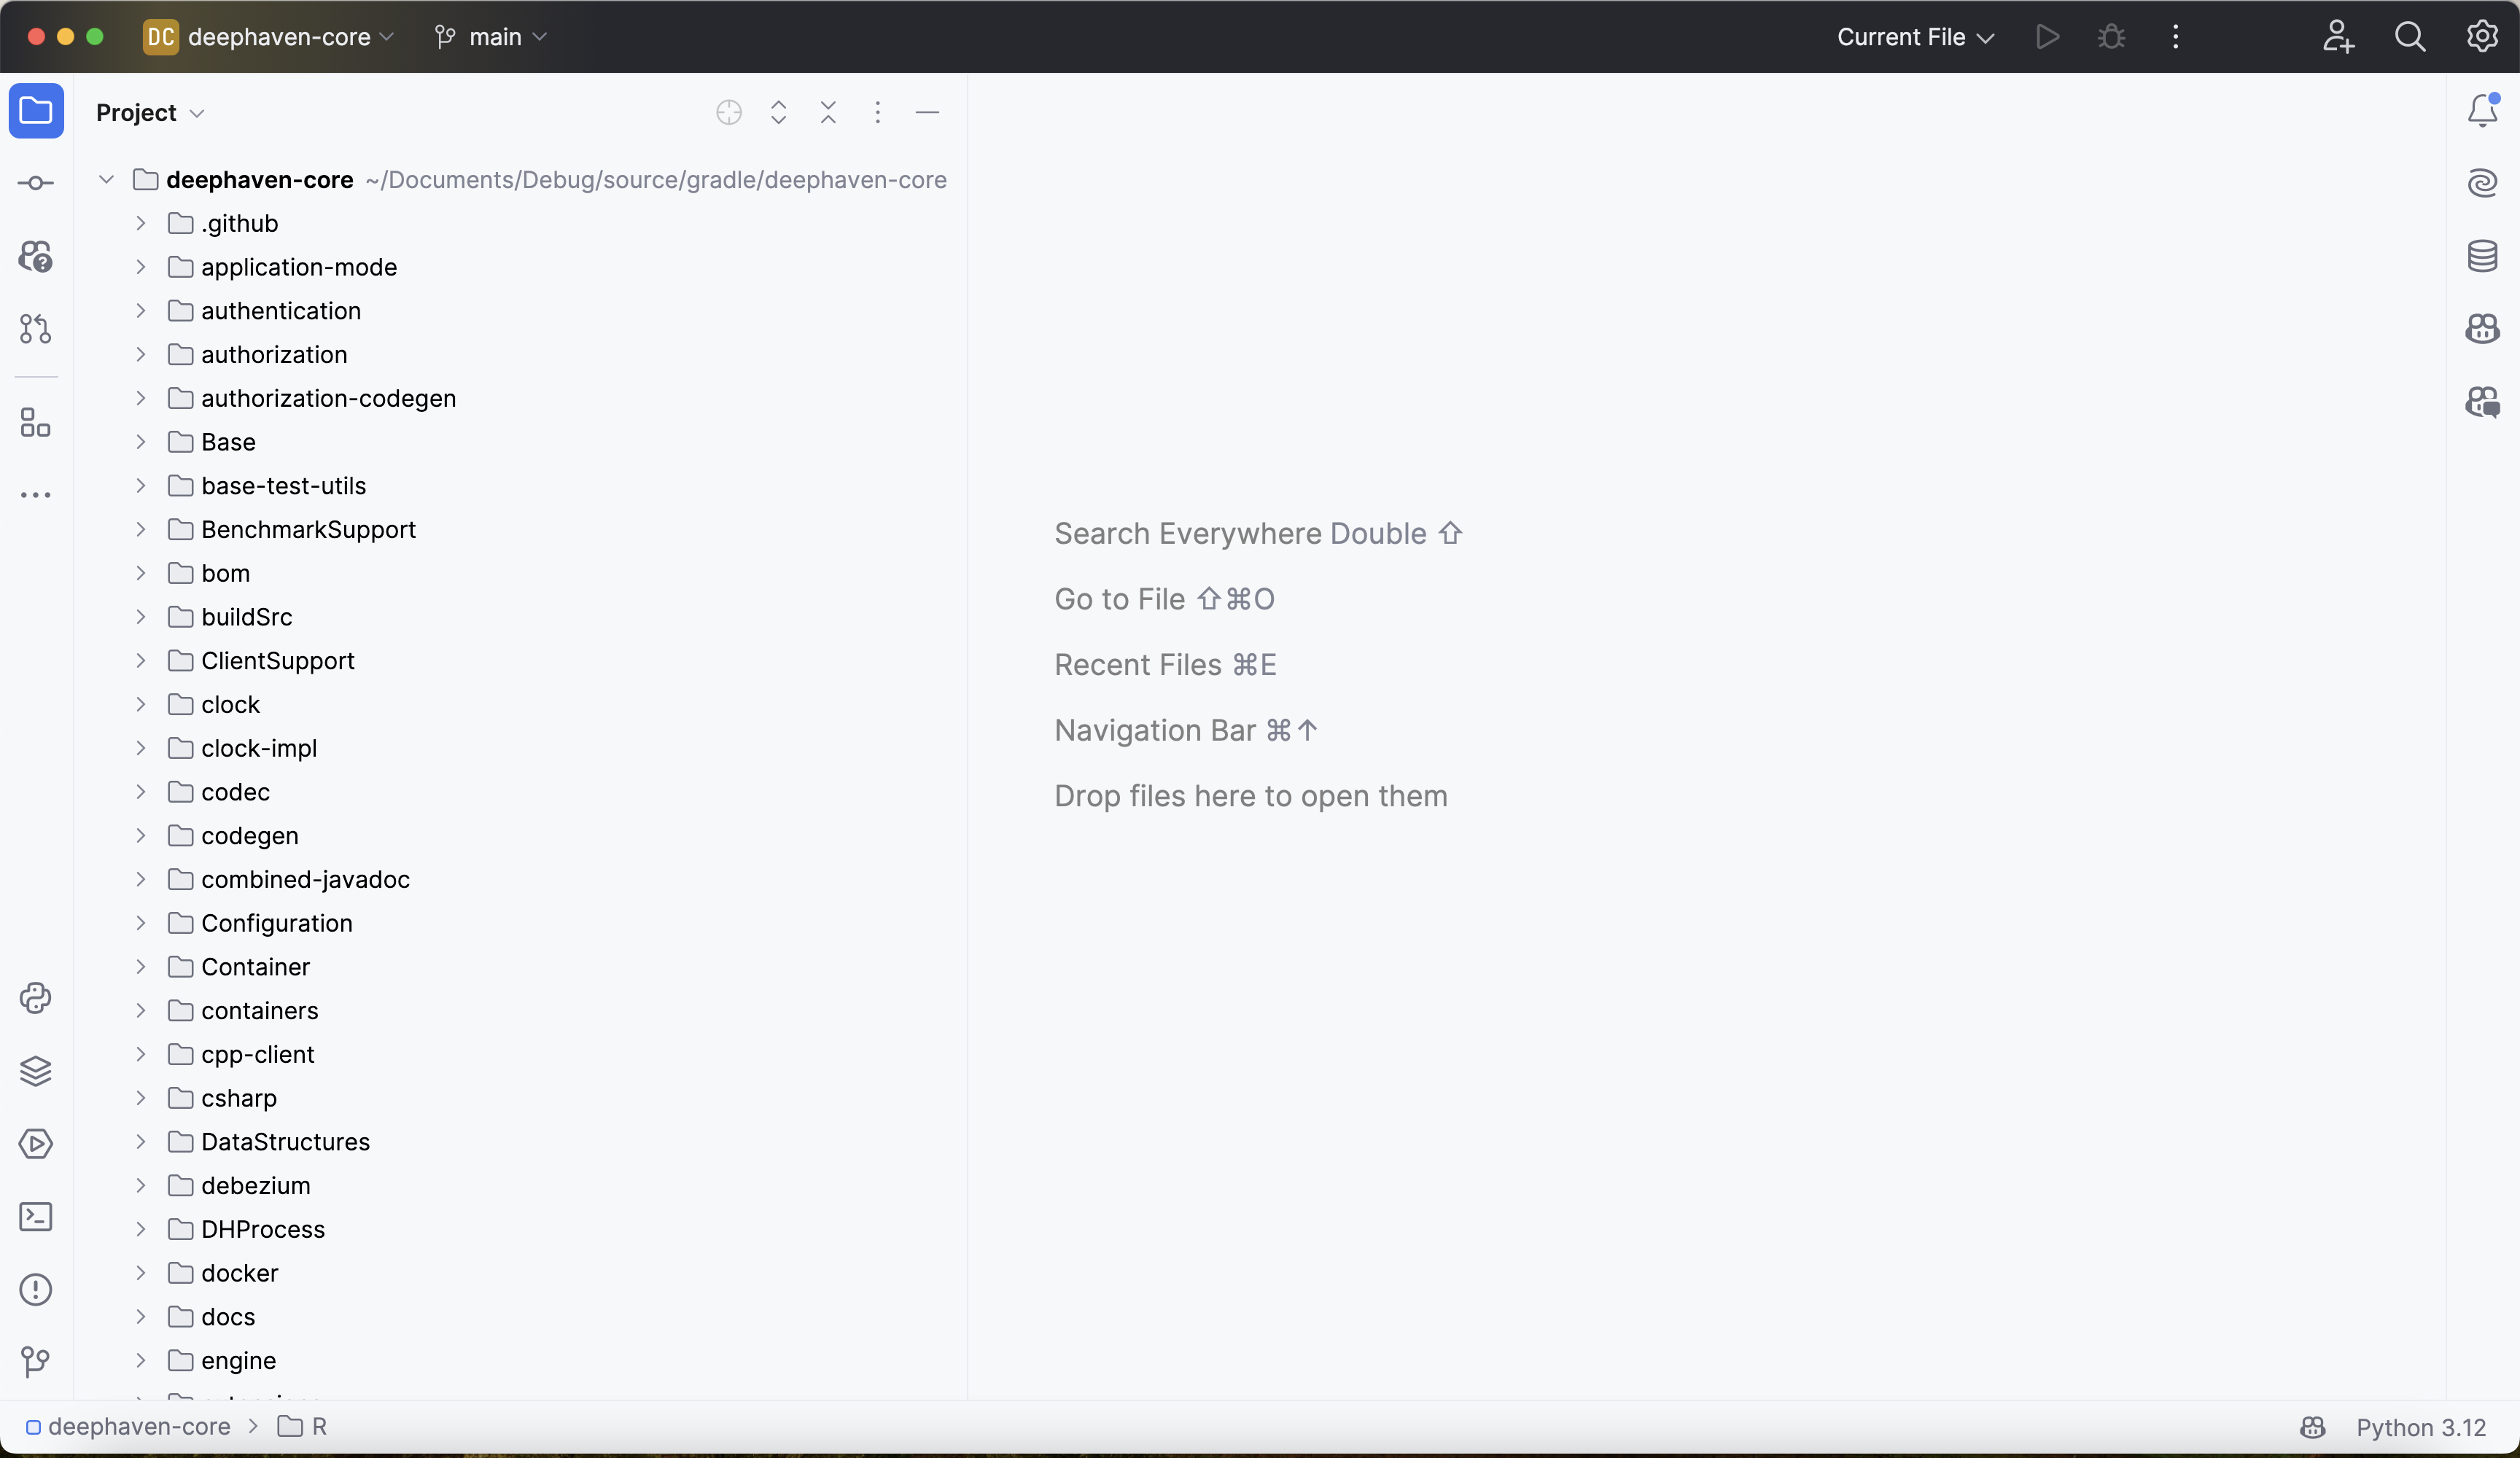
From PyCharm's launch window, click Open and navigate to the deephaven-core directory. The new project should look like this:
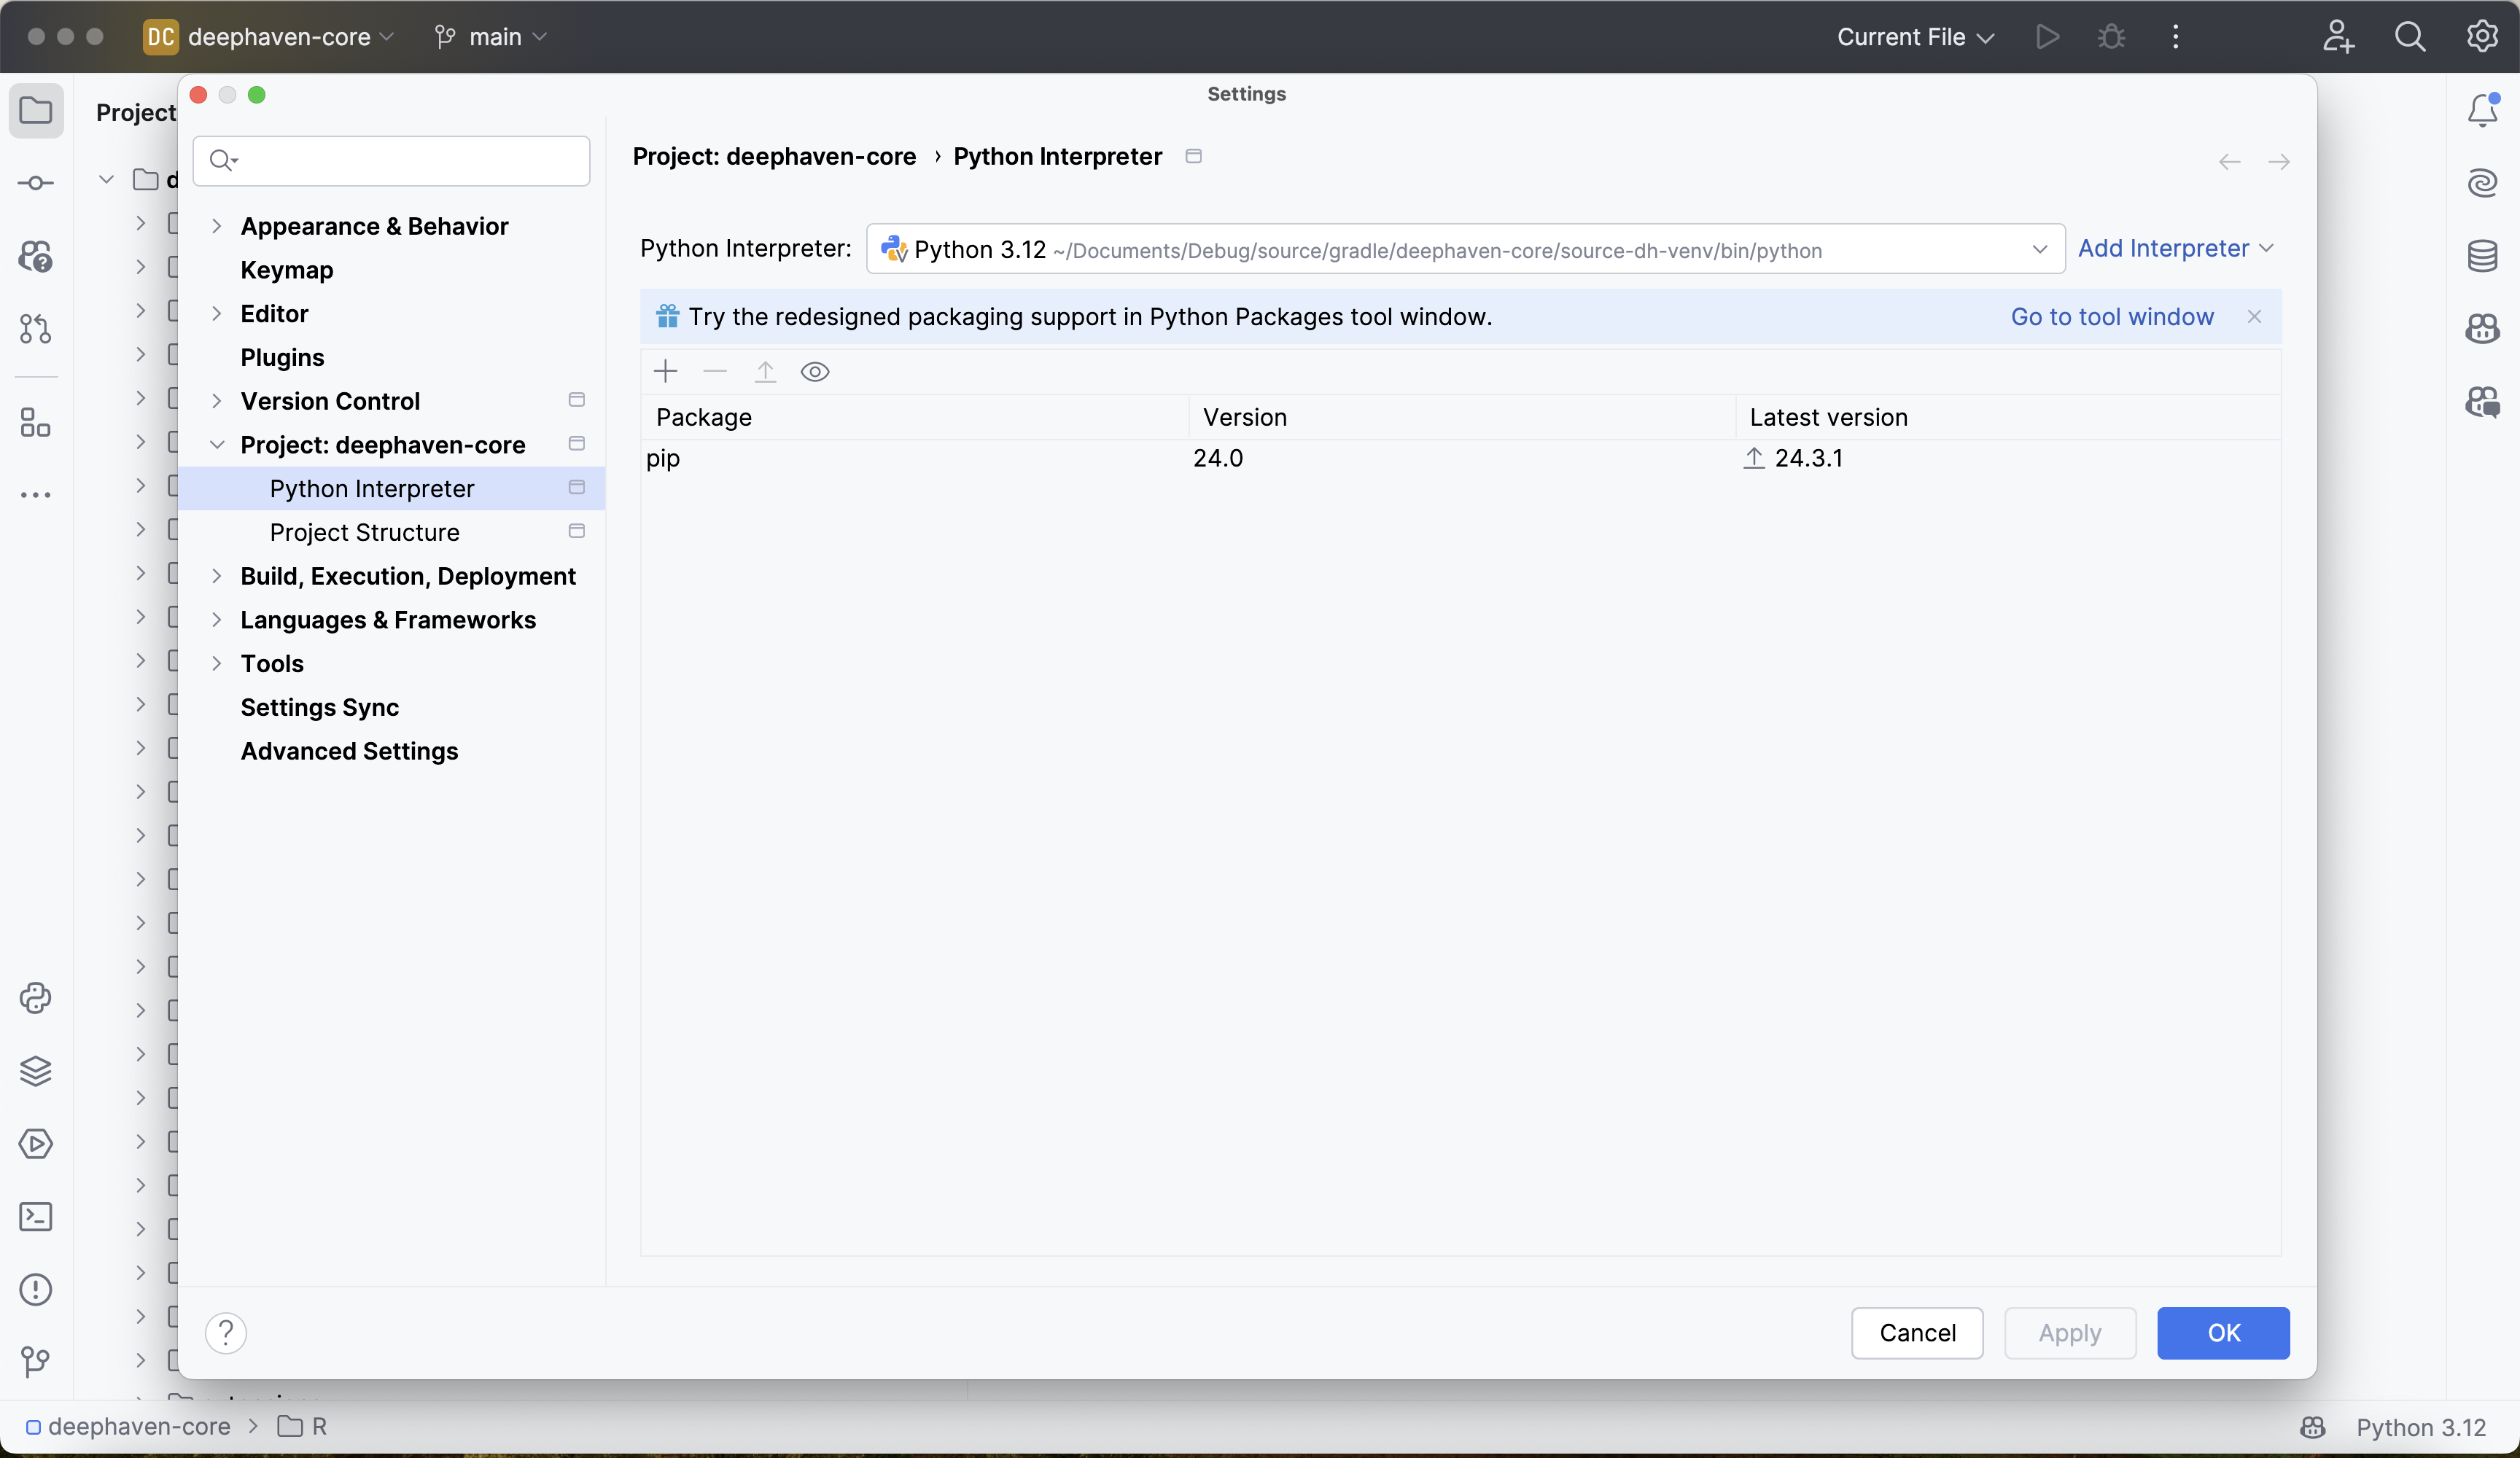
PyCharm should automatically set the project interpreter to be the virtual environment created in step 1. Confirm this by going to PyCharm > Settings > Project: deephaven-core > Python Interpreter. Verify that the path selected matches the path of source-dh-venv:
3. Configure debugger
Next, create a remote debugging server from PyCharm.
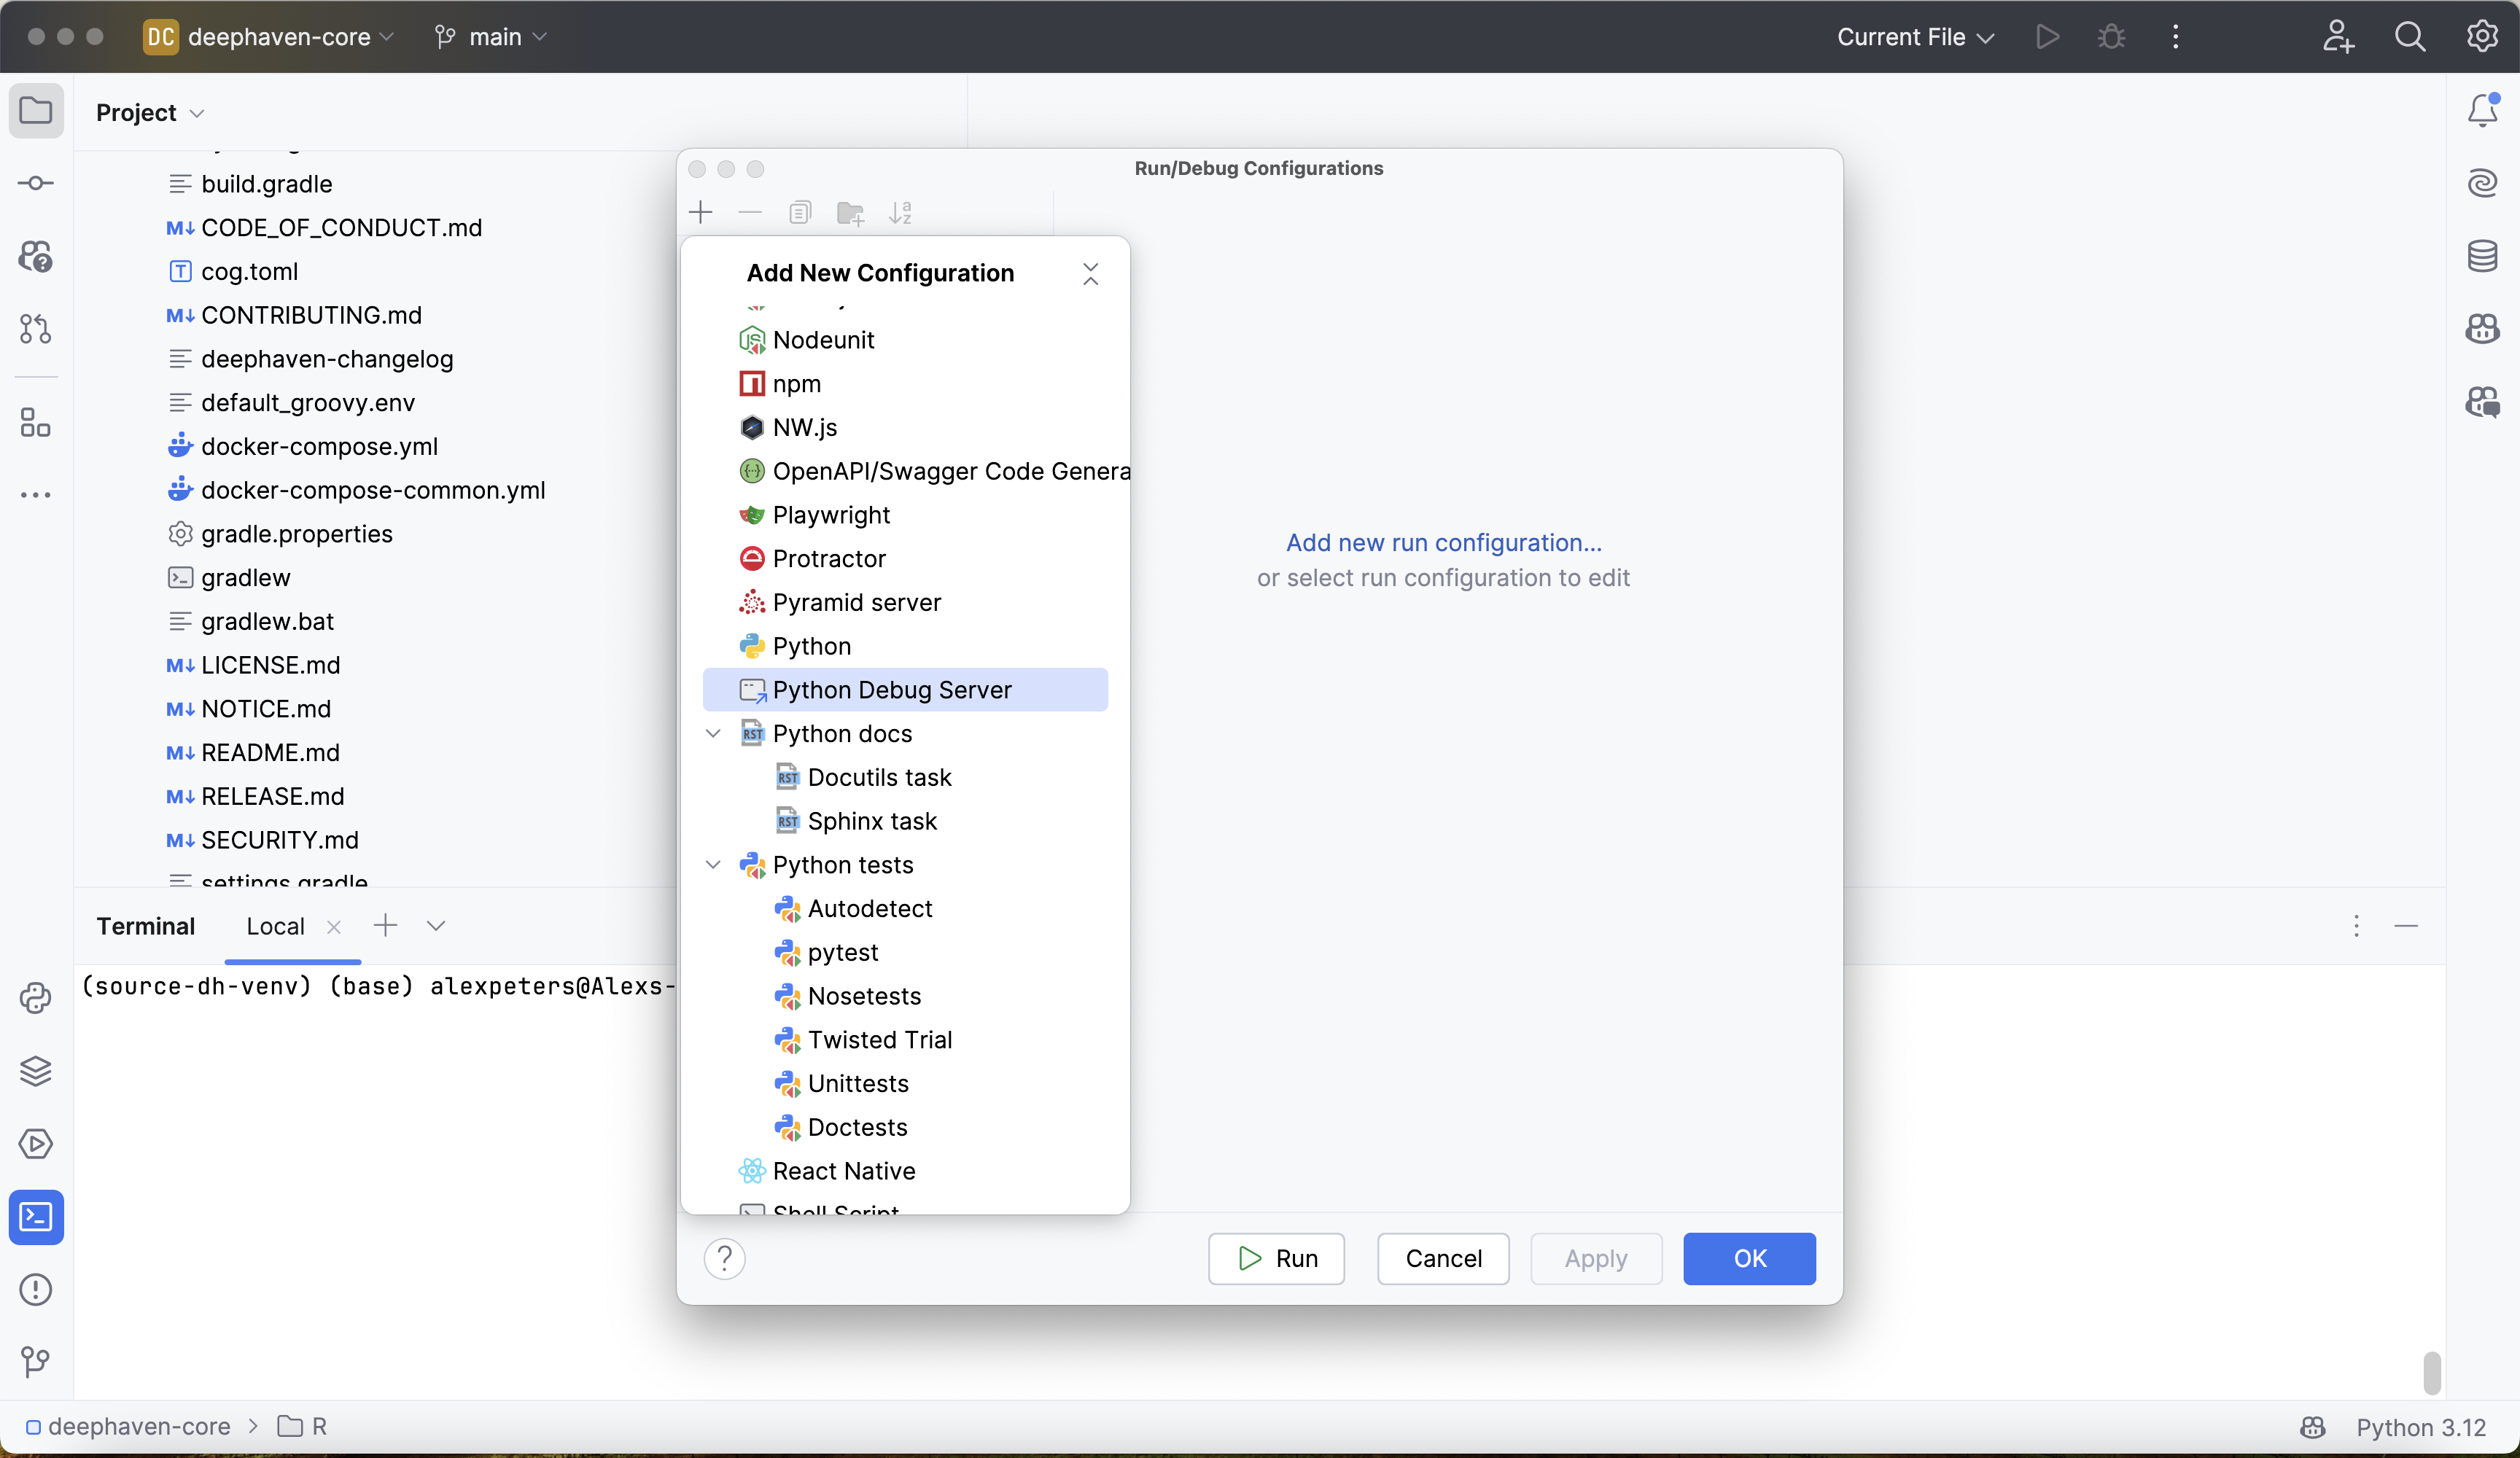
Go to Run > Edit Configurations, which opens up the Run/Debug Configurations window. Click on + in the top left corner to add a new configuration. This will bring up a list of configuration types to select. Scroll down and select the Python Debug Server configuration option:
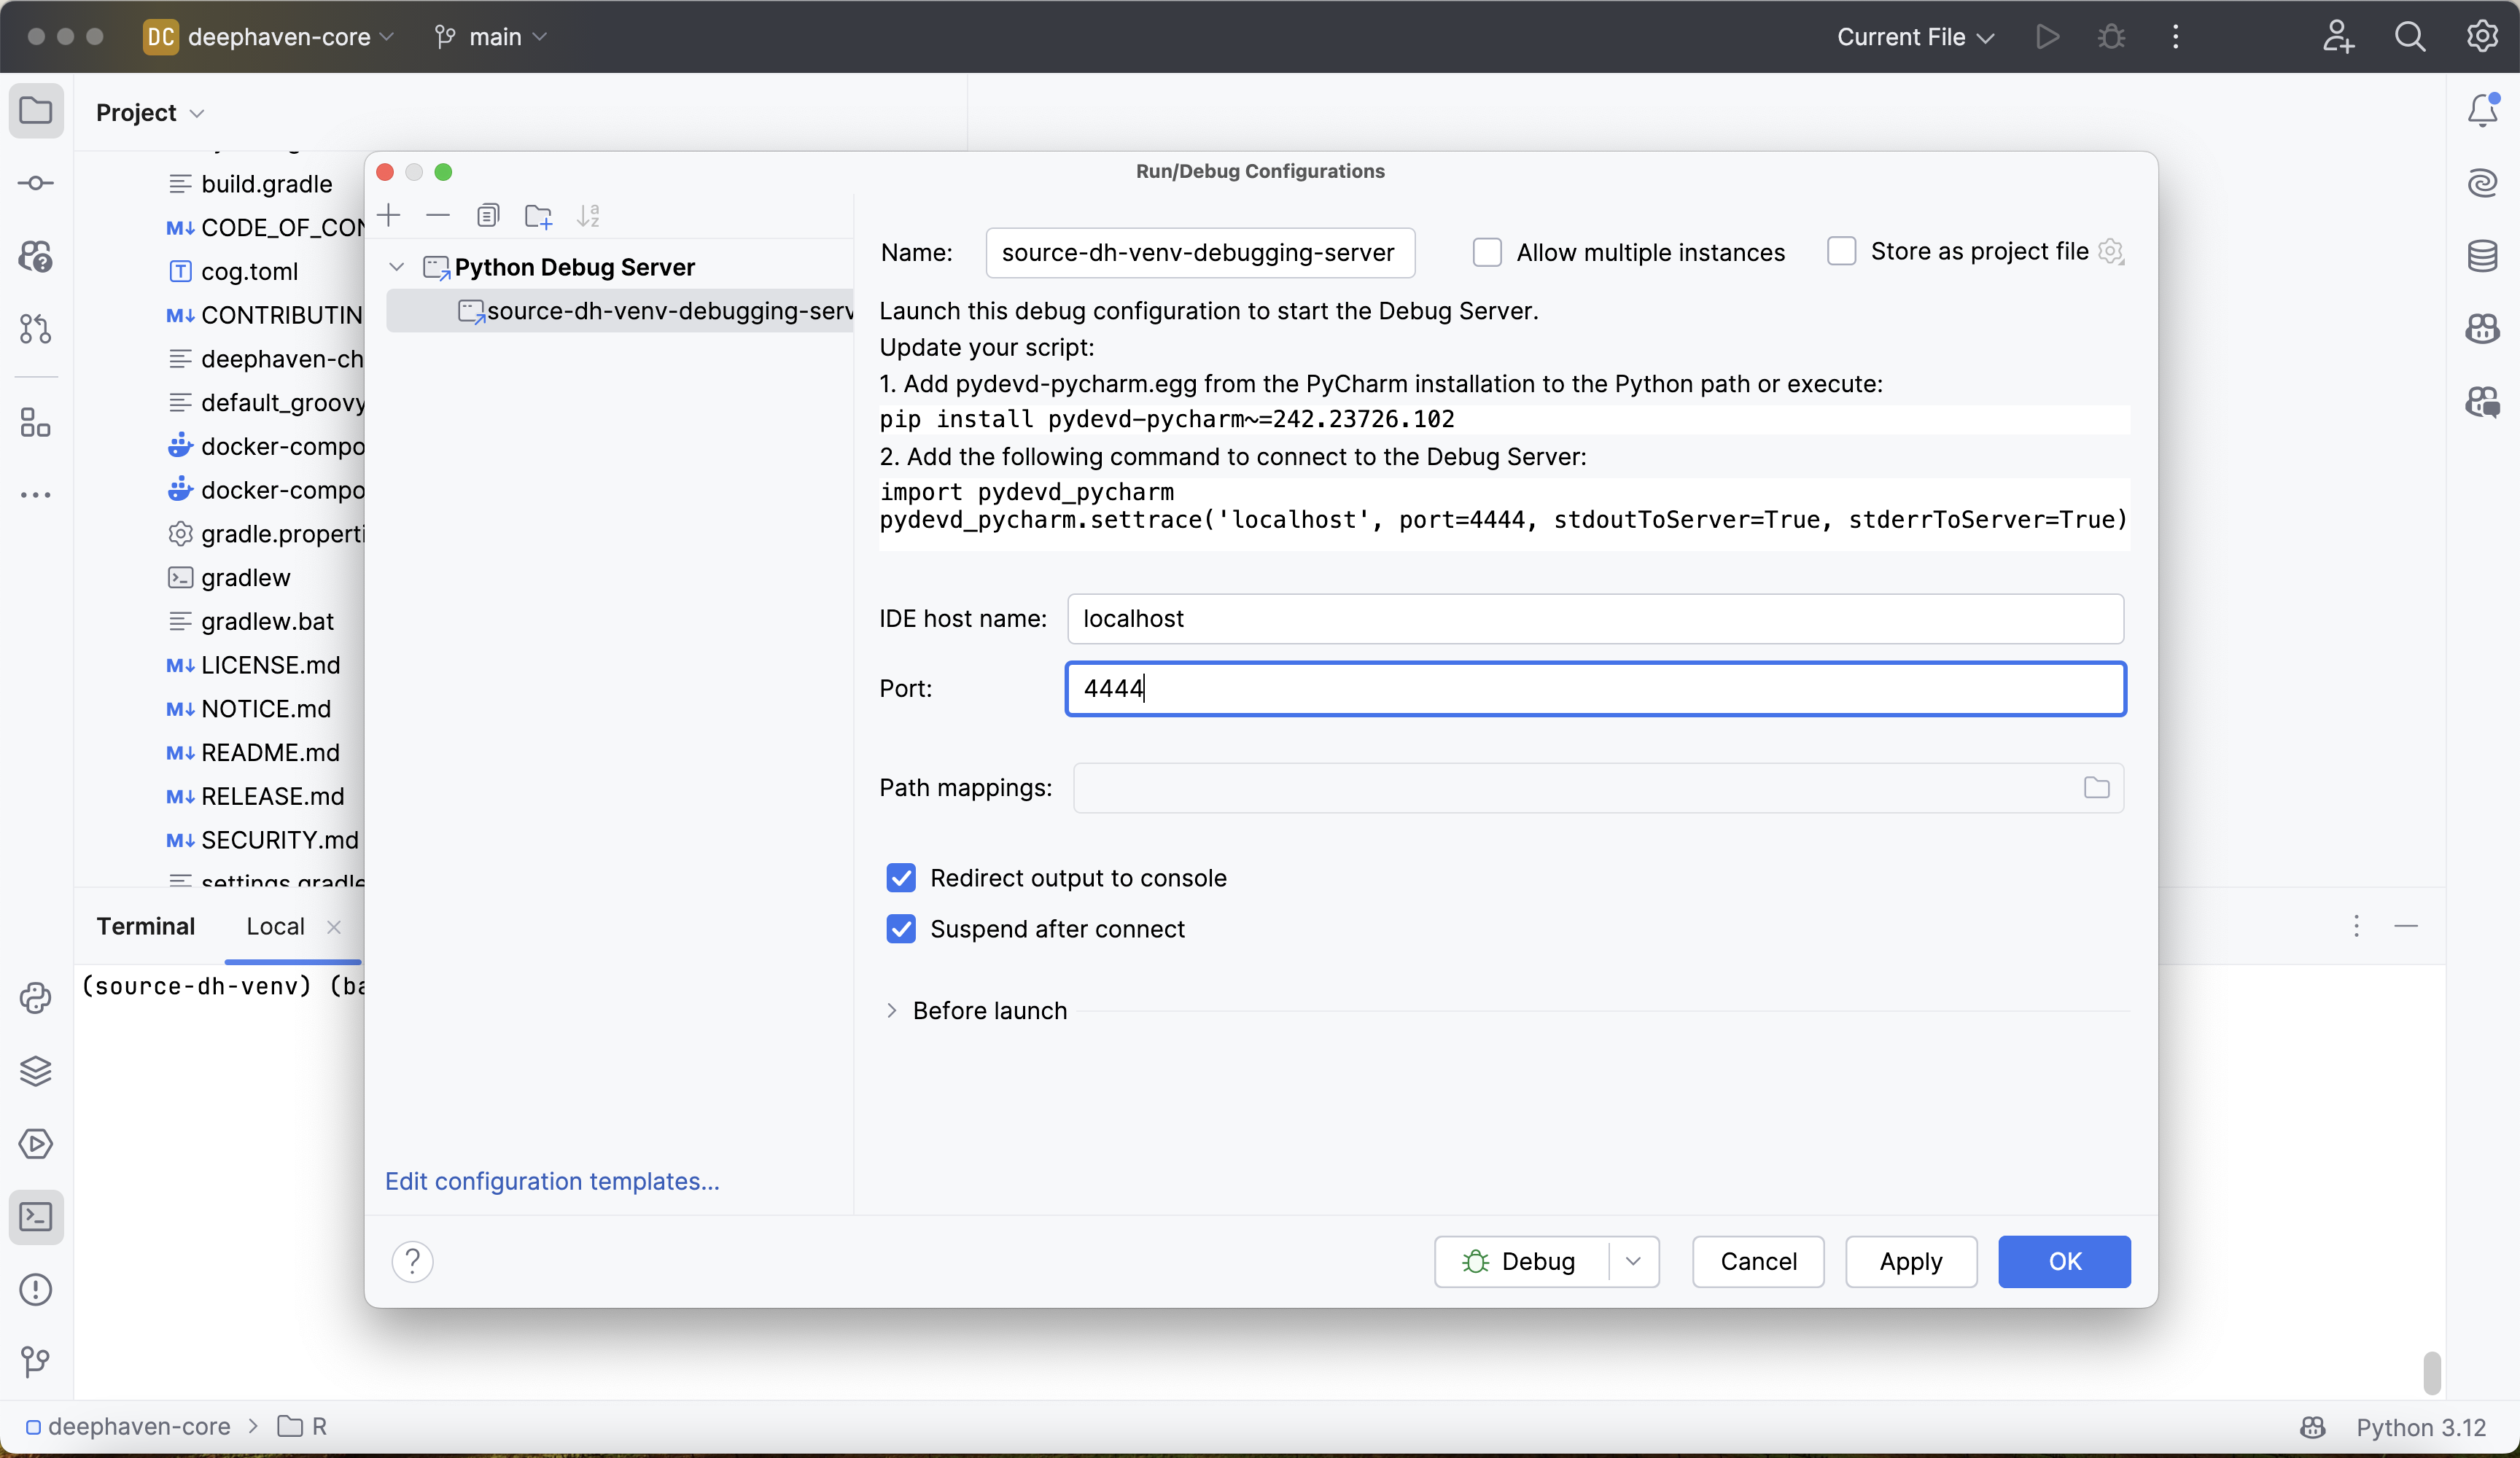
Give the configuration a reasonable, memorable name. The virtual environment is named source-dh-venv, so the configuration will be named source-dh-venv-debugging-server.
Next, set the IDE host name. Since the Deephaven server is going to be running locally, the hostname is localhost.
Finally, choose a port for the debug server to run on. Note that this is not the same as the port that the Deephaven server runs on, which is port 10000 by default. Any unused port will work for this - we will use port 4444.
Click Apply and Ok, and the new debug server will be immediately available for use.
4. Attach debugger to Deephaven
Warning
The Deephaven server must be run with anonymous authentication for this kind of debugging to work. Use the -Panonymous flag when starting the server (shown below).
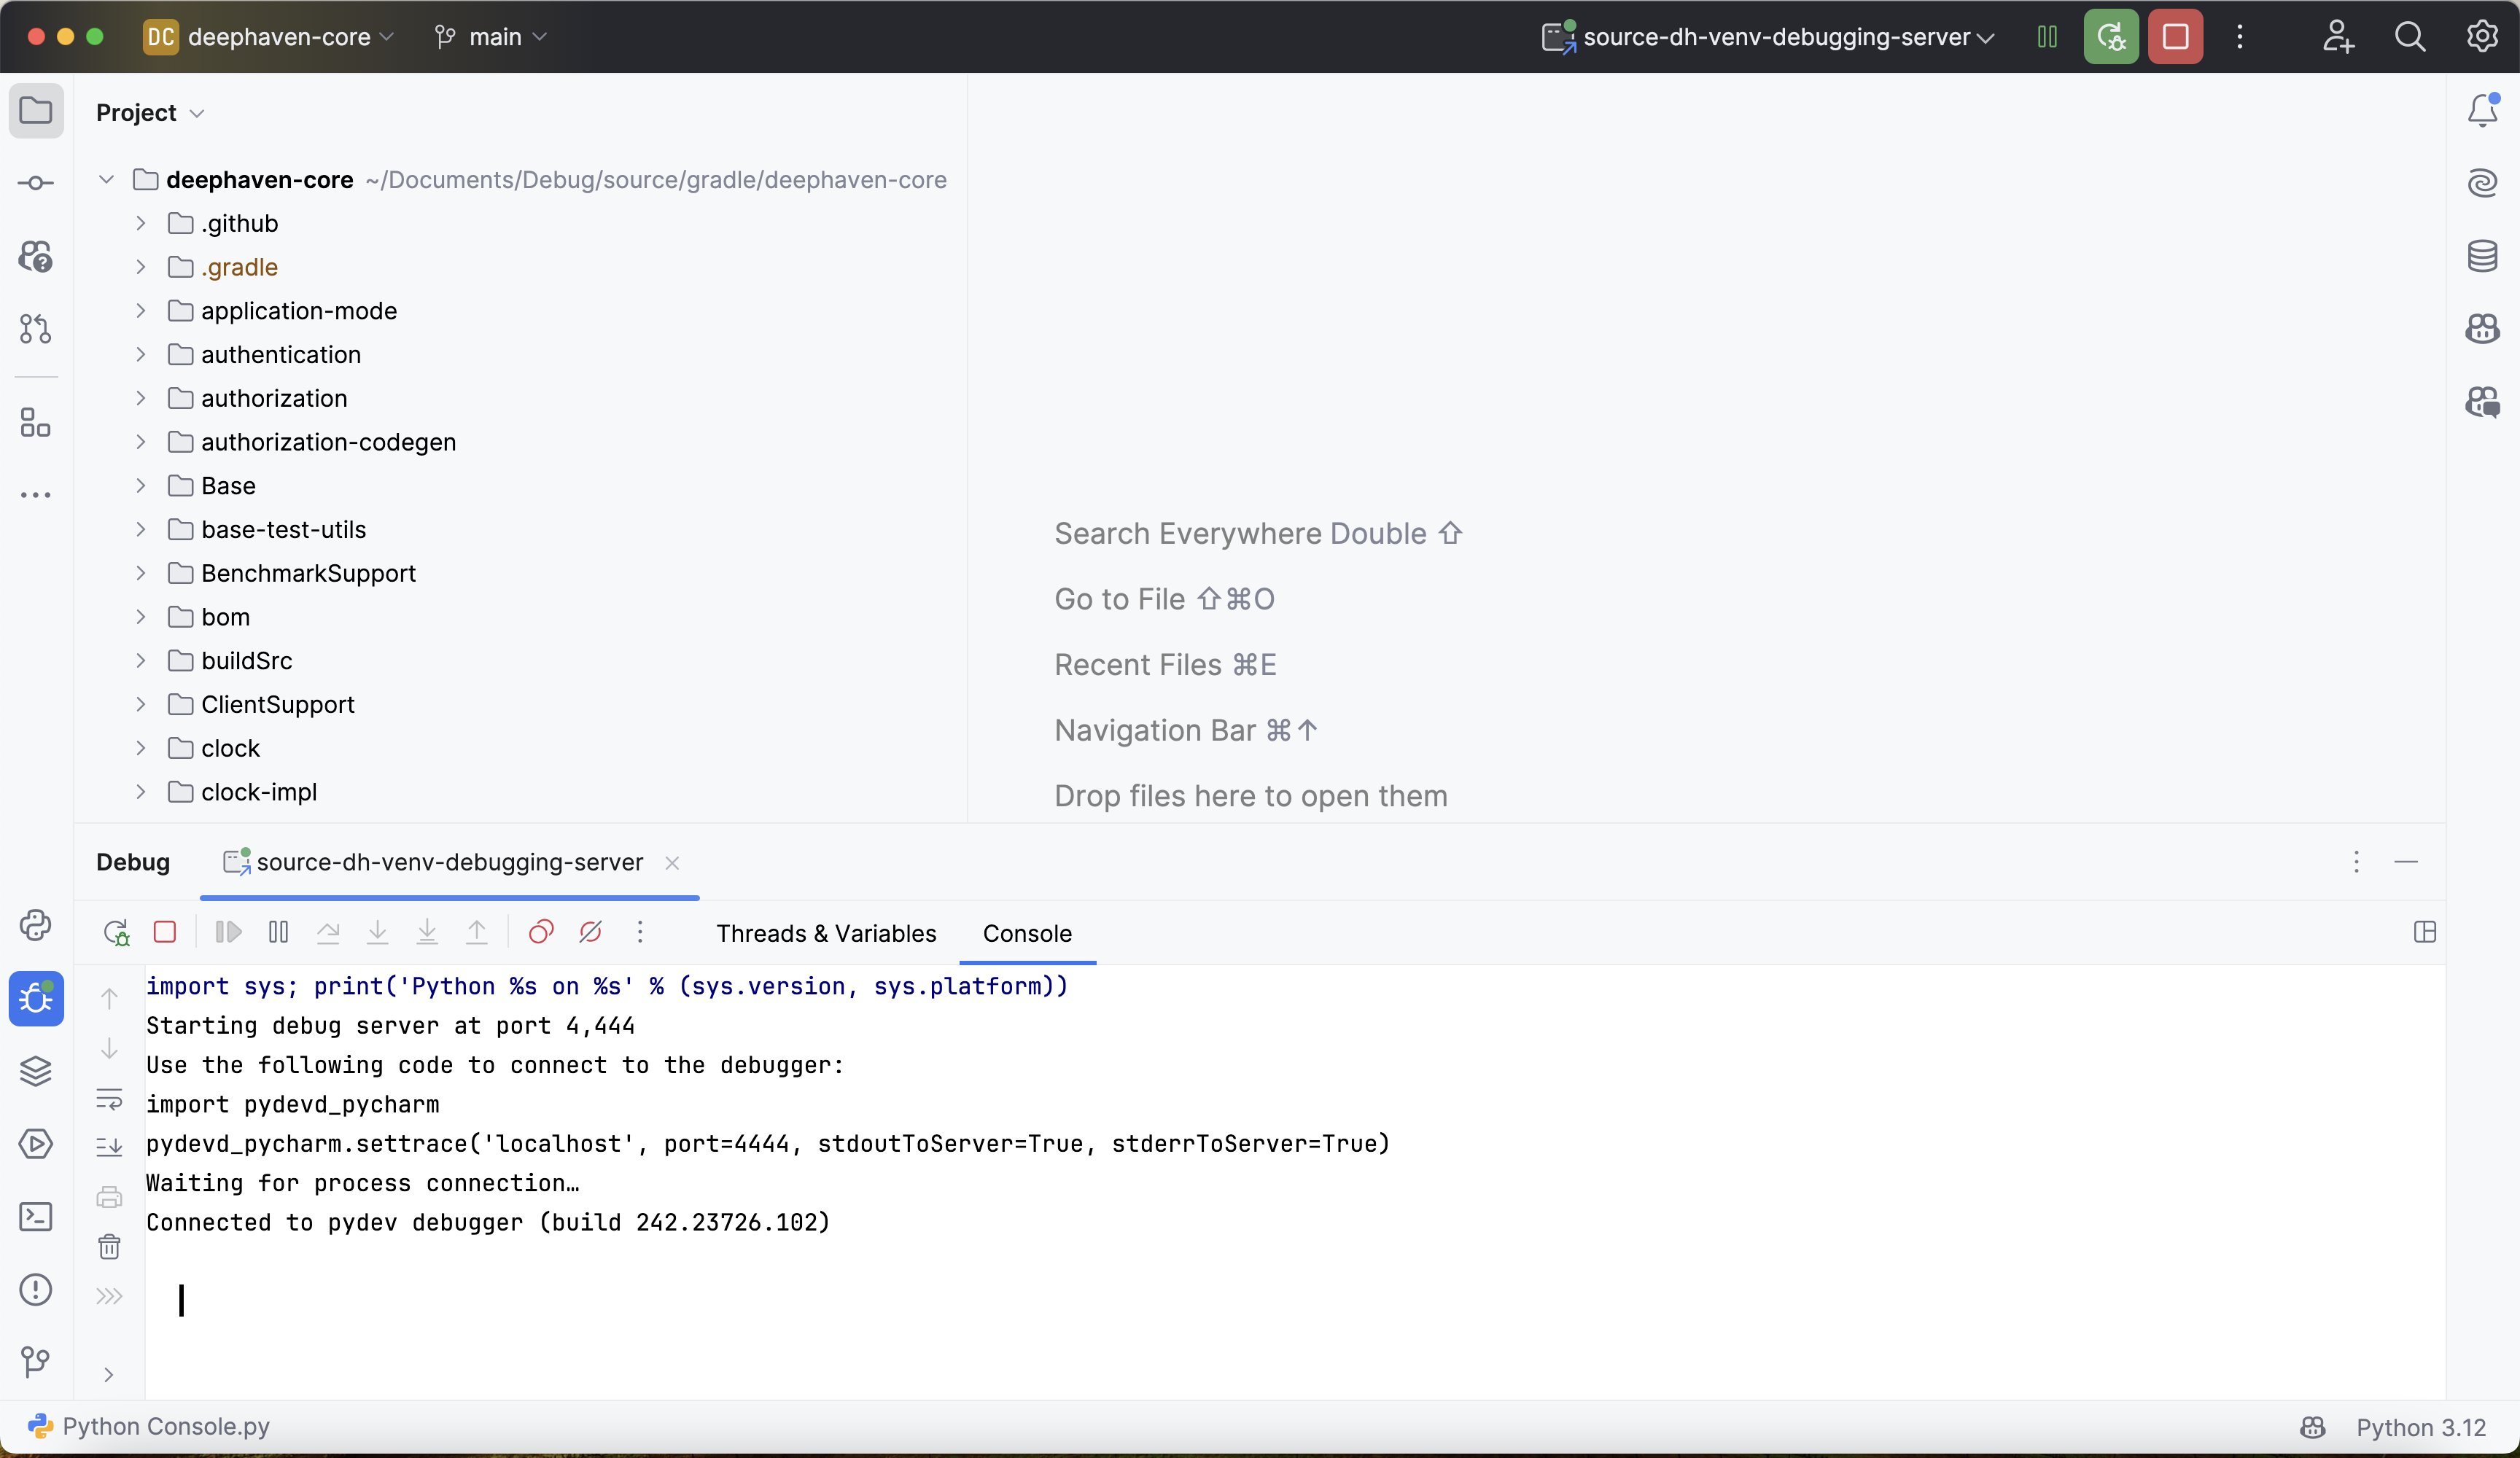
Start the debugger in PyCharm by clicking the small green bug icon in the window's top right corner. This will start the debugger and open a debugging console:
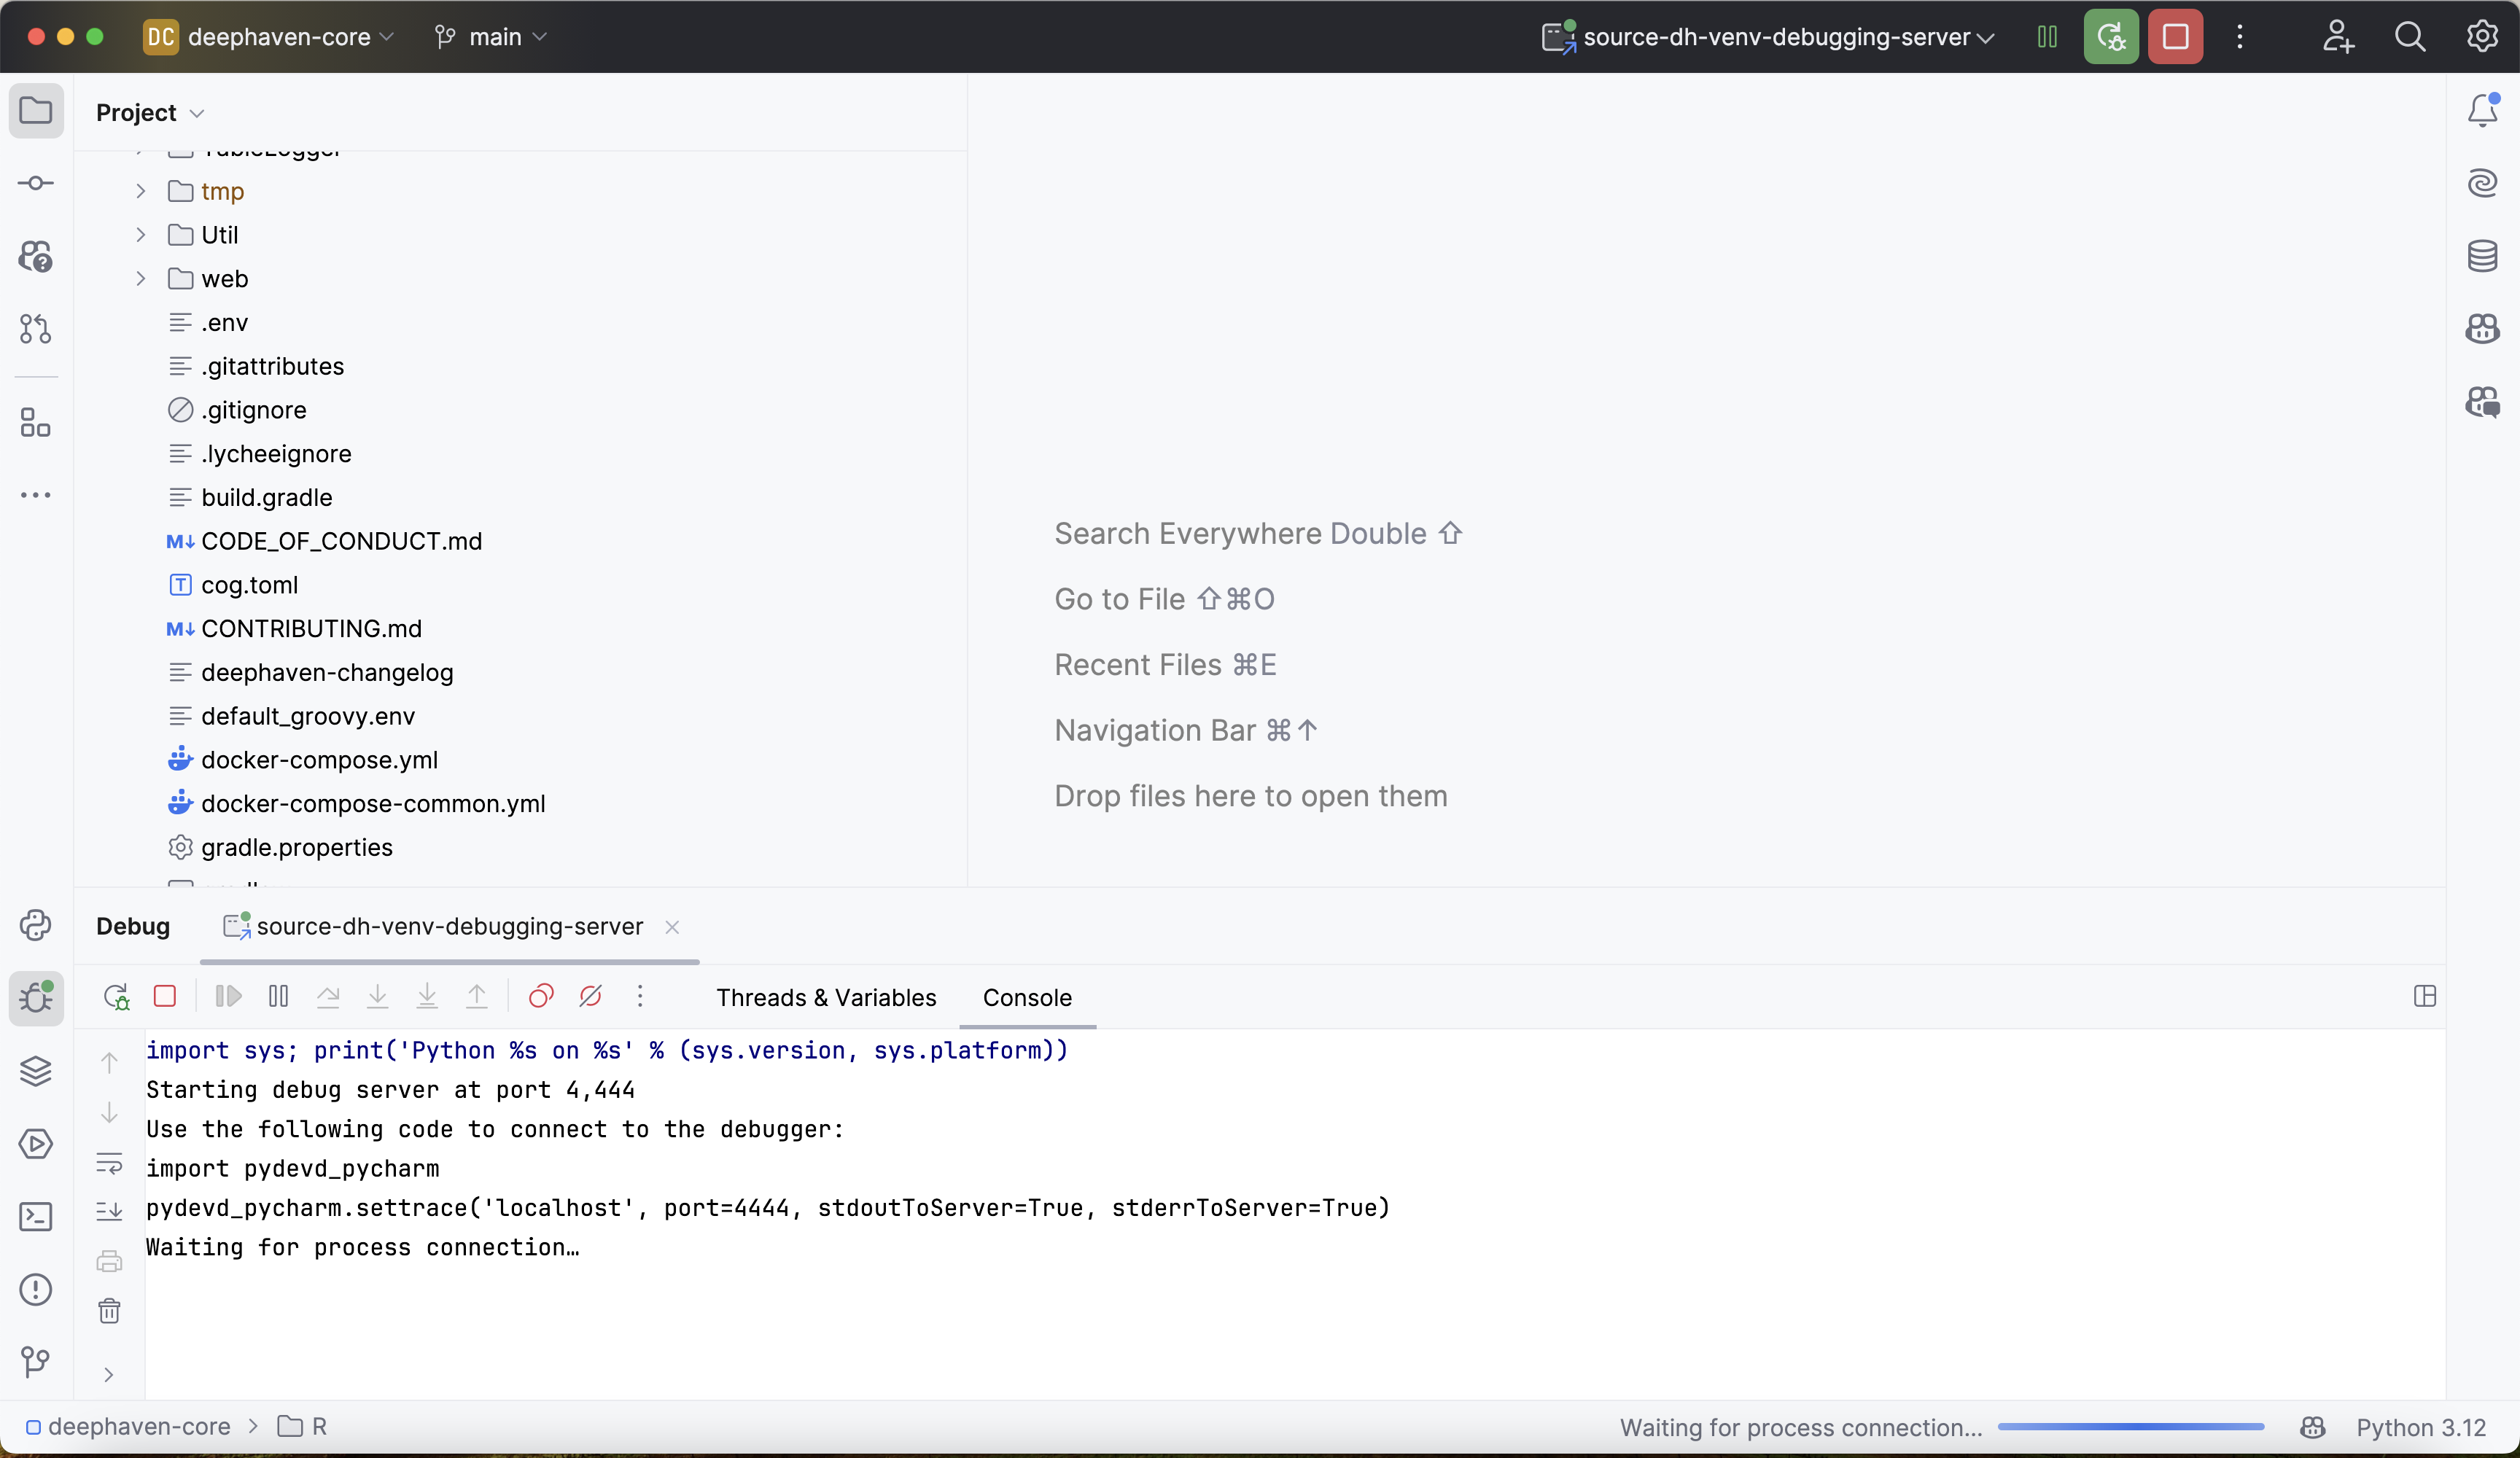
The output above states that the debugger is "waiting for process connection". This means that the debugger is not yet attached to the Deephaven process.
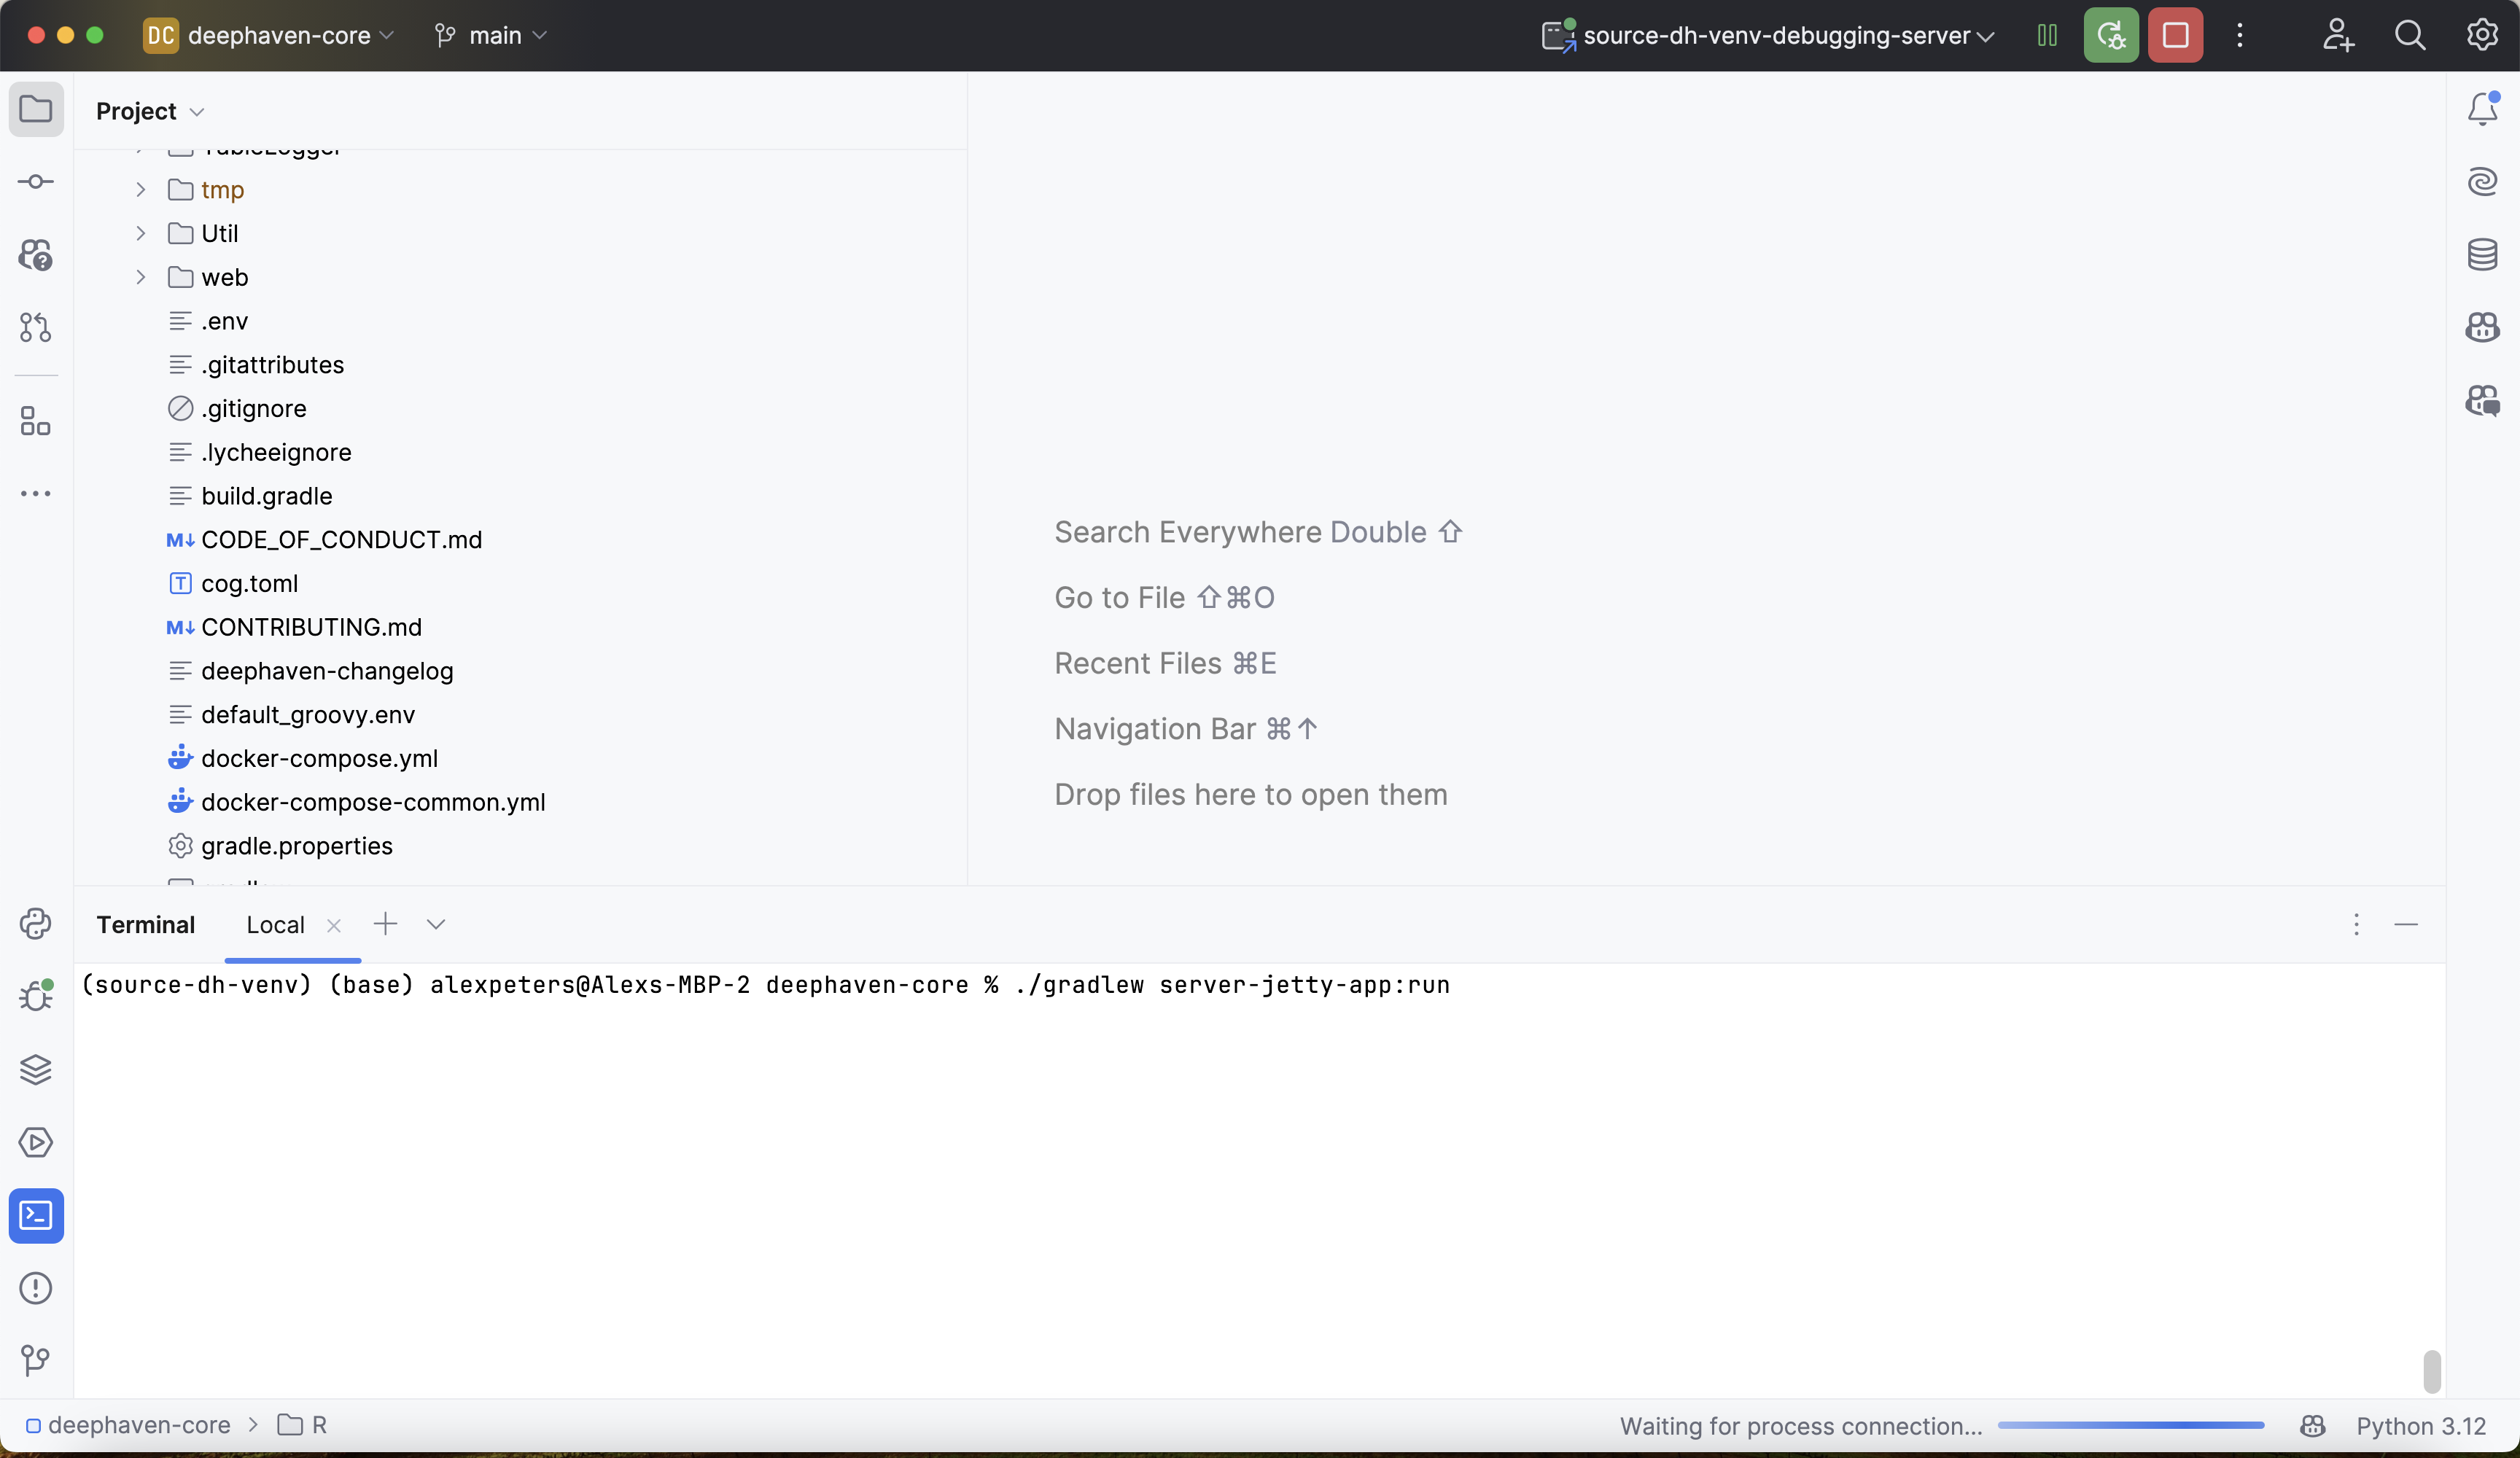
Now, from the same virtual environment that the PyCharm debugger is running in, start the Deephaven server with anonymous authentication. The easiest way to do this is to open up a new terminal in the current PyCharm project and run:
The -Panonymous flag enables anonymous authentication, which is required for the debugger to connect.
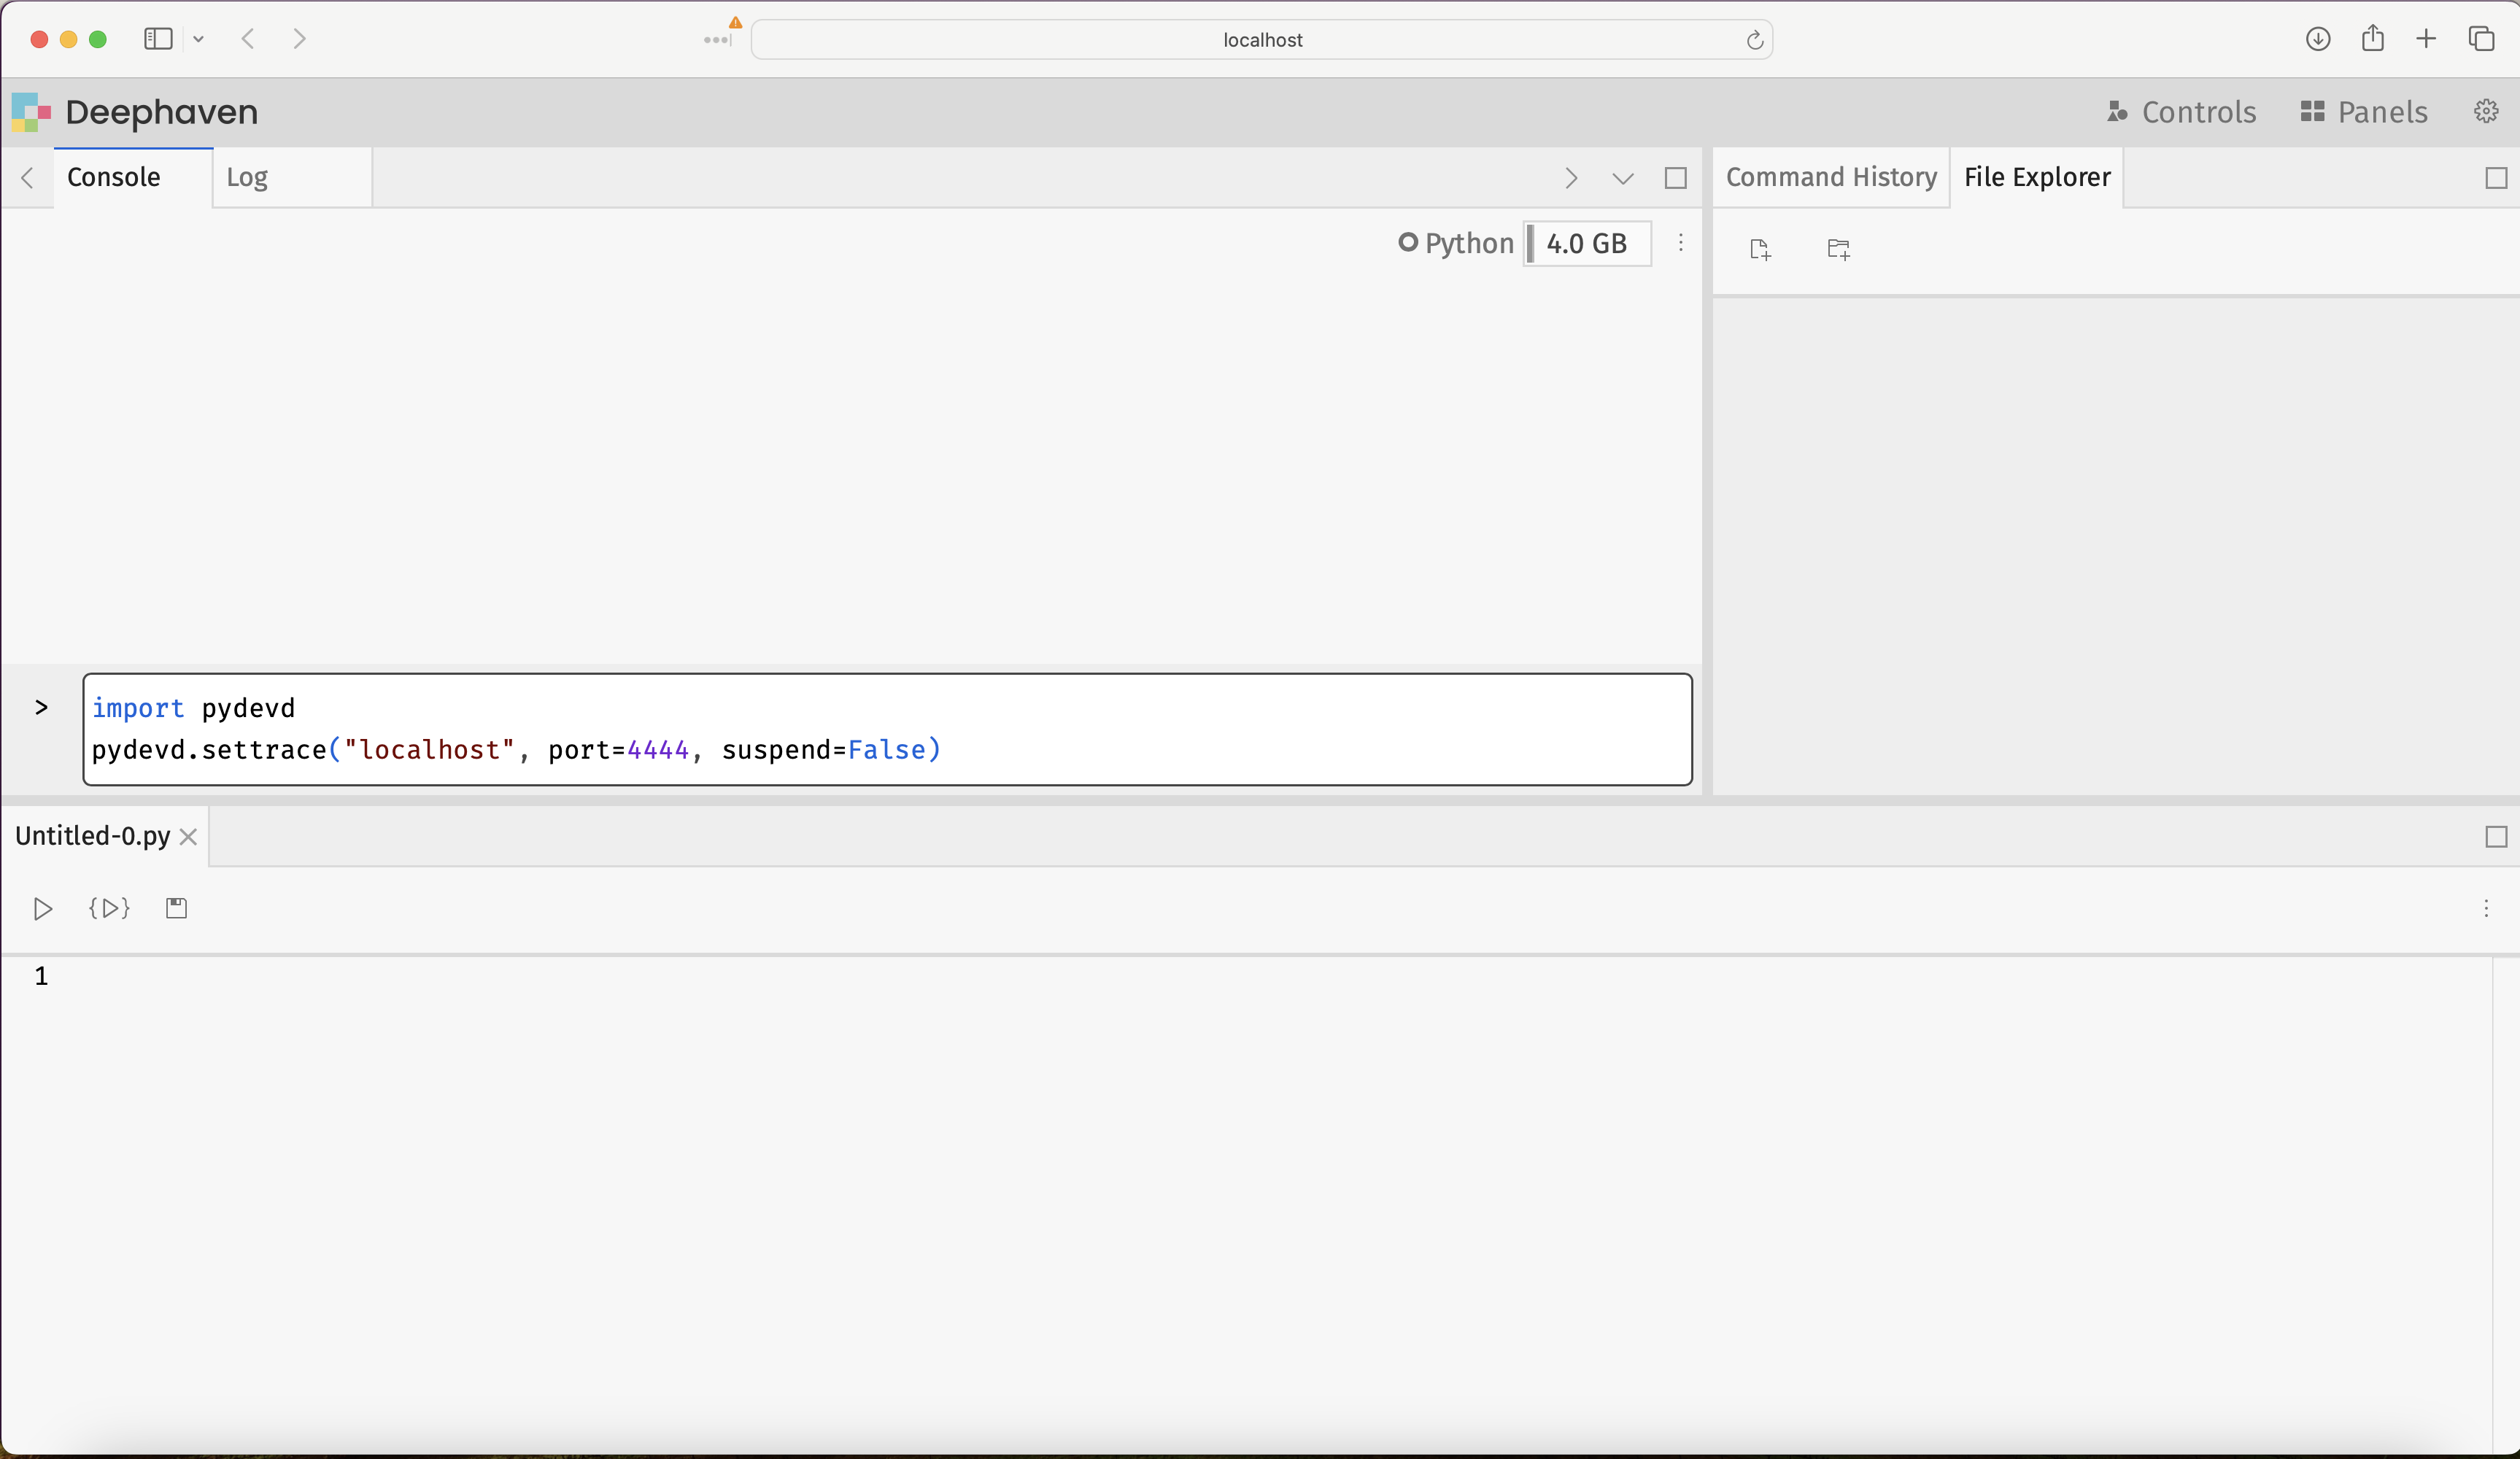
To attach the debugger, navigate to the Deephaven IDE and execute the following commands in the console:
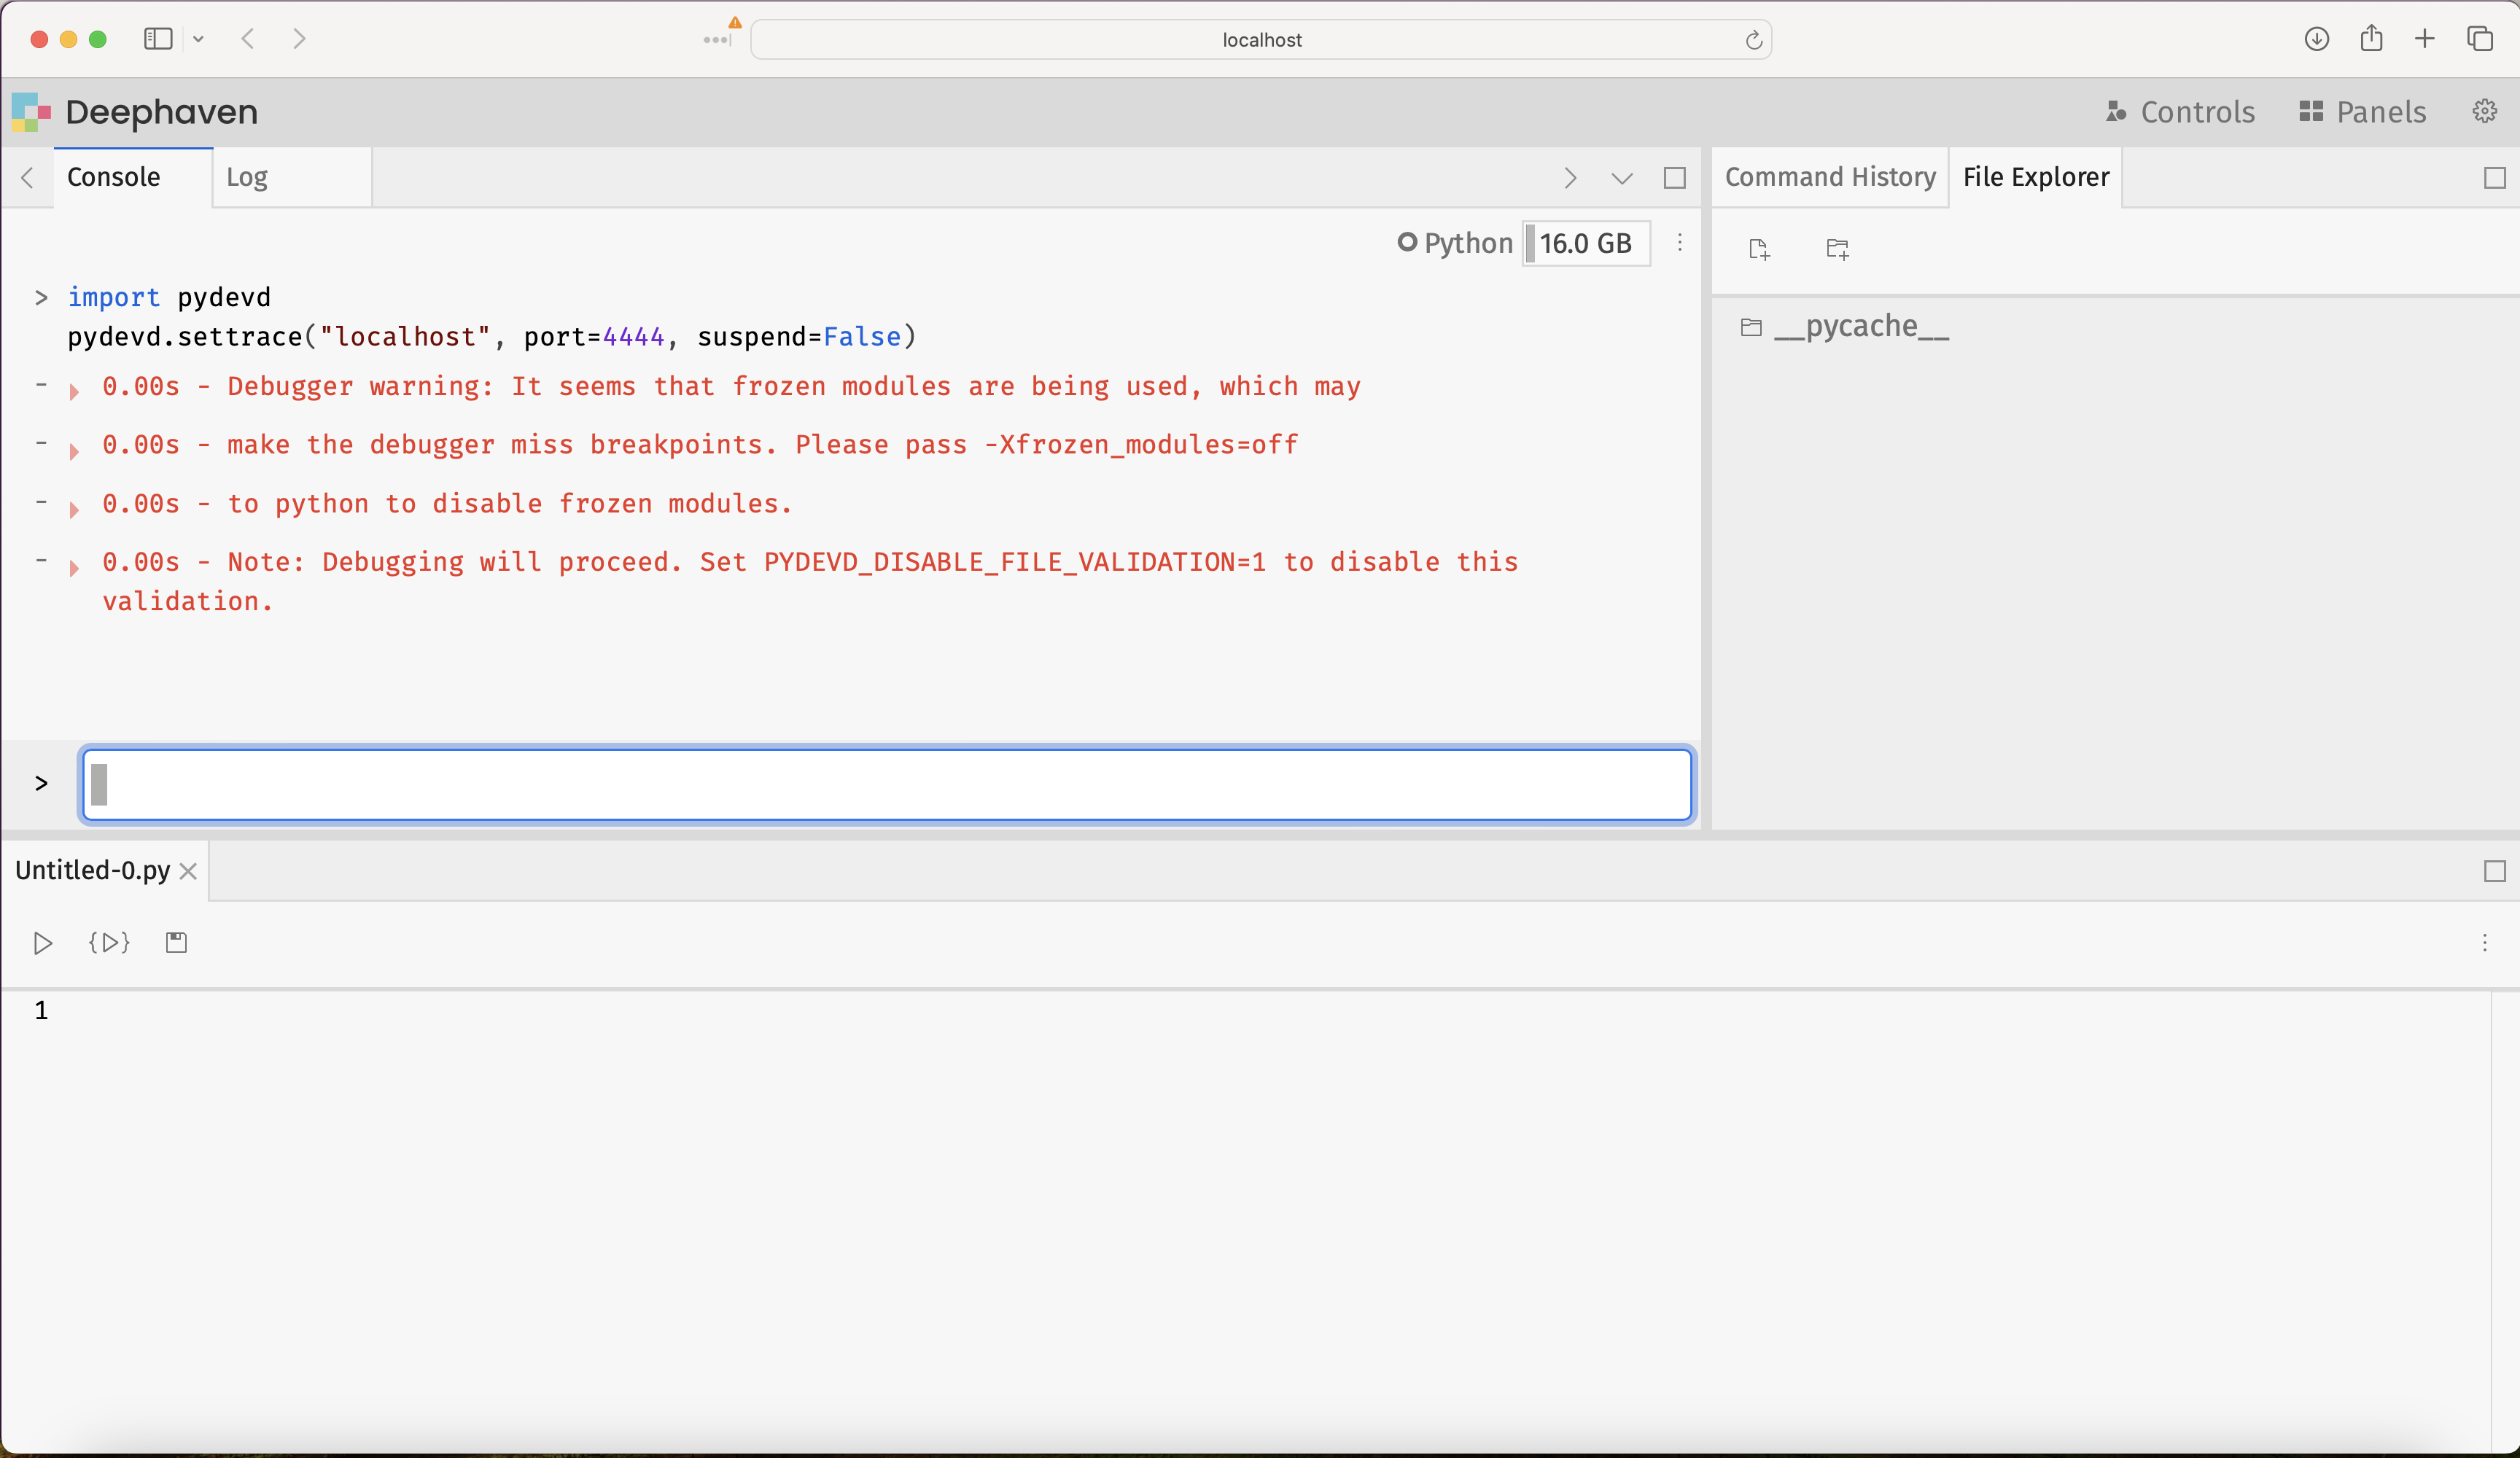
This will produce some output, indicating that Deephaven is connected to the debugger:
Navigate back to PyCharm and verify that Deephaven is connected by finding this new line of output in the debugging console:
The debugger is ready to be used!
5. Use the PyCharm debugger
Once connected, you can use the PyCharm debugger in two ways:
- Set breakpoints in PyCharm: Click in the left margin of your code editor to set breakpoints on any line in both your code and Deephaven's source.
- Use
pydevd.settrace()in code: Call this function to programmatically pause execution at that point.
After the initial connection (step 4), you no longer need to pass parameters to settrace. Here's an example using it as a breakpoint:
Navigating over to PyCharm, the debugger's full suite of capabilities is on offer. It can assist in stepping through Deephaven source code, setting breakpoints to halt execution, inspecting variables and intermediate values from deep within function calls, and much more. Many resources are available online for using PyCharm's debugger, and this Jetbrains guide is a good starting point.
There are some Deephaven-specific things to consider when debugging. Check out Common problems for issues specific to debugging Deephaven's table operations and ticking tables.
Troubleshooting
Debugger won't connect
Problem: pydevd.settrace() fails with connection error.
Solutions:
- Verify the PyCharm debug server is running (green bug icon should be active).
- Check that port 4444 is not blocked by a firewall.
- Ensure the port in
settracematches the PyCharm configuration. - Verify both the Deephaven server and PyCharm are using the same
source-dh-venvenvironment.
Gradle build fails
Problem: The ./gradlew server-jetty-app:run command fails with errors.
Solutions:
- Verify you successfully built Deephaven from source following the build guide.
- Check that you're running the gradle command from the
deephaven-corerepository root. - Ensure all build dependencies are installed.
- Try cleaning and rebuilding:
./gradlew clean build.
PyCharm can't find Deephaven source files
Problem: When debugging, PyCharm shows "Source code not available" or can't find files.
Solutions:
- Verify the PyCharm project was created from the same
deephaven-coredirectory used to build and run the server. - Check that the Python interpreter is set to
source-dh-venv. - Ensure the project structure in PyCharm matches the actual source directory structure.
Version compatibility issues
Problem: Debugger behaves unexpectedly, shows errors, or features don't work.
Solutions:
- Verify PyCharm version is 2024 or higher (earlier versions have known compatibility issues).
- Check that
pydevdversion is compatible with your PyCharm version.- Run
pip show pydevdinsource-dh-venvto check installed version. - PyCharm may suggest a specific version in the debug server configuration.
- Run
- If versions mismatch, reinstall
pydevdwith the version PyCharm recommends.